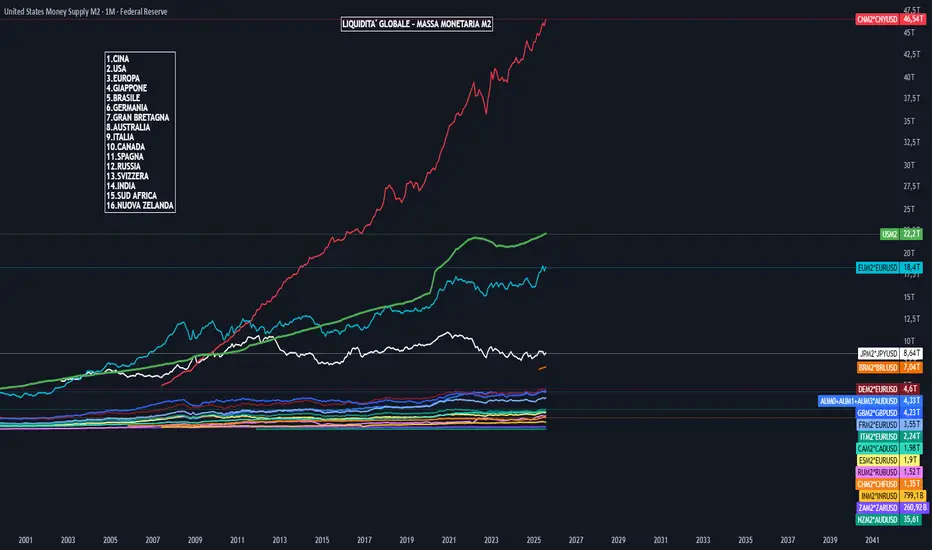
Chart Map della Massa Monetaria M2 globale rappresentativa della liquidita' dei principali Mercati Mondiali , espressa in USD (Dollaro Americano)
BRICS (Brasile Russia India Cina Sud Africa) = 56T
USA = 22T
EUROPA = 18T
ASIA (Giappone Australia New Zeland) = 13T
BRICS (Brasile Russia India Cina Sud Africa) = 56T
USA = 22T
EUROPA = 18T
ASIA (Giappone Australia New Zeland) = 13T
Disclaimer
The information and publications are not meant to be, and do not constitute, financial, investment, trading, or other types of advice or recommendations supplied or endorsed by TradingView. Read more in the Terms of Use.
Disclaimer
The information and publications are not meant to be, and do not constitute, financial, investment, trading, or other types of advice or recommendations supplied or endorsed by TradingView. Read more in the Terms of Use.