Key Points:
Trend:
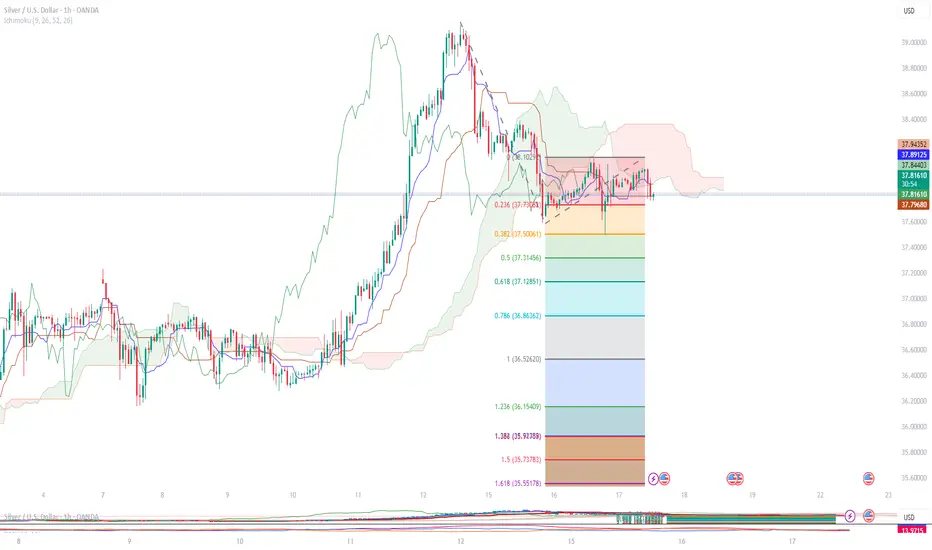
The price is below the Ichimoku cloud → showing a bearish trend.
The blue and red lines (Tenkan & Kijun) are also in a bearish position.
The price is near the 0.236 Fibonacci level (around $37.78) – acting as a weak support.
Resistance Zone:
Around $38.10 – $38.20
Support Levels (Fibonacci):
0.382 → $37.50
0.5 → $37.31
0.618 → $37.12
1.0 → $36.52
🔄 Swing Trading Idea (Sell Setup):
Direction: Sell (because the trend is weak)
Entry Zone: $37.79 – $37.83 (Current Price)
Target 1: $37.50
Target 2: $37.12
Stop Loss (SL): Above $38.10
Risk-Reward Ratio: Around 1:2
If price goes above $38.10, this sell idea will fail.
Trend:
The price is below the Ichimoku cloud → showing a bearish trend.
The blue and red lines (Tenkan & Kijun) are also in a bearish position.
The price is near the 0.236 Fibonacci level (around $37.78) – acting as a weak support.
Resistance Zone:
Around $38.10 – $38.20
Support Levels (Fibonacci):
0.382 → $37.50
0.5 → $37.31
0.618 → $37.12
1.0 → $36.52
🔄 Swing Trading Idea (Sell Setup):
Direction: Sell (because the trend is weak)
Entry Zone: $37.79 – $37.83 (Current Price)
Target 1: $37.50
Target 2: $37.12
Stop Loss (SL): Above $38.10
Risk-Reward Ratio: Around 1:2
If price goes above $38.10, this sell idea will fail.
Disclaimer
The information and publications are not meant to be, and do not constitute, financial, investment, trading, or other types of advice or recommendations supplied or endorsed by TradingView. Read more in the Terms of Use.
Disclaimer
The information and publications are not meant to be, and do not constitute, financial, investment, trading, or other types of advice or recommendations supplied or endorsed by TradingView. Read more in the Terms of Use.