I cannot have drawn a more generous downward trend line for the bears as the one that was breached last week and above which the weekly gold price closed.
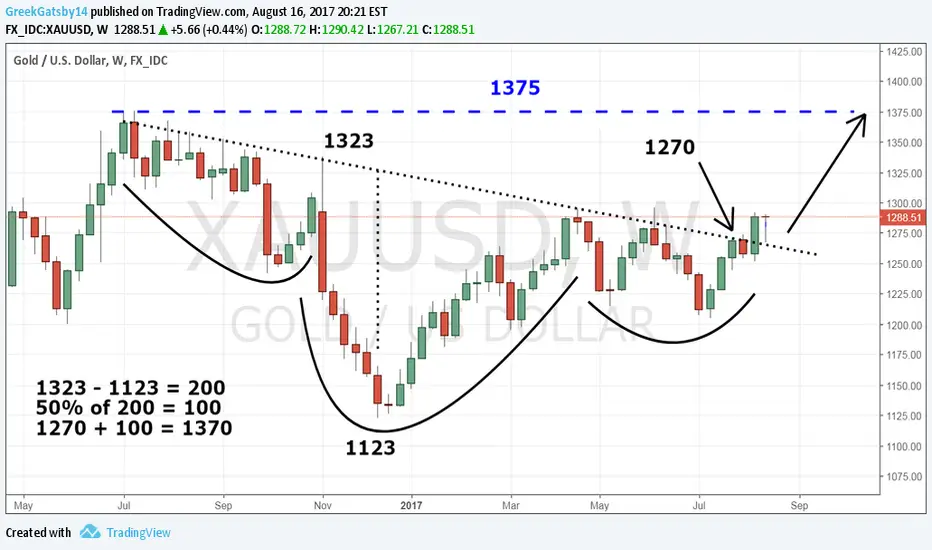
In the last couple days the gold price found support on the neckline of an INVERSE HEAD & SHOULDERS PATTERN on the weekly chart. Moving above all major daily averages and the yearly average (50-week ma) gold may take a run at the July, 2016 high if this pattern plays out.
In the last couple days the gold price found support on the neckline of an INVERSE HEAD & SHOULDERS PATTERN on the weekly chart. Moving above all major daily averages and the yearly average (50-week ma) gold may take a run at the July, 2016 high if this pattern plays out.
Disclaimer
The information and publications are not meant to be, and do not constitute, financial, investment, trading, or other types of advice or recommendations supplied or endorsed by TradingView. Read more in the Terms of Use.
Disclaimer
The information and publications are not meant to be, and do not constitute, financial, investment, trading, or other types of advice or recommendations supplied or endorsed by TradingView. Read more in the Terms of Use.