In the today's article, we will discuss the absolute basics of harmonic trading: I will explain to you what is harmonic ABCD pattern and how to recognize it, using fibonacci ratios.
The foundation of harmonic trading is impulse leg.
Impulse leg is a strong, directional bullish or bearish movement.
Harmonic traders perceive a price chart like a combination of impulse legs.
Here are the impulse legs on AUDUSD on a daily time frame. All these impulses are significant bullish or bearish movements.
In harmonic pattern trading, the impulse leg will also be called the XA leg.
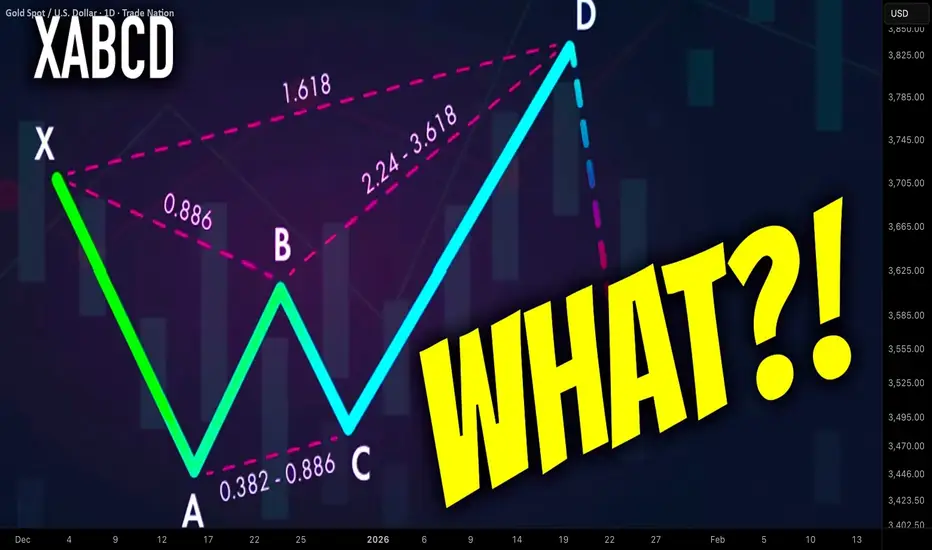
XABCD pattern is based on 4 consequent price movements.
XA leg will be a fundamental component of each harmonic XABCD pattern and the first price movement within the pattern.
The direction of the XA leg will determine the bias of the pattern:
Bullish XA will be a foundation of a bullish harmonic pattern,
while, a bearish XA leg will be a foundation for a bearish harmonic pattern.
Above, the examples of a bullish and bearish impulse legs.
After identification of XA leg, a harmonic trader should analyse a consequent price action.
AB leg will be the next movement after a completion of XA leg.
BC leg will be the movement after a completion of AB leg.
CD leg will be the movement after a completion of BC leg.
CD leg will be a completion point of a harmonic pattern.
In a bullish harmonic pattern, a bullish movement will be anticipated from D point.
Above is a structure of a bearish harmonic XABCD pattern.
There are a lot of different types of harmonic XABCD patterns: bullish/bearish Gartley, Bat, Cypher, etc...
The type of the pattern will depend on the fibonacci ratios of B, C, D points of the pattern.
B, C, D points should have very specific ratios to make a pattern harmonic.
First, a harmonic trader should measure the fibonacci retracement level of B point in XA leg.
In the example below, B point is lying between 618 and 786 retracements of XA leg.
Then, if a C point is lying beyond the range of the XA impulse, one should measure its fibonacci extension level.
If a C is lying within XA, its retracement level should be measured.
Below, we can see that C point of the pattern is lying between 618 and 786 retracements of AB.
Depending on the type of the pattern, a D point will either be based on a certain fibonacci retracement of XA leg or extension of AB leg.
In our example, the criteria for a bullish harmonic Gartley pattern are met.
The completion point of the pattern - D point will be based on 786 retracement of XA leg.
From that retracement level, a bullish movement will be anticipated.
Your task as a harmonic trader is to learn the specific rations of each harmonic pattern. With experience, you will learn to identify impulse legs and trade them profitable.
❤️Please, support my work with like, thank you!❤️
I am part of Trade Nation's Influencer program and receive a monthly fee for using their TradingView charts in my analysis.
✅Join My Telegram Channel: t.me/VasilyTrading
❗️YouTube Channel youtube.com/c/VasilyTrader
✅ Facebook: facebook.com/VasilyTrading/
⭐ My Forex & Gold Broker: bit.ly/vasilyforexbroker ⭐
❗️YouTube Channel youtube.com/c/VasilyTrader
✅ Facebook: facebook.com/VasilyTrading/
⭐ My Forex & Gold Broker: bit.ly/vasilyforexbroker ⭐
Related publications
Disclaimer
The information and publications are not meant to be, and do not constitute, financial, investment, trading, or other types of advice or recommendations supplied or endorsed by TradingView. Read more in the Terms of Use.