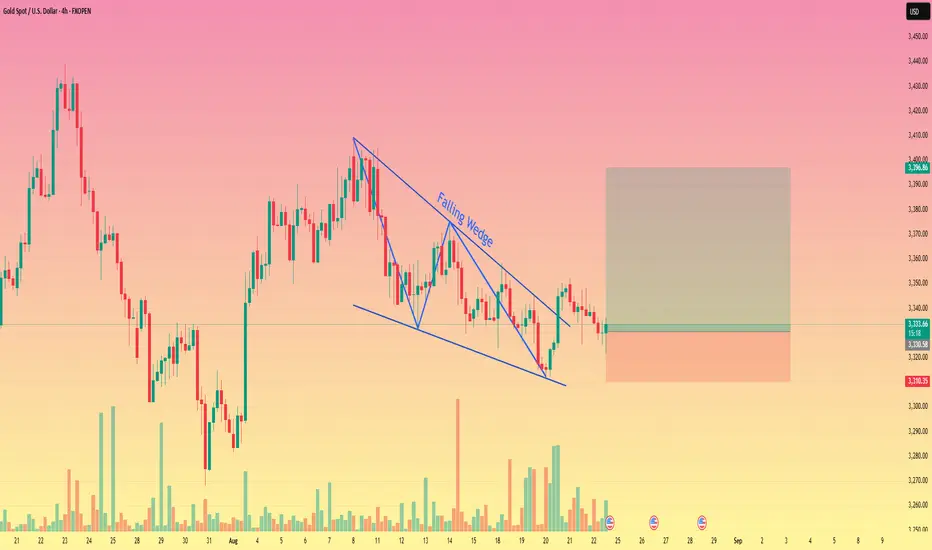
📊 Gold Spot (XAU/USD) –
A Falling Wedge has formed on the 4-hour chart.
Gold was in a steady downtrend but has now broken out from the wedge structure.
After the breakout, price is consolidating near $3,320-30, suggesting accumulation before the next move.
Notice the spike in buying volume during the wedge breakout, showing strength from buyers.
Selling volume on pullbacks appears weaker compared to buying volume.
Immediate Support: $3,310 – $3,300 zone (also stop-loss area).
Upside Levels / Targets: $3,360 → $3,380 → $3,400 (wedge breakout target zone).
Major Resistance: $3,390 – $3,400 (if broken, further bullish momentum likely).
📈 Bullish Bias: Long entries around $3,330–$3,335 with SL below $3,310.
🎯 Targets: $3,360 / $3,380 / $3,400.
📉 Invalidation: If price closes below $3,300, bullish wedge breakout fails.
The falling wedge breakout on Gold suggests a shift from bearish to bullish momentum. If the price sustains above $3,310, upside potential remains strong toward the $3,360–$3,400 zone.
Trade active
3360-3380 Targets DoneTrade closed: target reached
Disclaimer
The information and publications are not meant to be, and do not constitute, financial, investment, trading, or other types of advice or recommendations supplied or endorsed by TradingView. Read more in the Terms of Use.
Disclaimer
The information and publications are not meant to be, and do not constitute, financial, investment, trading, or other types of advice or recommendations supplied or endorsed by TradingView. Read more in the Terms of Use.