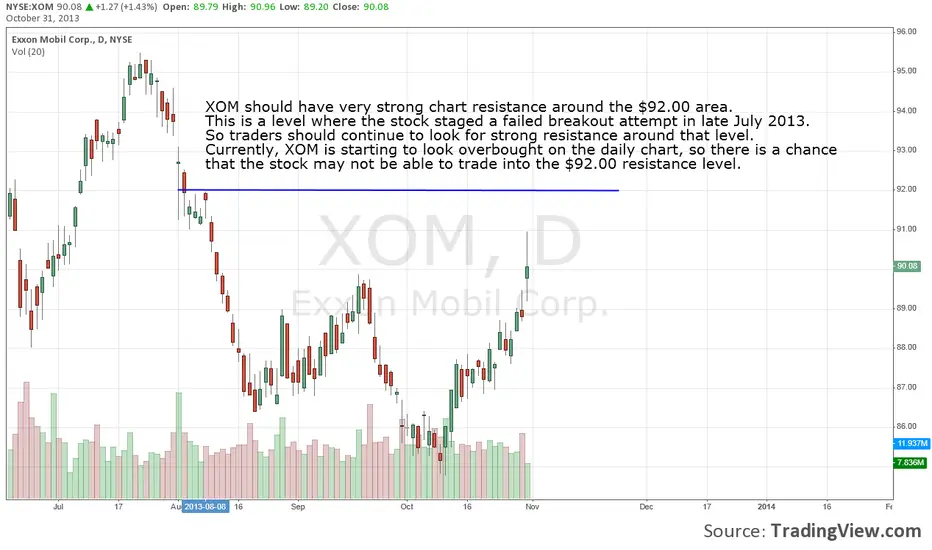
XOM should have very strong chart resistance around the $92.00 area. This is a level where the stock staged a failed breakout attempt in late July 2013. So traders should continue to look for strong resistance around that level. Currently, XOM is starting to look overbought on the daily chart, so there is a chance that the stock may not be able to trade into the $92.00 resistance level.
Nicholas Santiago
InTheMoneyStocks.com
Nicholas Santiago
InTheMoneyStocks.com
Disclaimer
The information and publications are not meant to be, and do not constitute, financial, investment, trading, or other types of advice or recommendations supplied or endorsed by TradingView. Read more in the Terms of Use.
Disclaimer
The information and publications are not meant to be, and do not constitute, financial, investment, trading, or other types of advice or recommendations supplied or endorsed by TradingView. Read more in the Terms of Use.