XAUUSD Short Idea XAUUSD short idea, sell below harmonic level (below B) with a confirmation. target till the FVG or Ride it with a trailing SL.
Community ideas

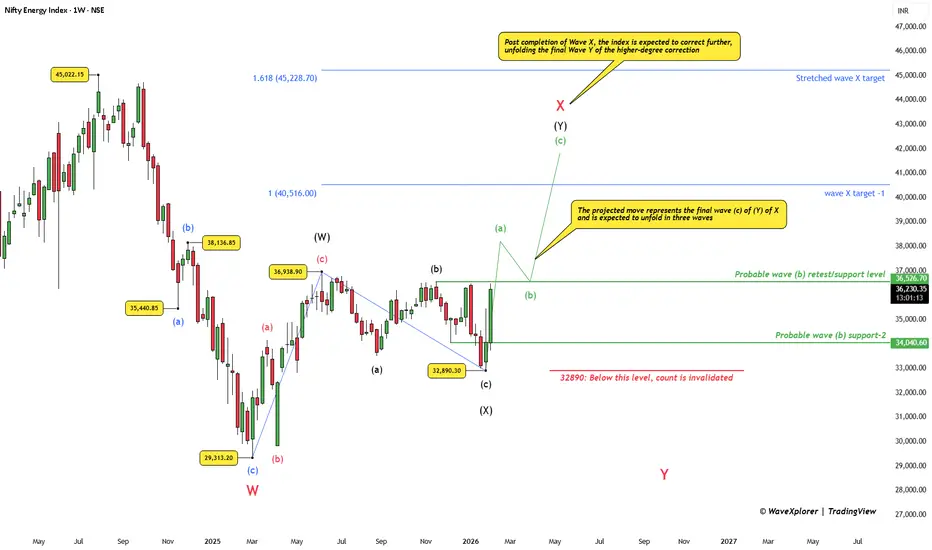
Nifty Energy: Final Bounce Before the Deeper CorrectionThe Nifty Energy Index continues to trade within a higher-degree corrective structure rather than a fresh impulsive uptrend.
The decline from the highs appears to have completed Wave W, followed by an ongoing recovery in Wave X.
In the near term, the structure allows for one more upside phase . After a probable dip in wave (b), the index may attempt a final advance via wave (c) of (Y) of X, which is expected to unfold in three waves.
This move is likely to be selective and constituent-driven. Heavyweights such as Reliance Industries, ONGC, BPCL, Tata Power, SJVN, Suzlon, NTPC, Coal India, and Power Grid Corporation may still show relative strength during this phase, contributing to the final push higher within Wave X.
However, it is important to note that this rise remains corrective in nature . It should be treated as a tactical opportunity rather than the start of a sustained bullish trend.
Once Wave X completes, the larger picture turns decisively bearish.
The index is then expected to enter Wave Y of the higher-degree correction, which could result in a sharp and more brutal decline across energy stocks, particularly if leadership from the heavyweights fades.
Key levels marked on the chart act as reference points, with a clear invalidation level below which the current corrective count would fail.
In summary:
A short-term corrective rise may still be pending, but the dominant risk lies on the downside once Wave X is done .
Disclaimer:
This analysis is for educational purposes only and does not constitute investment advice. Please do your own research (DYOR) before making any trading decisions.
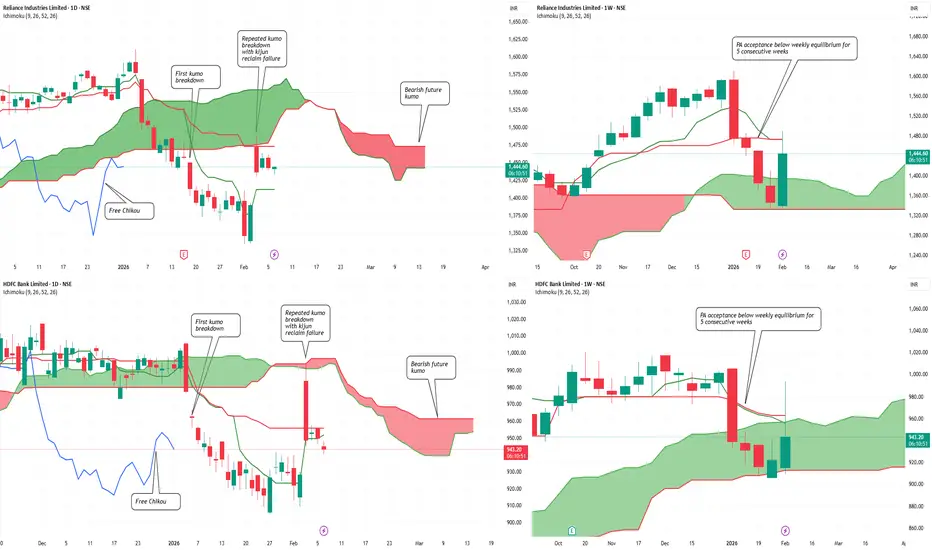
Dead Cat Bounce in Nifty? Heavyweights to Deliver The VerdictDead Cat Bounce in Nifty? Index Heavyweights to Deliver the Verdict Soon…
Both index heavyweights remain structurally weak despite the recent bounce.
On the daily timeframe, Reliance Industries and HDFC Bank have transitioned out of bullish Ichimoku regimes. Crucially, the second daily Kumo breakdown in both stocks overlaps with a failed Kijun-sen reclaim , reinforcing bearish continuation rather than base formation.
The weekly picture strengthens this caution. Price has shown multi-week acceptance below weekly equilibrium across both names, signaling institutional comfort at lower levels . Until price can reclaim and sustain above the weekly mean, the ongoing bounce risks remaining a dead cat rather than evolving into a sustainable trend reversal.
Verdict pending — and it rests squarely with these heavyweights
XAUUSD/GOLD 1H SELL LIMIT PROJECTION 06.02.26XAUUSD – 1H Sell Limit Projection | 06.02.26
“In this one-hour XAUUSD analysis, gold is currently moving within a broader corrective structure after a strong bearish impulse.
Price is approaching a key descending trendline, where we can also observe a double top formation developing near the resistance zone. This confluence area acts as a high-probability sell limit zone, aligned with previous price rejections.
The marked Resistance R1 and R2 levels highlight strong institutional supply, where sellers are expected to step back into the market. As long as price respects this trendline resistance, bearish continuation remains valid.
On the downside, the projected move targets Support S1, followed by the final bearish objective at Support S2, which also aligns with an upward trendline target acting as liquidity support.
Risk is clearly defined above the resistance zone, while reward is projected toward the lower supports, maintaining a favorable risk-to-reward structure.
This setup is purely based on price action, trendline confluence, and market structure, not indicators.
Always remember: manage risk properly and never exceed your predefined risk per trade.”

BTC 1D UpdateThe Hook: Is the floor finally in? $70k is the new battleground. 🩸📉
If you’re looking at your portfolio today, take a deep breath. Bitcoin has officially plunged below $71,000, hitting lows we haven't seen since early November 2024. We’ve wiped out over $500 billion in market cap this week alone, and nearly $1.7 billion in leveraged positions have been vaporized in the last 24 hours.
Why the panic? It’s a "perfect storm" of macro uncertainty. The market is reeling from $272 million in ETF outflows, a partial U.S. government shutdown causing delays in key economic data, and the nomination of Kevin Warsh as Fed Chair, which has investors scrambling to safe-havens like gold.
The Technical Roadmap:
The Critical Support: We are currently battling to hold the $70,129 – $70,900 zone. Losing this could trigger an accelerated slide toward the next major demand level at $68,000 or even $65,000.
The Recovery Trigger: To flip the narrative, we need to reclaim $74,434 on the daily chart. Once we flip that level back into support, the path back to $80k and beyond reopens.
Sentiment Check: The Fear & Greed Index has tanked to 11 (Extreme Fear). Historically, this level of "blood in the streets" is exactly where long-term wealth is built while the "paper hands" exit.
The Play: The smart money isn't panic-selling; they are waiting for the 4H candle to confirm buyer absorption at these levels. Don't be the exit liquidity—be the one who understands the math behind the move.
#Bitcoin #BTC #CryptoTrading #TechnicalAnalysis #TradingView #Web3 #BTCDump #MarketPanic

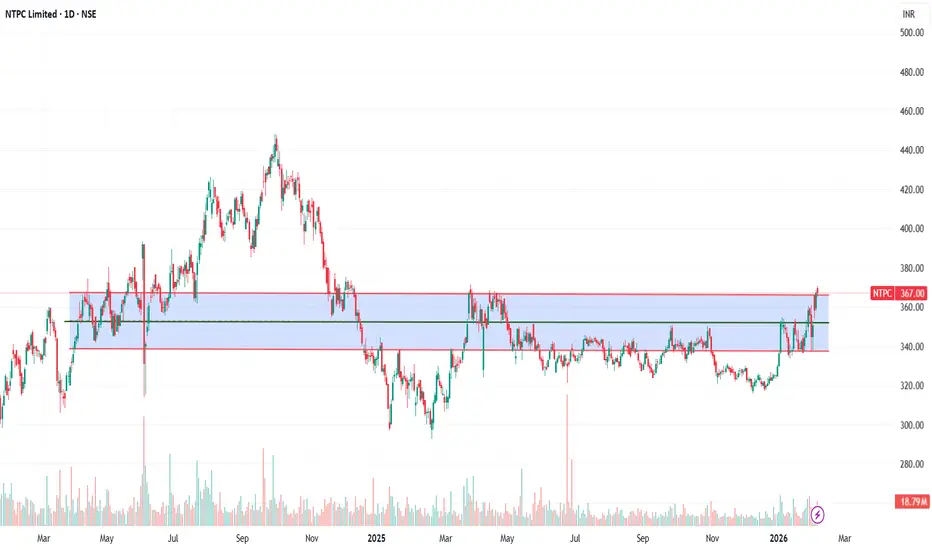
NTPC.. Moved outside the channel..NTPC.. Trying its level best to move.
Selling pressure in market pulled it back and retested the support.
Now things can be interesting..
Moved above this channel then first target can be somewhere around 370, the exact level from where it faced resistance today..
Second can be somewhere around 375 followed by 380..
Above 380, no major resistance till 390..
Downside or inside the channel, first target can be around 353 followed by 340..
Pick your trade accordingly..
All the best..
Gold PA Scalping FrameworkScanning XAUUSD to filter high-quality trade setups. No trades are forced—only structure-based opportunities.
Note: There may be a delay in this video due to upload processing time.
Disclaimer: FX trading involves high leverage and substantial risk, and losses can exceed your initial investment. This content is for educational purposes only and should not be considered financial advice. Trade at your own risk.

GOLD INTRADAY LEVELS 📉 PRIMARY SETUP: SELL ON RISE (preferred)
✅ Entry
Sell zone: 4830 – 4860
Or sell on rejection candle in this zone
🎯 Targets
T1: 4765
T2: 4700
T3: 4655 (recent low)
🛑 Stop Loss
SL: 4920 (15-min close)
🟢 ALTERNATE SETUP: BUY ONLY IF REVERSAL CONFIRMS
✅ Condition
15-min close above 4920
Follow-through buying (no long wicks)
🎯 Targets
T1: 4980
T2: 5050
🛑 Stop Loss
SL: 4860
❌ NO-TRADE ZONE
4780 – 4820 (chop / balance)

CALLED IT - Bitcoin $107K TO $66K (-40% DROP) 🚨 CALLED IT - $107K TO $66K (-40% DROP)
Remember my warning on October 18, 2025?
When everyone was screaming "TO THE MOON" at $107K, I showed you the bearish divergence and said:
"$104K breakdown could trigger a crash to $73K and $49K."
👉 RESULT: Bitcoin dropped from $107K → $66,700
That's -40% Correction, EXACTLY as predicted.
🔰PROFIT BOOKED:
→ Short from $107K to $66,700
→ $40,000+ per CRYPTOCAP:BTC move captured
→ Those who followed saved their portfolio from -40% destruction
🔰 WHAT THE CHART SHOWED:
✓ Weekly bearish divergence confirmed
✓ $104K support trendline broken
✓ Support 1 ($73K) - SMASHED
✓ Now testing $66K-$68K zone
✓ Support 2 ($48K) still possible if this breaks
🔰 THE LESSON:
This is WHY I always tell you: Never blindly follow moonboys.
Everyone wants to hear "$200K coming" but nobody wants to hear "protect your capital."
Retracements happen in EVERY market. Even in bull runs.
Am I bullish long-term? YES.
Do I ignore warning signs? NEVER.
🔰 If you followed this analysis, you either:
Saved your portfolio from -40% crash
Made massive profit on the short
Bought the dip at better prices
This is the power of REAL technical analysis, not hopium.
👉 Share this with someone who needs to see it.
More updates coming. Stay connected.

Bearish Rejection From Supply, Targets Below
Market Structure
Price previously made a blow-off top (sharp impulsive high, marked by the red arrow), followed by a strong bearish reversal, breaking short-term structure.
The subsequent bounce formed a lower high, confirming a bearish market structure shift on the intraday timeframe.
Key Zones
Gray zone (≈ 4,880–4,950): Former demand → now supply / resistance.
Price retested this area and rejected, which is classic bearish continuation behavior.
Blue zone (≈ 4,520–4,600): Major support / demand zone from the prior swing low.
Trade Idea Logic (as drawn)
Entry: Short on rejection from the gray supply zone after weak bullish retracement.
1st Target: Around 4,714 — interim support / liquidity pool.
2nd Target: The blue support zone — completion of the bearish leg and likely reaction area.
Price Action Clues
Retracement into resistance was corrective (overlapping candles), not impulsive → favors sellers.
Failure to reclaim the gray zone = sellers still in control.
Momentum points downward, aligning with the projected path.
Invalidation
A clean 45-min close and hold above the gray supply zone would weaken the bearish bias and suggest deeper consolidation or reversal.

Gold Trades the Extremes as News Fuels Liquidity Games🟡 XAUUSD – Intraday Smart Money Plan (H1)
📈 Market Context
Gold remains highly sensitive today as markets react to President Trump’s announcement, keeping USD flows unstable and risk sentiment mixed. This environment favors liquidity engineering, not trend chasing. Institutions are exploiting news-driven emotions to distribute at premium and accumulate at discount.
With volatility elevated, expect false breaks, inducements, and stop hunts around key levels rather than clean directional moves.
🔎 Smart Money Technical Read
Current State:
Price is trading inside a managed range after a buy-side liquidity grab. Intraday structure shows distribution from premium, while downside moves are corrective rather than impulsive.
Core Idea:
Let price come to Smart Money — sell premium or buy deep discount only after confirmation.
Structure Observations:
• Buy-side liquidity already delivered
• Multiple CHoCH signals confirm corrective flow
• Price respecting descending internal channel
• Discount aligns with prior sell-side liquidity
• Premium capped by institutional supply & imbalance
Liquidity Zones & Key Levels
• 🔴 SELL GOLD: 5,020 – 5,060
• 🟢 BUY GOLD: 4,720 – 4,760
🧠 Institutional Expectation
Inducement → Liquidity sweep → CHoCH / MSS → BOS → displacement → OB / FVG entry → expansion
🔴 SELL Scenario — Premium Distribution
Sell Zone: 5,020 – 5,060
Conditions:
✔ Price taps premium / prior sell-high
✔ News-driven push into resistance
✔ Bearish CHoCH or MSS on M5–M15
✔ Downside BOS confirms intent
✔ Entry via bearish OB or FVG
Targets:
• 4,950 — internal reaction
• 4,820 — range low
• Trail if momentum expands
🟢 BUY Scenario — Discount Accumulation
Buy Zone: 4,720 – 4,760
Conditions:
✔ Sweep below sell-side liquidity
✔ Discount relative to HTF range
✔ Bullish CHoCH / MSS on LTF
✔ Strong displacement confirms buyers
✔ Entry from refined bullish OB
Targets:
• 4,850 — first reaction
• 4,980 — internal liquidity
• 5,050+ — if expansion resumes
⚠️ Risk Notes
• Expect fake breakouts during headlines
• No trade without structure confirmation
• Reduce size near news spikes
• Patience > prediction
📍 Summary
Gold is a Smart Money range play today:
• Sell strength at premium
• Buy weakness only at deep discount
📌 Follow @Ryan_TitanTrader for daily Smart Money gold breakdowns.

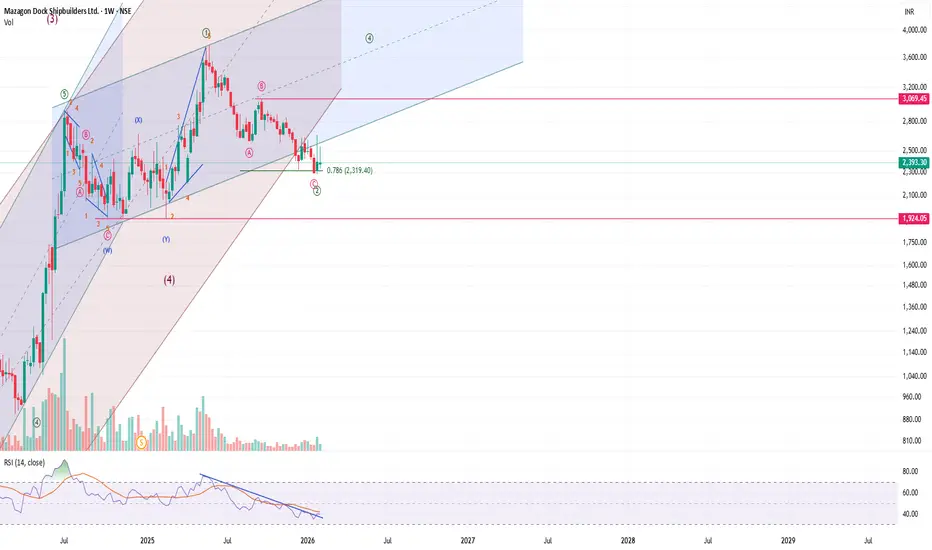
Mazdockcan do good from here. rsi is broken out on weekly and FIB level shows a good area to reverse.
Gold in a symmetric triangle Wait for break out from the triangle.
Next target 5000
If break down target 4500

XAUUSD (H2) – Liam ViewXAUUSD (H2) – Liam View
USD strength continues to limit gold | Sell-side structure still active
Quick summary
Gold remains under pressure on the H2 timeframe as a firm US Dollar keeps weighing on precious metals. The recent rebound looks corrective and lacks solid acceptance above supply. With markets positioning ahead of the delayed US Non-Farm Payrolls on Feb 11, volatility may increase, but structure still favours selling rallies.
Macro context
A stronger USD generally acts as resistance for gold and silver.
If the current USD rebound sustains, downside pressure on gold can continue.
Positioning ahead of US labour data increases the risk of liquidity-driven moves.
Technical view (H2)
After a sharp sell-off, price bounced from demand but stalled below previous distribution.
Key zones
Major sell zone: 5115 – 5130, extending toward 5535
Current reaction area: around 5000
Key demand / liquidity base: 4550 – 4580
Lower highs below resistance keep sell-side control intact unless price reclaims 5115 decisively.
Trading scenarios
Primary: Sell rallies into 5000 → 5115, targeting 4550
Continuation: Clean break below 4550 opens further downside
Invalidation: Only strong H2 acceptance above 5115 shifts bias bullish
Execution notes
Expect stop runs near data releases.
Wait for level reaction, not candle chasing.
Bias: sell rallies until structure changes.
— Liam

Stocks Breaking Out with VolumeA resistance level is a price area where a stock usually struggles to move higher. Many traders sell there, so the price keeps getting pushed down. You can think of it like a ceiling that the stock keeps hitting but cannot cross.
A breakout of resistance happens when the price finally moves above this ceiling and closes strongly above it. This means buyers have overpowered sellers. It often signals that the stock may start a new upward move because the earlier selling pressure has been absorbed.
When a stock breaks out with high volume , it becomes more reliable. Volume shows participation. High volume means many traders and institutions are buying, not just a few people. This adds strength and conviction to the move, increasing the chances that the breakout will continue instead of failing.
In simple terms:
Breakout without volume = weak signal.
Breakout with volume = more trustworthy signal
That’s why traders often say, “ Volume confirms the breakout .”
Here are a few stocks that broke out of a resistance with volume-
1. BirlaSoft:
The stock is breaking out of its previous peak with a higher average volume
2. Avenue Supermart:
Creating a higher high after long time. Although there are overhead supply zones, higher volume suggests that this could be a new beginning.
3. IOC:
Straight ride from 150 support zone to a high looking strong.
Which one do you think is stronger?
Do you hold any of them?
Do write in the comment section your views on them.
📣Disclaimer:
Everything shared here is meant for education and general awareness only. It’s not financial advice, nor a recommendation to buy, sell, or hold any asset. Do your own research, manage your risk, and make sure you understand what you’re getting into.

XAUUSD / GOLD – 1H SELL PROJECTION (05-02-2026)
Gold was moving inside a rising channel, respecting the uptrend line.
However, price failed to sustain bullish momentum and clearly broke the uptrend, indicating a market structure shift.
After the breakdown:
Price retraced back into a Fair Value Gap (FVG)
The retracement got rejected near Resistance (R1)
A Three Black Crows candlestick pattern formed, confirming strong bearish pressure
This rejection from the FVG zone after an uptrend break signals a high-probability sell continuation setup.
🔍 Confluences Used
Broken uptrend line
Fair Value Gap (Sell zone)
Resistance rejection
Three Black Crows pattern
Bearish market structure
🎯 Trade Expectation
Sell from FVG zone
Stop Loss: Above recent high
Targets:
TP1: Previous support
TP2: Lower liquidity / Support S3

SILVER Looks Sell for 27% downside Targets.Silver Chart looks very Bearish ... once it breaks last time low can slide till 54 Levels.
LTP - 75.5
Targets - 54
timeframe - 20-30 days.
Be Cautious.

Understanding the Down Trend Line Breakout : Base chart GALLANTTUnderstanding the Down Trend Line Breakout : Base chart GALLANTT ISPAT Ltd
Introduction
Gallantt Ispat Limited, currently trading around 580.00 on its daily chart, has been moving below a persistent down trend line since August 2025. Recently, the stock has shown signs of strength by forming a double bottom pattern, a classic reversal signal, and is now attempting to break above this long-standing resistance. This setup provides an interesting case study for traders and investors on how to interpret down trend line breakouts, manage risks, and identify potential entry points.
What is a Down Trend Line?
A down trend line is drawn by connecting successive lower highs on a chart.
It acts as a resistance line, showing the prevailing bearish sentiment.
As long as price remains below this line, sellers dominate.
A breakout above the line often signals a shift in market psychology from bearish to bullish.
Importance of the Down Trend Line Breakout
Psychological Shift: A breakout indicates buyers are gaining control.
Volume Confirmation: Strong volume during breakout adds credibility.
Trend Reversal Potential: Especially when supported by reversal patterns like the double bottom.
Opportunity Zone: Traders often look for such setups to capture early stages of a new uptrend.
Risk Management in Breakout Trading
Trading breakouts can be rewarding but also risky if false signals occur. Key principles:
Wait for Confirmation: Avoid jumping in on the first candle above the line; look for sustained price action.
Use Stop Losses: Place stops below recent swing lows or the breakout level to limit downside.
Position Sizing: Never risk more than a small percentage of capital on a single trade.
Avoid Emotional Trading: Stick to a plan rather than chasing moves.
How to Enter Down Trend Line Breakouts
Aggressive Entry: Buy immediately on breakout with tight stop loss.
Conservative Entry: Wait for a retest of the trend line (now support) before entering.
Volume-Based Entry: Enter only if breakout is accompanied by above-average volume.
Pattern Confirmation: In Gallantt Ispat’s case, the double bottom adds conviction to the breakout attempt.
Key Takeaways for Investors & Traders
Trend lines matter: They reflect collective market psychology.
Breakouts need confirmation: Volume and sustained price action are crucial.
Risk management is non-negotiable: Protect capital with stops and sizing discipline.
Gallantt Ispat’s setup: The double bottom plus breakout attempt makes this chart worth monitoring closely.
Patience pays: Waiting for confirmation often saves traders from false breakouts.
Conclusion
Gallantt Ispat Limited’s daily chart is at a critical juncture. After months of trading under a down trend line, the stock is now attempting to break free, supported by a double bottom formation. For traders, this is a textbook scenario to study the dynamics of breakout trading. The lesson here is clear: respect the trend line, manage risk diligently, and enter with discipline when the breakout is confirmed.

Mastering Advanced Option Trading StrategiesFoundation: What Makes a Strategy “Advanced”
Advanced option strategies differ from basic ones in three key ways:
Multi-leg structures – Using two or more option contracts simultaneously
Risk-defined frameworks – Maximum loss and profit are known in advance
Volatility-based logic – Trades are often placed based on implied volatility (IV), not just price direction
These strategies are designed to optimize probability of profit, time decay (Theta), and volatility shifts, rather than relying solely on price movement.
Understanding the Greeks at an Advanced Level
Before executing advanced strategies, traders must internalize the option Greeks:
Delta – Measures directional exposure
Gamma – Rate of change of Delta (critical near expiry)
Theta – Time decay, a major income driver
Vega – Sensitivity to volatility changes
Rho – Interest rate sensitivity (minor but relevant in long-dated options)
Advanced traders do not avoid Greeks—they engineer trades around them.
Advanced Directional Strategies
1. Bull Call Spread and Bear Put Spread
These are risk-defined directional strategies.
Bull Call Spread: Buy a lower strike call, sell a higher strike call
Bear Put Spread: Buy a higher strike put, sell a lower strike put
Why advanced traders use them:
Lower cost than naked options
Reduced impact of volatility crush
Higher probability of controlled returns
These spreads are ideal when you expect moderate directional movement, not explosive breakouts.
2. Ratio Spreads
A ratio spread involves buying fewer options and selling more at another strike (e.g., buy 1 call, sell 2 calls).
Key characteristics:
Often initiated for low or zero cost
Profitable in a specific price range
Can become risky if price moves aggressively
Ratio spreads are best suited for traders who deeply understand Gamma risk and can actively manage positions.
Non-Directional and Income Strategies
3. Iron Condor
One of the most popular advanced strategies.
Structure:
Sell a call spread
Sell a put spread
Market outlook: Range-bound / low volatility
Advantages:
High probability of profit
Defined risk
Profits from time decay
Iron Condors are volatility trades. Advanced traders deploy them when implied volatility is high and expected to contract.
4. Butterfly Spreads
Butterflies are precision strategies.
Structure (Call Butterfly example):
Buy 1 lower strike call
Sell 2 middle strike calls
Buy 1 higher strike call
Best used when:
Expect price to expire near a specific level
Volatility is expected to fall
Butterflies offer high reward-to-risk ratios, but require accurate price targeting and timing.
Volatility-Based Strategies
5. Straddle and Strangle
These are pure volatility plays.
Straddle: Buy call and put at same strike
Strangle: Buy call and put at different strikes
Used when:
Expect a large move but unsure of direction
Ahead of earnings, events, or policy announcements
Advanced traders focus less on direction and more on whether realized volatility will exceed implied volatility.
6. Calendar Spreads
A calendar spread involves selling a near-term option and buying a longer-term option at the same strike.
Benefits:
Positive Theta
Positive Vega
Limited risk
Calendars work best when:
Short-term volatility is overestimated
Long-term volatility remains stable
They are commonly used by professionals to trade volatility structure, not price.
Advanced Hedging and Portfolio Strategies
7. Synthetic Positions
Options can replicate stock positions:
Synthetic Long Stock: Long call + short put
Synthetic Short Stock: Long put + short call
These are capital-efficient and useful for:
Regulatory constraints
Margin optimization
Tax or funding considerations
8. Delta-Neutral Strategies
Advanced traders often aim to remain direction-neutral while earning from Theta and Vega.
Examples:
Delta-neutral Iron Condors
Delta-hedged straddles
Delta neutrality requires active adjustments, especially as Gamma increases near expiry.
Risk Management: The Real Edge
Advanced option trading is less about finding the “best strategy” and more about risk control.
Key principles:
Never risk more than a small percentage of capital per trade
Predefine exit rules (profit targets and stop-losses)
Avoid overtrading during low-liquidity conditions
Adjust positions rather than panic-closing
Professional traders think in probabilities, not predictions.
Psychological Mastery
Options trading amplifies emotions due to leverage and time pressure.
Advanced traders develop:
Patience to let Theta work
Discipline to exit losing trades early
Emotional detachment from individual outcomes
Consistency comes from executing a well-tested process repeatedly—not chasing perfect trades.
Conclusion
Mastering advanced option trading strategies is a journey that blends mathematics, psychology, and market intuition. These strategies allow traders to profit in almost any market environment, but they demand respect for risk, deep understanding of volatility, and strict discipline. Success does not come from complexity alone—it comes from using the right strategy at the right time, for the right reason.
When advanced options trading is approached as a probability business rather than a prediction game, it becomes one of the most powerful tools in modern financial markets.

IEX: Stuck in the 'Coupling' CrosshairsIEX is currently a "headline-driven" stock. Despite reporting a record 13,050 MU trading volume in January 2026 (up 19.6% YoY), the share price remains suppressed. The primary culprit is the CERC’s Market Coupling directive, which threatens to dilute IEX’s 85-90% dominance in the Day-Ahead Market (DAM) by centralizing price discovery.
The Technical Setup (Next 1-4 Day Outlook)
The Resistance Wall: The zone between 126.00 and 128.10 has become a formidable supply area. Sellers have consistently emerged here, preventing any meaningful recovery.
The Failed Jump: After hitting a recent low near 119.00, the stock attempted a relief rally but lacked the "follow-through" volume to pierce the 126 resistance.
Bullish Pivot: A decisive break above 128.10 on strong volume would invalidate the immediate bearish structure, opening a quick path to 132.10.
Bearish Continuation: As long as it trades below 126.00, the path of least resistance remains down. A slip below recent intraday supports could drag the price toward the 120.50 target.
Fundamental Headwinds & Tailwinds
Regulatory Cliffhanger: The Electricity Appellate Tribunal (APTEL) is currently hearing IEX's challenge against market coupling. Any negative headline regarding the January/February hearings keeps big buyers away.
Earnings vs. Price Action: IEX reported a Net Profit of ₹119 Cr for Q3 FY26 (up 11% YoY) and declared an interim dividend of ₹1.50. However, the market treated this as a "sell-on-news" event because the volume growth is being overshadowed by the risk of lower trading margins in a coupled regime.
Institutional Exit: Recent data shows Mutual Funds and FIIs have decreased their holdings in the December 2025 quarter, suggesting institutional caution until the regulatory fog clears.

What is Multi confluence Strategy making ?In this video I am showcasing how to create multiple confluences and decrease the no of frequency of trades you get to filter out A+ setups .
I am using charts older than 3 months to showcase the same

Why Bitcoin’s Stability Is a Warning, Not StrengthBitcoin’s inability to participate in the recent “debasement trade” is not a sign of hidden strength — it’s a sign of waning relevance in the current macro cycle.
While gold and silver surged during the final euphoric phase, Bitcoin’s stagnation near $82,000 suggests that capital actively chose hard assets over digital ones, not that Bitcoin avoided speculative excess. In other words, investors didn’t “miss” Bitcoin — they rejected it.
Rather than having “less froth to shed,” Bitcoin may simply lack incremental demand. The market has already priced in its scarcity narrative, ETFs, and institutional adoption. Without a new catalyst, stability becomes distribution, not consolidation.
The idea that liquidity exiting metals will rotate into crypto assumes that Bitcoin is viewed as a safe alternative store of value. Current flows argue the opposite: in periods of uncertainty, capital is choosing tangible, historically defensive assets, not high-volatility digital instruments.
Bitcoin’s scarcity also cuts both ways. Unlike gold and silver, Bitcoin has no industrial or sovereign demand floor. If speculative demand dries up, there is nothing to absorb sell pressure. Scarcity without utility can amplify downside, not protect against it.
If the Warsh nomination triggers prolonged global liquidity tightening, Bitcoin is likely to suffer more than metals, not less. Cryptocurrencies remain among the most liquidity-sensitive risk assets. Tightening doesn’t just pressure them — it starves them.
Bottom line
Bitcoin’s calm may not be coiled strength. It may be complacency before repricing.
In this view, metals already flushed excess and proved their role. Bitcoin still has to.

Fast-Growing Sectors with Strong Investment Potential1. Technology and Digital Transformation
Technology remains the most powerful long-term growth engine across global markets. Digital transformation is no longer optional for businesses—it is essential for survival.
Key Growth Drivers
Artificial Intelligence (AI) and Machine Learning
Cloud Computing and Software-as-a-Service (SaaS)
Cybersecurity and Data Protection
Semiconductor demand from EVs, AI, and IoT
Automation and Robotics
Investment Appeal
Technology companies benefit from high scalability, strong margins, and recurring revenue models. Once developed, software can be distributed at minimal incremental cost, allowing exponential growth. AI adoption is expanding across finance, healthcare, manufacturing, retail, and defense, creating massive cross-sector demand.
Risks
High valuations during bull cycles
Regulatory scrutiny
Rapid technological obsolescence
Despite volatility, technology remains a core long-term wealth creator.
2. Renewable Energy and Clean Technology
The global push toward decarbonization has placed renewable energy at the center of economic policy and investment strategy.
Key Growth Areas
Solar and Wind Power
Green Hydrogen
Energy Storage (Lithium-ion, solid-state batteries)
Electric Vehicle (EV) infrastructure
Carbon capture and sustainability tech
Investment Appeal
Governments worldwide are offering subsidies, tax incentives, and policy support for clean energy. Rising fossil fuel costs and climate regulations accelerate the shift toward renewables. Energy storage solutions are critical for grid stability, creating long-term demand.
Risks
Capital-intensive projects
Policy dependency
Technology cost fluctuations
This sector benefits from multi-decade demand visibility, making it attractive for patient investors.
3. Healthcare and Biotechnology
Healthcare is a classic defensive sector, but innovation has turned it into a high-growth industry as well.
Key Growth Segments
Biotechnology and Genomics
Medical Devices
Digital Health and Telemedicine
Pharmaceutical R&D
Diagnostics and Imaging
Investment Appeal
An aging global population, rising chronic diseases, and increased healthcare access in emerging markets ensure consistent demand. Biotechnology firms working on cancer, rare diseases, and gene therapies offer asymmetric return potential.
Healthcare also tends to perform well during economic slowdowns, providing portfolio stability.
Risks
Regulatory approvals
High R&D costs
Patent expirations
Despite risks, healthcare combines growth + defensiveness, making it highly attractive.
4. Financial Technology (FinTech) and Digital Payments
FinTech is transforming how individuals and businesses manage money, credit, and investments.
Key Growth Areas
Digital Payments and UPI-based platforms
Online Lending and BNPL (Buy Now Pay Later)
Digital Banking and Neobanks
Blockchain and Tokenization
InsurTech and WealthTech
Investment Appeal
Increasing smartphone penetration and internet access drive rapid adoption, especially in emerging markets. FinTech companies often operate with lower costs, higher customer reach, and data-driven decision-making compared to traditional financial institutions.
Risks
Regulatory uncertainty
Credit cycle risks
Intense competition
FinTech remains one of the fastest-growing sectors due to its ability to disrupt traditional finance.
5. Electric Vehicles (EVs) and Mobility Solutions
Transportation is undergoing its biggest transformation in a century.
Key Growth Drivers
EV manufacturing
Battery technology
Charging infrastructure
Autonomous driving systems
Shared mobility platforms
Investment Appeal
Governments are setting deadlines to phase out internal combustion engines. Lower operating costs and improving battery efficiency are driving consumer adoption. The EV ecosystem includes not just vehicle makers but also component suppliers, battery manufacturers, and software providers.
Risks
High competition
Raw material supply constraints
Technological execution risk
EVs represent a full ecosystem investment theme, not just an automobile trend.
6. Infrastructure and Capital Goods
Infrastructure development is critical for economic growth, especially in developing economies.
Key Growth Segments
Roads, Railways, and Metro Projects
Power Transmission and Distribution
Ports, Airports, and Logistics
Defense Manufacturing
Heavy Engineering
Investment Appeal
Government-led spending provides long-term revenue visibility. Infrastructure projects create multiplier effects across steel, cement, capital goods, and logistics industries. In countries like India, infrastructure remains a multi-decade growth story.
Risks
Execution delays
Debt-heavy balance sheets
Policy changes
Well-managed companies with strong order books benefit significantly during infrastructure upcycles.
7. Consumer Discretionary and Premium Consumption
Rising incomes and urbanization are reshaping consumption patterns.
Key Growth Drivers
Premium brands and aspirational products
Organized retail and e-commerce
Travel, tourism, and hospitality
Entertainment and digital media
Investment Appeal
As middle-class incomes rise, spending shifts from necessities to discretionary items. Strong brands enjoy pricing power, customer loyalty, and high return on capital. Premiumization is a powerful long-term theme.
Risks
Economic slowdowns
Inflation impact on consumer spending
Consumer discretionary stocks perform best during economic expansions and income growth cycles.
8. Defense and Aerospace
Geopolitical uncertainty has renewed global focus on defense capabilities.
Key Growth Areas
Indigenous defense manufacturing
Aerospace components
Cyber defense systems
Space technology and satellites
Investment Appeal
Defense spending is largely non-cyclical and supported by government budgets. Long-term contracts provide revenue stability. The commercialization of space technology adds an additional growth layer.
Risks
Dependence on government contracts
Long gestation periods
Defense offers a blend of growth, stability, and strategic importance.
Conclusion
Fast-growing sectors with strong investment potential share common traits: structural demand, innovation-driven growth, policy support, and scalable business models. Technology, renewable energy, healthcare, FinTech, EVs, infrastructure, consumer discretionary, and defense are positioned to outperform over the long term.
However, successful investing requires more than identifying the right sector. Investors must evaluate company fundamentals, management quality, valuation discipline, and risk management. Diversifying across multiple high-growth sectors helps balance volatility while capturing long-term upside.
In an era of rapid change, aligning capital with transformational industries remains one of the most powerful strategies for sustainable wealth creation.
