Why breakout entries fail (and how I wait for confirmation)Most breakout losses happen because entries are too early.
Instead of chasing the breakout, I wait for:
1) A clearly defined range
2) A clean breakout
3) Pullback / acceptance into the range
4) Continuation confirmation
This simple framework helps avoid fake moves and improves risk–reward.
I later automated this process into a private tool to remove subjectivity,
but the logic itself is what matters most.
This chart shows one example on XAUUSD using a higher timeframe.
Gold

GOLD/SILVER RatioChart is self explanatory. The price of the TVC:GOLD/TVC:SILVER ratio (XAU/XAG) as of January 1, 2026, is approximately 60.71. This indicates that one ounce of gold is worth roughly 60.71 ounces of silver. Over the past year, the ratio has seen a significant change, trading within a 52-week range of 54.19 to 107.27.
Recent trends
* Market Sentiment and Economic Conditions: When economic uncertainty is high, investors typically flock to gold as a safe-haven asset, which widens the ratio (increases the number).
* Industrial Demand for Silver: Silver has significant industrial applications (electronics, solar panels), so its price often correlates with economic growth and industrial demand, which can narrow the ratio.
* Relative Volatility: Silver is generally more volatile than gold ("high-beta" version of gold); in a bull market for precious metals, silver prices tend to rise faster, lowering the ratio, while in a bear market, gold prices tend to hold up better, increasing the ratio.
Key Insights
* Ratio Fluctuation: The gold-silver ratio is highly volatile. Historically, the all-time high was 125:1 in April 2020.
* Recent Volatility: Both gold and silver have experienced significant price movements in 2025, driven by factors such as interest rate expectations, geopolitical tensions, and industrial demand for silver.
* Price Influences: Domestic gold and silver prices in India are influenced by international market trends, currency exchange rates, local demand, taxes, and import duties.
Gold-Silver Ratio and Future Price Predictions
The gold-silver ratio (calculated by dividing the gold price by the silver price) indicates which metal may be undervalued or overvalued compared to the other and helps anticipate potential out performance.
* High Ratio (e.g., above 80:1 or 90:1): Historically suggests that silver is undervalued relative to gold. This often signals a potential buying opportunity for silver, with expectations that silver's price may rise faster than gold's, causing the ratio to decrease (revert to its mean). A high ratio can also indicate economic uncertainty or a flight to gold's safe-haven appeal.
* Low Ratio (e.g., below 50:1 or 60:1): Historically suggests that silver is overvalued relative to gold. This may signal a potential buying opportunity for gold, with expectations that gold may outperform silver, causing the ratio to increase. A low ratio often coincides with periods of economic optimism and stronger industrial demand for silver.
Current Market Insights
As of late December 2025/early January 2026, the gold-silver ratio has recently fluctuated, with reports placing it around 60.53 to 64:1, down from highs earlier in 2025 that exceeded 100:1. The sharp drop in the ratio during 2025 signaled a strong out performance by silver.
* Silver Out performance Expected: Many analysts believe silver is still cheap relative to its long-term historical average ratio (around 40-60:1 or 60-80:1) and could continue to outperform gold.
* Key Drivers: Silver's strong industrial demand (especially in solar panels and electronics), coupled with persistent supply deficits, provides fundamental support for its price to potentially reach higher levels like $85-$100 per ounce in the medium to long term.
* Volatility and Risk: Silver is generally more volatile than gold, which means it has the potential for higher percentage gains but also larger pullbacks. Investors use the ratio as one of several tools to balance their portfolios, rather than relying on it as a sole predictor.
Disclaimer: This is for demonstration and educational purpose only. This is not buying or selling recommendations. I am not SEBI registered. Please consult your financial advisor before taking any trade.

How Emotions Destroy Profitable TradersHow Emotions Destroy Profitable Traders
🧠 How Emotions Destroy Profitable Traders | Trading Psychology Explained
Most traders don’t fail because of strategy.
They fail because they can’t control emotions.
Even a profitable system becomes useless when emotions take control of decision-making. Let’s break it down 👇
😨 Fear: The Profit Killer
Fear appears after losses or during volatility.
What fear causes:
Closing trades too early
Missing high-probability setups
Moving stop losses emotionally
📉 Result: Small wins, big regrets.
Fear stops traders from letting probabilities play out.
😤 Greed: The Account Destroyer
Greed appears after wins.
What greed causes:
Overleveraging
Ignoring risk management
Holding trades too long
📈 Traders want “more” and end up losing everything.
Greed turns discipline into gambling.
😡 Revenge Trading: The Fastest Way to Blow an Account
After a loss, many traders try to win it back quickly.
Revenge trading leads to:
Random entries
No confirmations
Breaking trading rules
🔥 One emotional trade often leads to many bad trades.
🤯 Overconfidence After Wins
Winning streaks create false confidence.
Overconfidence causes:
Larger position sizes
Ignoring market context
Believing losses “won’t happen”
Markets punish ego — always.
😴 Impatience: Silent Consistency Killer
Good trades require waiting.
Impatience leads to:
Forcing setups
Trading low-quality zones
Entering without confirmation
⏳ The market rewards patience, not speed.
🧘♂️ How Profitable Traders Control Emotions
Professional traders don’t eliminate emotions — they manage them.
Key habits:
Fixed risk per trade
Pre-planned entries & exits
Accepting losses as part of business
Waiting for confirmation
Trading less, not more
🧠 Discipline > Emotion
📊 Process > Outcome
📌 Final Thought
If emotions control your trades, the market will control your money.
Master your psychology, and your strategy will finally work.
Trade the plan.
Respect risk.
Stay patient.

Why Gold Hits Your SL🌟 Why Gold Hits Your SL 😭💛📈
Gold is one of the most aggressive and volatile assets in the market — and if you’ve ever wondered “Why does gold ALWAYS hit my stop-loss before moving in my direction?”, this post explains the real reason.
Let’s break it down clearly 👇
🔶 1. Gold Loves Liquidity — Not Levels 💦💰
Gold doesn’t move based on your support/resistance lines.
It moves based on liquidity, meaning:
Where traders place stop-losses ❌
Where pending orders sit 🎯
Where large institutions want to fill positions 🏦
Your SL is simply sitting where everyone else puts theirs, which makes it prime liquidity.
🔶 2. XAUUSD Spikes Are Designed to Collect Orders ⚡💥
Gold often creates sudden:
Wicks
Fake breakouts
Quick pumps or dumps
Sharp candle spikes
These moves are NOT random — they’re engineered to:
🔸 Trigger stop-losses
🔸 Activate pending buy/sell orders
🔸 Grab liquidity before the real move
This is why your SL gets hit by $1–$3 before price completely reverses.
🔶 3. Gold Moves Session-by-Session 🕒🌍
Gold behaves differently depending on the time of day:
Asia session → Slow, tight range
London session → First big manipulation
New York session → Volatility explosion + real direction
Most SL hunts take place when London opens or when NY session begins ⚠️🔥
🔶 4. Clean Highs & Lows = SL Magnets 🧲📌
Gold LOVES attacking:
Previous day’s high/low
Asian range high/low
London session extremes
Double tops & bottoms
Round numbers (like 4000 / 4050 / 4100)
These areas hold thousands of stop-losses.
So before gold takes a real direction — it sweeps them first. 🏹😈
🔶 5. The Classic Gold Pattern: Trap → Reversal → Expansion 🔁🚀
Most XAUUSD moves follow this sequence:
1️⃣ Sweep liquidity 😭
2️⃣ Fake breakout 😈
3️⃣ Sharp rejection 👋
4️⃣ Real trend begins 🚀
If you’ve ever seen price:
Break a level
Wick hard
Then reverse the entire move
That’s gold performing a liquidity grab.
🔶 6. How To Avoid Getting Stopped Out ✔️
Here’s what actually helps:
🌟 A. Don’t put SL exactly at obvious levels
Move it beyond common liquidity zones.
🌟 B. Wait for the sweep before entering
Let gold perform the trap first.
🌟 C. Trade reaction — not prediction
Look for re-entry after the wick forms.
🌟 D. Use sessions to your advantage
Avoid placing SL right before London/NY opens.
🌟 Final Words
Gold isn’t hunting you —
it’s hunting liquidity.
Your job is simple:
👉 Stop placing stops where everyone else does
👉 Let gold sweep liquidity first
👉 Then catch the real move
Trade smarter, not tighter. 💛⚡

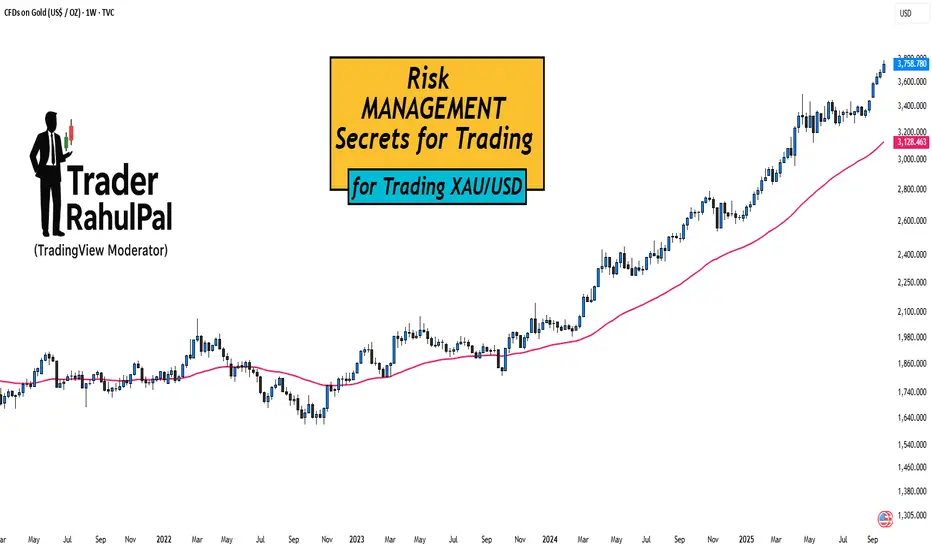
Risk Management Secrets for Trading XAU/USD!Hello Traders!
Gold (XAU/USD) is one of the most rewarding instruments, but also one of the most dangerous if you don’t manage risk properly.
Many traders lose not because their strategy is bad, but because they fail to protect their capital.
Here are some key risk management secrets every gold trader must know.
1. Position Sizing is Everything
Gold moves fast, a $5 move can wipe out accounts if the lot size is too big.
Always calculate position size based on risk per trade (ideally 1–2% of your account).
This way, even if you hit multiple stop losses, your account survives.
2. Wider Stops, Smaller Lots
Gold often spikes and hunts tight stop losses.
Use slightly wider stops, but reduce lot size to balance the risk.
This gives your trade room to breathe without increasing overall risk.
3. Never Trade News Without a Plan
During events like NFP, CPI, or Fed speeches, XAU/USD becomes extremely volatile.
If you’re not experienced, it’s better to stay out.
If you do trade, cut position size and expect slippage.
4. Daily Loss Limit
Decide in advance how much you can lose in one day (for example, 3% of account).
If that limit is hit, stop trading for the day.
This prevents emotional revenge trading, which is the biggest killer in gold trading.
5. Use Partial Profits
Gold reverses quickly, so book partial profits when the trade moves in your favor.
This locks in gains and reduces pressure.
Move stop loss to break-even once part profits are secured.
Rahul’s Tip:
Your job as a trader is not to catch every move, but to stay in the game .
Risk management may feel boring, but it’s the only reason why professional traders survive while retail traders blow up.
Conclusion:
In XAU/USD trading, strategy decides entries, but risk management decides survival.
By controlling lot size, stops, and emotions, you can make gold work for you instead of against you.
If this post helped you see risk management in a new light, like it, drop your thoughts in comments, and follow for more trading wisdom!
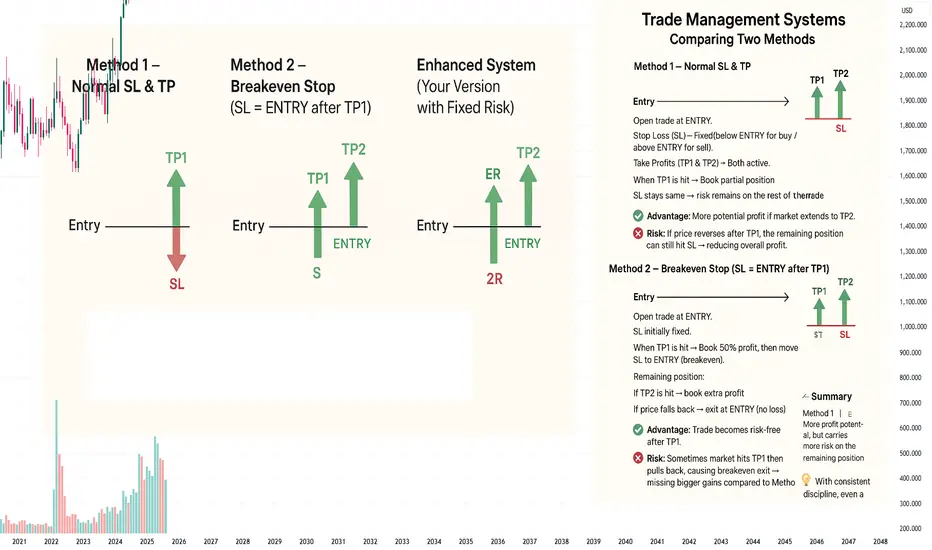
Trade Management Systems: Comparing Two Methods
📌 Method 1 – Normal SL & TP
Entry → Open trade at ENTRY.
Stop Loss (SL) → Fixed (below ENTRY for buy / above ENTRY for sell).
Take Profits (TP1 & TP2) → Both active.
When TP1 is hit → Book partial position.
SL stays the same → risk remains on the rest of the trade.
✅ Advantage:
More potential profit if market extends to TP2.
❌ Risk:
If price reverses after TP1, the remaining position can still hit SL → reducing overall profit.
📌 Method 2 – Breakeven Stop (SL = ENTRY after TP1)
Entry → Open trade at ENTRY.
SL initially fixed.
When TP1 is hit → Book 50% profit, then move SL to ENTRY (breakeven).
Remaining position:
If TP2 is hit → book extra profit.
If price falls back → exit at ENTRY (no loss).
✅ Advantage:
Trade becomes risk-free after TP1.
❌ Risk:
Sometimes market hits TP1 then pulls back, causing breakeven exit → missing bigger gains compared to Method 1.
📌 Enhanced System (Your Version with Fixed Risk)
Initial SL → Always set at 2R.
TP1 → When reached, book 50% profit (+1R on half).
Then move SL to ENTRY (breakeven) for the remaining 50%.
📊 Possible Outcomes:
Scenario Result
Price hits SL (before TP1) –2R loss
Price hits TP1, then reverses to ENTRY +0.5R profit
Price hits TP1, then TP2 +2R total profit
⚖️ Summary
Method 1 (Normal SL & TP) → More profit potential, but carries more risk on the remaining position.
Method 2 (SL = ENTRY after TP1) → Safer, risk-free after TP1, but sometimes cuts off bigger gains.
Your Enhanced Version → A defensive system:
Losers are limited (–2R).
Small winners (+0.5R) happen often.
Big winners (+2R) balance out losses.
💡 With consistent discipline, even a 40–45% win rate can make this system profitable.
Stay Ahead: Essential Tips to Avoid Trading PitfallsHello TradingView Community!
I'm excited to share some valuable insights on trading pitfalls and how to navigate them effectively. Trading in financial markets can be a challenging journey, but understanding common pitfalls and methods to avoid them can significantly enhance your success. Here are 10 pitfalls traders often encounter and actionable strategies to help you steer clear of them:
Having No Trading Plan:
Entering trades without a plan can lead to impulsive decisions. Develop a clear trading plan outlining your goals, strategies, entry and exit points, and risk management.
Using Strategies That Don't Match Your Personality:
Align your trading strategies with your personality, risk tolerance, and lifestyle. A good match helps you stay consistent and focused.
Having Unrealistic Expectations:
Set realistic goals based on your initial capital and risk tolerance. Trading is not a quick path to wealth, so be patient and persistent.
Taking Too Much Risk:
Avoid over-leveraging and using excessive position sizes. Implement risk management techniques like stop-loss orders and diversification.
Not Having Rules to Follow:
Create a set of trading rules to guide your decisions. These rules provide structure and help you stay disciplined.
Not Being Flexible to Market Conditions:
Adaptability is key in trading. Monitor the markets and adjust your strategies as conditions change.
Failing to Take Responsibility for Your Results:
Own your successes and mistakes. This mindset empowers you to learn, grow, and improve your trading.
Being Addicted to Volatility:
While volatility can be exciting, avoid chasing it for thrills. Focus on making well-reasoned decisions based on your plan.
Not Having a Process to Keep Track of Your Performance:
Maintain detailed records of your trades and their outcomes. Analyze this data to identify patterns and refine your strategies.
Not Dealing with Your Emotional Risk:
Emotions can cloud your judgment in trading. Practice emotional intelligence and techniques like meditation or journaling to stay composed.
Neglecting Proper Research and Due Diligence:
Relying solely on tips or rumors can lead to poor decisions. Conduct thorough research and due diligence on potential trades and investments.
Overcomplicating Your Trading Strategy:
Complex strategies may not always lead to better results. Simplify your approach to focus on proven methods and avoid overanalyzing the market.
Ignoring the Importance of Continuous Learning:
The markets evolve, and so should your knowledge and strategies. Stay updated on market trends and continuously educate yourself to stay ahead.
There is no trade without a stop-loss:
This point emphasizes the importance of having a stop-loss in place before entering any trade. It highlights risk management as a fundamental part of trading, ensuring that you have a clear exit strategy to limit potential losses.
If you have to re-analyze charts after being in a trade, you might be going in the wrong direction:
This point underscores the importance of trusting your initial analysis and trading plan. It warns against second-guessing or changing your plan mid-trade, which could indicate you may be heading in the wrong direction.
By implementing these strategies, you can enhance your trading experience and improve your performance over time. Remember, successful trading is a journey that requires discipline, patience, and continuous learning.
I hope you find these insights helpful. Feel free to share your thoughts and experiences in the comments. Let's continue to support each other and grow as a community!
Happy trading!
RK💕
I am not Sebi registered analyst.
My studies are for educational purpose only.
Please Consult your financial advisor before trading or investing.
I am not responsible for any kinds of your profits and your losses.
Most investors treat trading as a hobby because they have a full-time job doing something else.
However, If you treat trading like a business, it will pay you like a business.
If you treat like a hobby, hobbies don't pay, they cost you...!
Disclaimer and Risk Warning.
The analysis and discussion provided on in.tradingview.com/u/RK_Charts/ is intended for educational purposes only and should not be relied upon for trading decisions. RK_Charts is not an investment adviser and the information provided here should not be taken as professional investment advice. Before buying or selling any investments, securities, or precious metals, it is recommended that you conduct your own due diligence. RK_Charts does not share in your profits and will not take responsibility for any losses you may incur. So Please Consult your financial advisor before trading or investing.

Determining trend and consolidation through wave cycles.MCX:GOLD1!
In past, we have discussed how to know the quality of a trend and how to know a chart pattern's extrinsic nature according to the market phase.
If you haven't read that then I want you to read that before to have a better understanding of this idea.
Let's get started!!
How to determine the trend or consolidation through the wave cycles and degrees.
The trend moves in 3 different wave degrees:- For example , think of it like a multi-timeframe analysis.
1. Higher wave cycle (HWC) - This is a 1-month time frame trend.
2. Medium wave cycle (MWC) - This is a 1-day time frame trend.
3. Lower wave cycle (LWC) - This is 30 min time frame trend.
So Without knowing which wave cycle is being traded one can encounter these problems:-
1. Inability to select consistent breakout levels.
2. Inability to select effective stop loss levels.
3. Inability to apply effective stop sizing.
4. Inability to distinguish between trend and consolidation mode.
5. Inability to determine the direction of the predominant trend.
How can we eliminate these complications?
1. Consolidation and Trend Action in Terms of Wave Cycles and Degrees.
A market may be both in trend and consolidation modes at the same time, depending on the wave cycle being observed.
2. We may also define breakouts via the degree of the wave cycles.
Different degrees of waves help in determining whether a breakout will gonna be valid or not as a range formation near the higher wave cycle resistance zone will likely fail.
In the above figure:-
we have breakouts based on waves of lower, medium, and higher degrees. In other words, the breakout level will depend on the wave degree being traded. Being aware of the wave degree being traded will allow the trader to size the stop-loss effectively, according to the average wave amplitude and volatility associated with that particular wave degree.
3. Significance of higher wave degree reversals
When big market trends change direction, it affects smaller trends as well. This is because all the smaller trends are part of the bigger trend. So, when the big trend changes, the smaller trends also change in the same direction. This is important to understand because it means that when you see a change in a big trend, it's a sign that many smaller trends are also changing. However, smaller trends changing doesn't necessarily mean the big trend will change too.
Conclusion:- Always know which wave cycle you are trading and at what point you stand in that wave cycle.
Note: In upcoming Ideas, we will cover how Waves are used in the Elliott Wave concept.
I hope this short idea on trend or consolidation determination has added some knowledge and helped in improving your trading.
please like and comment with your views on this idea.
Keep learning,
Happy trading.
Thank you for reading.

Right direction is more important than speedHello Friends,
Hope you are doing well,
Today I am sharing a very little and simple fact, which is very much needed to survive long life in market and to be a profitable trader in market,
here we are talking about direction and speed because, when you’re heading towards right direction, every single step you take is real progress, but if you’re going in the wrong direction, every single step is pushing us in minus.
Direction can be decided by analyzing charts and Speed (position sizing) is decided as per money management rules,
One should always digest the initial level first, where he is, and also where he reaches next, one can only survive in market until capital is wiped out, so always remember, to save capital from losses is also gain.
The journey of a thousand miles begins with one single step, make sure that first step is in the right direction.
When making important decisions that have long-term implications like financial decisions, slow down and check carefully risk reward ratios and money management rules and carefully evaluate your available options before starting or executing it.
This post is just for educational purpose,
See you all next week. 🙂
RK 💕
Most investors treat trading as a hobby because they have a full-time job doing something else.
However, If you treat trading like a business, it will pay you like a business.
If you treat like a hobby, hobbies don't pay, they cost you...!
Disclaimer.
I am not sebi registered analyst.
My studies are for educational purpose only.
Please Consult your financial advisor before trading or investing.
I am not responsible for any kinds of your profits and your losses.

RISING TREND - EXPLAINED
Education
Rising trend line:
Rising trend line is the type of trend line which helps a trader to identify the bullish moment or bullish range (Upward Trend).
The rising trend line or ascending trend line should be connected from the last lower of the asset value to the last highest value or price of an asset.
The rising trend line should have multiple prices touched to be considered as valid, (at least 2 price point touches).
Traders may anticipate trading pullback where confirmation come, they can use additional indicators to have clear understanding of right entry point and exit points.

RELIABLE CANDLESTICK PATTERNPattern Name: Bullish Engulfing
Pattern Type: Bullish Reversal
No. of Candles: 02
How to Identify it?
1)There must be a preceding Downtrend.
2)A short Red candle followed by a long green candle.
3)The Green candle should open lower & closes higher than the Red candle.
4) The Green candle should completely engulf the Red candle.
The psychology behind it :
1)The Bears lose momentum & the Bulls take charge and manage to close above the red candle.
2)It implies the bulls have fully overridden the bears.
How to trade it?
1)Look for the Bullish Engulfing at the bottom of the Downtrend.
2)Upon confirmation, open a Long position in the 3rd Candle.
3)Place a Stoploss below the low of the Green candle.

Gold's Golden Rule Of 89% (Pack Your Bags For Big Ride)Gold's Golden Rule Of 89%
Golden history of last 50 years have shown that Gold has give big move whenever there is a minimum 89% move from bottom. Chart is self explanatory. There are three successful incident of min 89% move and two unsuccessful incident of less than 89% move.
Successful Incidents
1. 1970 - 1972
2. 1976 - 1978
3. 1999 - 2005
Unsuccessful Incidents
1. 1982 - 1983
2. 1985 - 1987
Fourth move in the making from 2015 - till date. So Gold is getting ready to fly again.
Disclaimer: This is for demonstration and educational purpose only. This is not buying or selling recommendations. I am not SEBI registered. Please consult your financial advisor before taking any trade.

Best Trade setup for Forex pairs tradingStrategy to execute trades in forex market, works for all pairs (please do back testing to gain confidence) :
What we need :
Candle Sticks
Timeframe – 1 hr
Bollinger Band – Length 20 and StdDev 2.5
Bollinger Band – Length 20 and StdDev 2
RSI – Length 6
Stochastic Oscillators – 14,3,3
MACD – 8,21,5
Confirmation with indicators should be in same trend with candle stick trend
1. RSI (For trend identification)
2. Stoch (Entry and Exit confirmations / Overbought and Oversold confirmations)
3. MACD (For trend identification with convergence/divergence)
Risk Reward Ratio : 1:3 and above or as per your risk appetite
Rules of the game :
Whenever candle stick crosses Std Dev 2 and touches/crosses Std Dev 2.5 above/below then we have to find the entry. Any candle after this should be used as entry point which reverses the previous candle trend. At the same time RSI, Stoch and MACD should also reverse from their respective over sold or over bought positions. Stoch will give first hint of reversal followed by RSI and MACD. If RSI is at 20 or 80 (extremes) then it’s a perfect setup and find the reversal trend along with Candle sticks for entry. If RSI is not at extremes but at 30/40 and 60/70 levels then the setup can work but may not be so accurate, this gives scope for less RR. Stop loss should be the candle stick (candle stick which crossed) high or low (sell/buy respectively) or below the Std dev 2.5 band which ever are nearer or as per your risk appetite.
Take profit : First target will be middle band, Second target will be other end once candle sticks touches Std 2 or take profit @ 1:3 or when Stoch blue line touches red line and reverses or when MACD blue line touches red line and reverses or as per the risk appetite.
Avoid when :
>Confluence of candlesticks trend with RSI/Stoch/MACD is missing (all should be in following same trend path)
>RSI is in between 40 to 60 range
>If Candle stick do not touch Std dev 2.5 band and reverses
>If entry candle sticks are near to the middle line of the Bollinger band as room for uptrend is less
>If you do not understand the strategy
>If you do not understand how candle sticks are behaving
>If candle stick pattern is not respecting high and low lines marked as mentioned above
>If there is no confluence of the setup with indicators
>When calculated SL is way high due to the formed candle stick (large or big candle stick, if taking entry after this candle)
>When there is no confidence on the setup
>Fear of Missing Out
>In a sideways market, hitting of SL will be high
Story behind this setup : Trend will be in between Bollinger band upper and lower bands and entry is sought whenever trend reverses after touching Stddev 2.5 upper or lower band. As per Empirical Rule 95% of Data will fall within 2 Standard Deviation 99% of Data will fall within 2.5 Standard Deviation, reversal happens after this and we try to take confluence with other indicators help for entry and exit. Sometimes an exit can also trigger entry for next trade if the setup gives confluence with mentioned parameters above.
Stop Loss : Stop loss is the key here, please do not enter unless you understand how to calculate stop loss. Calculate Stop loss first before entry and it should be below Std dev 2.5 or just below the previous candle of the entry candle whichever is acceptable loss or as per your risk appetite.
Please do let me know if you have any questions would be happy to respond.
Please do like and share this idea. Thanks
Disclaimer : This analysis/strategy is only for educational purpose and not be considered as any trading idea/tip. Please consult your financial advisor before you take any trade and we are no way responsible for your profits/losses. Thank you!

XAUUSD Gold Target Achieved 💰The analysis i posted 2 days ago have been correct! The target was received few hours ago.
Follow for more!
ALL THE BEST!


IMPULSE + CORRECTION in Gold - "Learn More Earn More" With USThe market makes an impulse then makes a correction before making the impulse again.


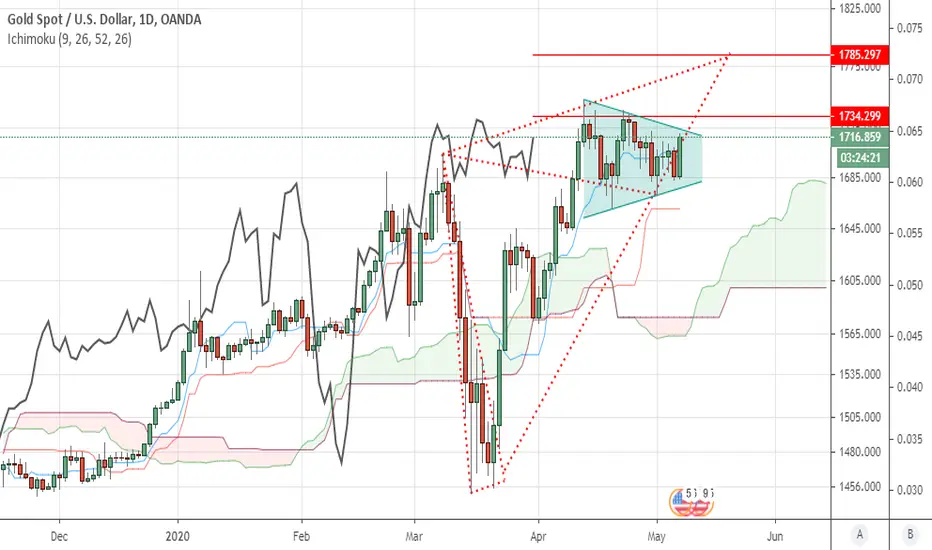
GOLDGOLD if it manages a MONTHLY "close above $1825" (all time high) it will activate probable targets of $1975 & $2075


GOLDIt has been trading within a triangle ever since it activated a Bearish Alt Bat. Above $1735 the triangle breakout suggest $1785 which is the 2nd target of a Bullish Dragon. As per Ichimoku study, the momentum for upside has a decent probability to start tomorrow. It should be noted that triangle breakouts tend to be the last of a trend, this could turn out to be an unwinding one.