Part 1 Candle Stick Patterns Understanding What Option Trading Profits Mean
Option trading profits refer to the financial gains a trader earns by buying or selling options contracts.
These profits arise from correctly predicting price movement in the market.
Options are leveraged instruments, so small price moves can generate large returns.
Profit is calculated based on premium difference, time decay, volatility changes, and strike-to-spot movement.
Supportandresitance

Part 2 How to Draw Accurate Support and Resistance LevelsParticipants in Option Trading
There are four primary participants in the options market:
Buyer of Call Option (Long Call) – Expects the price to rise.
Seller of Call Option (Short Call) – Expects the price to fall or remain flat.
Buyer of Put Option (Long Put) – Expects the price to fall.
Seller of Put Option (Short Put) – Expects the price to rise or remain flat.
Each participant has a specific risk-reward profile. Option buyers have limited risk (the premium paid) and unlimited profit potential. Option sellers, on the other hand, have limited profit (premium received) but potentially unlimited risk.

Part 1 How to Draw Accurate Support and Resistance LevelsThe Key Components of an Option Contract
Underlying Asset:
The financial instrument (e.g., stock or index) on which the option is based.
Strike Price:
The price at which the holder of the option can buy (for calls) or sell (for puts) the underlying asset.
Expiry Date:
The date on which the option contract expires. In India, options can be weekly or monthly.
Premium:
The price the buyer pays to purchase the option contract from the seller (also known as the writer). This premium is non-refundable.
Lot Size:
Each option contract represents a fixed quantity of the underlying. For example, one NIFTY option lot equals 50 units, while one BANK NIFTY option equals 15 units.

Fair Value Gap (FVG) — Support and Resistance (S/R)🔎 Overview
The Fair Value Gap (FVG) is a unique price imbalance or inefficiency on a price chart where the market rapidly moves, leaving one or more candles without overlapping wicks between highs and lows.
This signifies aggressive buying or selling, resulting in a “gap” of untraded prices.
Once spotted, FVGs often act as magnets, drawing price back to fill the gap — and later serve as dynamic support or resistance zones, depending on the market direction.
⸻⸻⸻⸻⸻⸻⸻⸻⸻⸻
📔 Concept
A Fair Value Gap forms when:
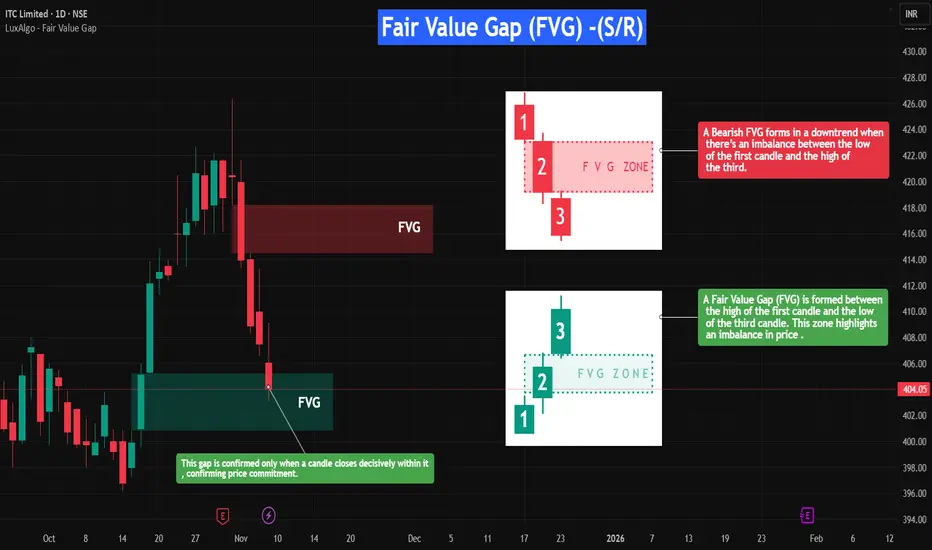
1️⃣ Resistance FVG -- A strong impulsive move causes the low of the first candle and the high of the third candle (in a three-candle sequence) to fail to overlap, leaving a visible gap.
2️⃣ Support FVG -- A strong impulsive move causes the high of the first candle and the low of the third candle (in a three-candle sequence) to fail to overlap, leaving a visible gap.
3️⃣ Imbalance -- This gap highlights an area where orders were skipped, signaling an imbalance between buyers and sellers.
4️⃣ Rebalance -- When revisited, a Bullish FVG often acts as support, while a Bearish FVG acts as resistance, as price reacts to rebalance the inefficiency before the trend continues.
⸻⸻⸻⸻⸻⸻⸻⸻⸻⸻
📌 How to Use
✅ Validation → A valid FVG exists as long as the gap remains unfilled, and traders watch for price to revisit and react to it.
🟩 Bullish FVG → Support: When price retraces into the gap and finds buying interest, the zone holds as support.
🔴 Bearish FVG → Resistance: When price rallies into a bearish gap and faces rejection, the zone holds as resistance.
❌ Devalidation → If price decisively closes inside the FVG, the gap is considered “filled,” and the setup loses significance.
Typically, the lowest unfilled bullish FVG below price in an uptrend (and the highest bearish FVG above in a downtrend) carries more weight and is prioritized for confluence.
⸻⸻⸻⸻⸻⸻⸻⸻⸻⸻
📊 Chart Explanation
Symbol → NSE:ITC
Timeframe → 1D
On the right-hand side, the Fair Value Gaps (FVGs) are illustrated in detail to give a closer look at how they form and function.
These visual examples explain how FVGs represent price inefficiencies — zones that later act as dynamic support or resistance once price revisits them.
On the left-hand side, you can see real-time examples of FVGs forming within live price action.
When a candle closes decisively inside a bullish FVG, it confirms price commitment, allowing the zone to act as support and potentially propel price upward.(These are plotted using open sourced indicator )
This setup beautifully demonstrates how understanding FVG structure helps identify high-probability reaction zones where the market seeks to rebalance itself.
⸻⸻⸻⸻⸻⸻⸻⸻⸻⸻
👀 Observation
Fair Value Gaps work best in volatile markets or during strong impulsive moves.
When price revisits an unfilled gap, the reaction helps define new support or resistance.
Combining FVGs with key structural levels, volume analysis, or momentum indicators (like RSI or Moving Averages) improves reliability.
Always prioritize clean, unfilled gaps aligned with the trend direction for higher conviction.
⸻⸻⸻⸻⸻⸻⸻⸻⸻⸻
💡 Conclusion
The Fair Value Gap not only signals where the market may “rebalance” itself after price inefficiencies but also identifies potential support and resistance zones.
Recognizing how bullish and bearish FVGs interact with price allows traders to anticipate reactions, manage risk, and refine entries and targets with greater accuracy.
⸻⸻⸻⸻⸻⸻⸻⸻⸻⸻
⚠️ Disclaimer
📘 For educational purposes only.
🙅 Not SEBI registered.
❌ Not a buy/sell recommendation.
🧠 Purely a learning resource.
📊 Not Financial Advice.
Advanced Price Action Trading "Welcome to SkyTradingZone "
Hello Everyone 👋
Just Watch Full Video Everything about Trend or Price Action We Discuss in this Video..

The Ultimate Beginners Guide to Day TradingHello everyone My name is d3ffyduck
I am today gonna post some cool and new tips For the beginners in Daytrading.
I am gonna divide things in Chapters so you'll learn it with ease
Read it till the end Hope You learn something
Chapter-1 Timeframe selection
The choice of the best timeframe for chart analysis in day trading can vary depending on a trader's strategy, preferences, and the market being traded. Different timeframes offer varying levels of detail and may suit different trading styles.For Example
1-Minute Chart: This timeframe provides very detailed information, showing price movements within one-minute intervals. I prefer Using it for precise entry and exit points In day trading
5-Minute Chart: Slightly less detailed than the 1-minute chart, the 5-minute chart still offers relatively short-term insights into price movements. I use to determine my momentum for the trade i want to hold for like 1-2hrs only
15-Minute Chart: This timeframe offers a broader view of the market compared to shorter intervals. I prefer it to determine my next day momentum of the market
Chapter-2 Support and resistance Using RSI
I know you all knows the basics for support and resistance but today i will show you the best way. Just open your chart and use RSI Indicator and we are going to mark the overbought areas high candle and oversold area lowest candle using it for different time frames.
Just a note from my side do not mark those areas again if there have already a support or resistance line in different time frame and also you can remove those level of S&R which did not hold well in different time frames
1-day time frame=I have marked the regions where the RSI turned in the overbought or oversold areas. As you can see, I have not marked the support and resistance levels since they were already established from previous market overbought and oversold.
4-hour Time frame=In this timeframe, we will only identify the levels that are above 70 and below 30 in the RSI. We'll skip the R&S that are already marked on the daily timeframe. To reiterate, please refrain from marking those levels again if we can observe that our resistance and support levels have already been established on the daily chart.
1-Hour Time Frame = I've set my preferred timeframe to a maximum of 4 to 5 months. I don't want to go below this timeframe as it will create more noise. Additionally, I'll remove the support and resistance levels that didn't react well for buyers and sellers at this point to make the chart look cleaner
Chapter-3 Determining the Trend
Here in this chapter we are going to use only 2 Things to keep everything simple:-
SMA+EMA 200= We are going to use simple indicator or just create yourself one indicator which plots both sma and ema with same 200 timeperiod.
Rules are simple
if below both ma look for short
if above both ma look for long
You can use it for 1hr and 15 min for day trading purpose
Trendlines- Trendlines are your best friend.They are the building block for your Chart pattern look for trendlines in 15 min tf for day trading purpose
Chapter-4 Significance of market opening closing,high,low
This is one of the important chapter for day traders and i am going to tell you how an opening closing high and low effect the whole day trade.
For Example
1-Open your Chart
2-Mark the opening ,closing highs and lows for previous 3-4 days
3-Those area are going to be area of interest
Tip for the beginners. Do not take any trades for the first hour From the opening of the day For example if your market opens in 9:15 am dont take trades until 10:00-10:15 cause of high volatilty
Another Tip for the beginners.If you prefer to take 2 trades a day close your previous 10:00 am trade At around 11:45am -12:15 pm and start looking for another one after that. the reason because i have seen this is the time for the most probable reversal or continuation of trend for the next leg of the day
Chapter-5 Significance of Gaps in the market
Gaps are one of the best way to decide what will be the market trend for the rest of the day
There are two type of gaps in the market 1-Gap up 2- Gap down
Tip for the beginners Only trade in the strong gap up or down and as i said before do not trade in the first hour of the opening
Ill show you some scenarios of gap Trading with respect to opening of the day
Scenario 1st strong gap up+ Stayed above above the gap and opening for the 1 hour(9 am-10am)
We can see we had a strong opening stayed above the gap up and open for atleast 1 hour so after this the trend is decided
Tip for the beginners Always follow strict Risk and Reward ratio like i use 1:1.5
Scenario 2nd strong gap up+ stayed below the gap and opening for the 1 hour(9 am-10am)
We can see we had a strong gap up and opening but price stayed below the opening for 1 hour so we took the short as dropped below previous closing/high
Similarly we can use this for gap down scenarios
Final tip from my side are:-
Do meditation for 15 min before trading hours
Always use stoploss
Use your preferred Risk Reward ratio like 1:1.5
Do not trade in opening Hour
Gaps are like your friend
Trends are like a path to success
Do not overtrade
Dont only rely on indicators there isnt any indicator which can make you rich
Use only basic indicators such as Ema,Macd,Rsi and ATR
PLEASE UPVOTE AND FOLLOW FOR MORE EDUCATIONAL CHARTS AND STRATEGIES

Support and Resistance- Flipping Roles⚡In simple terms, support is a level where demand overcomes supply, while resistance is a level where supply overcomes demand. In the market, different types of traders participate, and I have broadly categorized them into four groups based on their behavior.
⚡You may have heard that once a support level is broken, it tends to act as a resistance level, and vice versa. This phenomenon occurs because the roles of support and resistance flip, influenced by the psychology of traders at these levels.
⚡Let's illustrate this with an example. Consider Group A, a set of buyers who bought a stock at 80. The stock price rises to 100 but faces some resistance. At this point, Group B, consisting of short sellers, enters the market and starts selling the stock near 100, with their stop-loss orders placed just above 100. Thus there is supply present at this level.
⚡The price consolidates within a narrow range and eventually breaks out above 100. Group A is delighted as they bought at a good price, but Group B becomes unhappy. Some members of Group B exit the trade as their stop-loss orders get triggered, while others continue to hold in hope of a favorable outcome.
⚡Now, another group of traders, Group C, known as breakout traders, becomes active above 100. Their buy orders, combined with the buy-stop orders from Group B, add momentum to the upward movement, pushing the price up to 110.
⚡As the buying pressure eases, and short-term traders take profits, the market starts to pull back, eventually reaching the old resistance area around 100.
⚡Many pullback traders look for buying opportunities near this level. Additionally, members of Group B, who shorted at 100, realize their mistake and start buying to close their short positions at breakeven. Some of them also reverse their positions. Other buyers who were waiting on the sidelines also start entering the market. All these buy orders create a strong demand.
⚡Notice that once there was significant supply at 100 and now there is significant demand. If this demand is substantial enough, the price resumes its upward movement, illustrating how changes in market sentiment impact a participant's psychology and consequently affect the nature of support and resistance levels.
⚡The reverse is true for how a support level, once broken down, turns into a resistance level.
⚡I hope you found this tutorial helpful. Please stay tuned for more educational content in the future. Feel free to show your support by liking this post.
Disclaimer: Practical knowledge

lets understand support and resistance in detail support and resistance they play a truly crucial role in trading
If you want to trade like a pro, there's something you should know:
Support and resistance, they're the stars of the show!
this can be understood from the below:-
Support is like a floor, it holds prices up high,
Resistance is a ceiling, prices can't seem to fly.
When prices hit support, they tend to bounce back,
And when they reach resistance, they often lose track.
These levels are key, they're a trader's best friend,
They help you to enter, exit, and defend.
So pay attention to support and resistance, my friend,
They'll help you make profits and trade till the end!
volume confirmation along with breakouts are beautiful

Studing Consolidation Phase This is hourly timeframe.
This is how I analyze the consolidation only technically.
From fibo. recent top to bottom, Nifty is taking resistance 0.38 fibonacci level.
Let's pointout the short trend and understand each.
1] Nifty started consolidating 6th May 2022.
It started falling, gone sideways for sometime and gave bounce back.
2] And it tested the 16400 zone. As it was a straight one side move, it was obvious it will give a retracement.
3] But it was again a one side move, this time downward, and tested the recent bottom.
Here, we witnessed a sharp upmove from bottom to top and again to bottom.
4] Again from 20th May, a sharp upmove towards resistance.
5] Tested and fallback this week.
6] Bounce backed again and now near resistance zone.
In all of these short term trends, we can see thick bullish and bearish candles in phase 1 and 5.
Though bulls failed in these phase.
Almost each phase has 1) bullish and bearish belt hold
2) bullish and bearish marubozu
Except phase 2,6 no bearish candlestick of this type.
These opposite candlestick patterns occurance multiple times tells us that market is now choppy, highly volatile.
Outcome of analysis:
In current market situation, bulls and bear are almost equally powerful.
Choopy moves indicates the aggression and dominating will.
This how I analyze a consolidation.
Breaks it down in trend zones and study each, and keep in back of the mind each one's outcome,
and try to anticipate, every possibility. And how much is the chance of taking it place by looking at
bull and bears behaviour.
Note : This is my own analysis and is for information purpose only.
