When Gold ETFs Crash, Psychology Crashes Faster Than Price!Hello Traders!
When Gold ETFs start falling sharply, the damage doesn’t begin on the chart. It begins in the mind. Prices may drop in percentages, but psychology collapses much faster. Confidence disappears, patience breaks, and long-term thinking gets replaced by fear-driven decisions.
Right now, we are in one of those phases. Headlines are loud. Charts look heavy. And emotions are running far ahead of logic. This is where most investors don’t lose money because Gold failed, they lose because their mindset did.
Why Gold ETF Falls Feel More Painful Than Spot Moves
ETF investors experience drawdowns differently. Unlike intraday traders, they are mentally invested for the long term. When price drops suddenly, it shakes belief, not just positions.
Long-term conviction starts feeling shaky
Every red candle feels like a warning sign
Investors start questioning decisions made months or years ago
The fall itself may be normal.
The emotional reaction is usually not.
What Panic Really Looks Like in Gold ETFs
Panic rarely shows up as one big decision. It shows up in small mental cracks.
Checking prices more frequently than usual
Reading every negative headline as confirmation
Comparing current drawdowns with worst-case scenarios
This is how psychology collapses quietly, long before price finds stability.
Why Markets Create This Psychological Pressure
Sharp corrections are not just price adjustments. They are tests of belief. Markets use volatility to separate conviction from convenience.
Weak conviction exits during uncertainty
Strong conviction pauses and reassesses
Impatient money provides liquidity for stability
Gold doesn’t need everyone to believe at the same time.
It needs disagreement to function.
What Smart Investors Focus On During This Phase
Experienced investors don’t react immediately. They zoom out and slow down decision-making.
They separate short-term noise from long-term intent
They revisit why Gold was added to the portfolio
They avoid making decisions during emotional peaks
This phase is not about predicting the bottom.
It’s about protecting mindset.
How I Personally Handle These Phases
When Gold ETFs correct sharply, I don’t rush to act. I observe behaviour, both market behaviour and my own.
I reduce information intake instead of increasing it
I avoid reacting to one-day or one-week moves
I remind myself that volatility is part of long-term assets
Markets recover before confidence does.
And that gap is where mistakes usually happen.
Rahul’s Tip
If a Gold ETF fall is disturbing your peace more than your portfolio balance, step back. Good investments don’t require constant emotional attention. If fear is forcing urgency, the decision is probably premature.
Final Thought
When Gold ETFs crash, price moves fast.
Psychology moves faster.
Those who survive this phase are not the ones who predict perfectly, but the ones who stay emotionally stable while others panic.
If this post reflects what you’re feeling right now, drop a like or share your thoughts in the comments.
More real, market-relevant lessons coming.
Volatility

Why Good Setups Fail: The CAP NOTES That Block Bad Trades (ECI)ECI Panel (Execution Confidence Index)
Why this panel exists: execution governance, not prediction
Most traders don’t lose because they “didn’t know direction.”
They lose because they entered during low-quality execution conditions: mixed timeframes, thin liquidity, unstable volatility, or a setup that exists only on one chart layer.
The ECI Panel is built to solve that exact problem.
It is not a signal. It is a permission layer:
It compresses multiple execution risks into one readable state.
It stops “impulse entries” when the environment is structurally unstable.
It forces a trader to execute only when the market allows clean follow-through.
What ECI is measuring (in practical terms)
ECI is not “confidence” as emotion.
ECI is confidence as market permission.
It answers one question:
“If I execute right now, what is the probability that the market structure can carry the trade without forcing me into damage-control?”
The panel typically outputs:
ECI SCORE (Quality / Permission level)
RISK MOD (Risk modifier status)
CAP NOTES (Execution caps / constraints that limit trade validity)
CAP NOTES: the most important part of the panel
A trader can see a perfect entry candle and still be wrong — not because the setup is bad, but because the execution environment is capped.
CAP NOTES are non-negotiable constraints.
They don’t say “buy/sell.”
They say:
“Even if your setup is valid, the market is currently limiting execution performance.”
Think of it like this:
Setup = your idea
CAP NOTES = the market’s permission boundaries
ECI = the final execution gate
If CAP NOTES are active, ECI is telling you:
“Reduce size, delay entry, require stronger confirmation, or do not trade.”
Example from the panel shown
Your panel shows:
ECI SCORE: 38 (No-Trade)
RISK MOD: OFF
CAP NOTES: MTF CONFLICT | LOW LIQ
This is a textbook “execution-capped” environment.
Let’s break those CAP NOTES down.
1) MTF CONFLICT (Multi-Timeframe Conflict)
What it means
MTF Conflict is when higher timeframe intent is not aligned with the execution timeframe trigger.
Common real-market situations:
HTF is in distribution / reversal zone, while LTF shows a continuation entry.
HTF is bearish structure, LTF prints bullish breakout (often a trap / mitigation move).
HTF premium/discount context contradicts LTF entry direction.
HTF liquidity is targeted in the opposite direction of your LTF plan.
Why it kills execution quality
When timeframes conflict, price tends to behave like this:
sharp spikes
fake breakouts
stop hunts
whipsaw around levels
follow-through failure
Even if you “win,” the trade becomes messy:
large drawdown before moving
hard stop placement
emotional management load increases
How to execute when MTF CONFLICT is present
MTF conflict doesn’t always mean “never trade.”
It means you must upgrade requirements.
Execution rules (professional gating):
Trade only in the direction of HTF bias, unless you have an explicit reversal model.
If you take a counter-trend scalp:
smaller size
faster TP
tighter invalidation
no “hope holding”
Demand clear confirmation before entry:
displacement + structure break in your direction
clean retest / mitigation
liquidity sweep + reclaim
If HTF is near key zones (range extremes / major OB / major liquidity):
treat every LTF breakout as suspect until confirmed
In short:
MTF conflict converts “normal trading” into “advanced trading.”
If you don’t upgrade your confirmation, you’re just paying the market tuition.
2) LOW LIQ (Low Liquidity Condition)
What it means
Low Liquidity is not “market is quiet.”
It means the order book environment is not supporting clean execution.
This happens typically:
outside active sessions
between session transitions
during pre-news hesitation
after major impulses when market pauses
during thin participation windows
Why it damages execution
Low liquidity causes:
slippage and poor fills
random wicks
“one-candle stop-outs”
spreads widening
price jumping levels without trading through them
In low liquidity, levels don’t behave “technically.”
They behave mechanically: gaps, thin prints, abrupt sweeps.
How to trade when LOW LIQ is present
You have two choices:
Option A: Don’t trade.
This is the professional choice for consistency.
Option B: Trade with liquidity-adjusted execution rules
Use confirmation entry (no blind limit entries)
Require stronger structure break
Reduce leverage / size
Use wider invalidation or smaller position — never both high-risk
Take partial profits faster
Avoid holding through “dead zones”
Simple truth:
Low liquidity turns good setups into low R:R outcomes because execution friction increases.
Why CAP NOTES matter more than indicators
Indicators are usually about “what price did.”
CAP NOTES are about “what price can realistically do next without breaking your execution.”
This is the real difference:
A setup can be valid on chart.
But CAP NOTES can still make it untradeable in live execution.
CAP NOTES protect you from:
trading inside chop disguised as signals
taking entries during unstable participation
forcing trades when market structure is not ready
How ECI + CAP NOTES should control your decision
Use a 3-state execution system:
State 1: NO-TRADE (ECI low + CAP NOTES active)
Observe only
Build context
Wait for caps to clear
Do not “revenge trade” the chop
State 2: CAUTION TRADE (ECI mid + 1 CAP NOTE active)
Reduce size
Require better confirmation
Tight rules on invalidation
Faster profit-taking
State 3: PERMISSION TRADE (ECI high + caps clear)
Standard sizing
Standard invalidation
Allow trade to breathe
Higher expectancy follow-through
In your screenshot, ECI 38 (No-Trade) with MTF Conflict + Low Liq is clearly State 1.
That is not weakness.
That is discipline automation.
The real value: ECI makes you consistent under pressure
Traders fail most during:
after a big move
after a loss
when they “feel they missed it”
when market becomes noisy
ECI + CAP NOTES solve that by removing emotional override.
They don’t “predict.”
They enforce execution quality.
That is how consistency is built.
CAP NOTES Dictionary (ECI Panel)
What “CAPS” mean in MARAL execution language
CAP NOTES = Execution Constraints
They are not opinions. They are environmental limitations that reduce trade expectancy even when a setup looks good.
Rule:
1 CAP active → reduce risk / require stronger confirmation
2+ CAPS active → no-trade unless you are executing a specialized model (advanced)
CAPS cleared → normal execution permission
CAP 01 — MTF CONFLICT
Meaning: Higher-timeframe bias is opposing the current execution direction (HTF flow disagrees with dir).
Risk: Follow-through becomes inconsistent; traps/stop-runs increase; LTF triggers fail more often.
Best action: Stand down until HTF context stops opposing (prefer MTF ALIGNED/MIXED).
Upgrade rule: If executing anyway, reduce size and require displacement + acceptance/retest before entry.
CAP 02 — VOL REGIME
Meaning: Volatility is outside your tradable operating band (ATR% not within your min/max bounds).
Risk: ATR-based SL/TP loses reliability; price either stalls (too low vol) or whipsaws (too high vol).
Best action: Avoid normal execution until volatility normalizes into the band.
Upgrade rule: If forced to trade, reduce leverage/size and use structure-based invalidation (confirmation-only entries).
CAP 03 — ADX WEAK
Meaning: Trend strength is insufficient (ADX below threshold); market is prone to rotation/chop.
Risk: Continuation expectancy drops; fake breaks increase; holding winners becomes difficult.
Best action: Wait for ADX to recover or trade only the cleanest confirmations.
Upgrade rule: Require displacement + structure follow-through (BOS + acceptance) and reduce risk.
CAP 04 — RSI CHOP
Meaning: Momentum is indecisive (RSI inside the chop band between your bear/bull levels).
Risk: Whipsaw environment; both long/short attempts get punished; signal quality collapses.
Best action: Stand down until RSI exits the chop band and direction is confirmed.
Upgrade rule: Only trade after RSI exits chop + price prints confirmation (displacement and/or structural break).
CAP 05 — STRUCT NEUTRAL
Meaning: No confirmed HH/HL or LL/LH sequence; structure bias is neutral (structBias == 0).
Risk: Invalidation and targets become unclear; entries become location-poor; rotation risk rises.
Best action: Wait for structure to resolve into Bull Struct or Bear Struct.
Upgrade rule: If trading neutral structure, require liquidity interaction + displacement (sweep/reclaim style confirmation).
CAP 06 — LOW LIQ
Meaning: Liquidity context is LOW (no sweep/event and not near PDH/PDL proximity).
Risk: Internal noise dominates; moves lack fuel; breakouts often fail or stall.
Best action: Wait for liquidity context to improve (NEUTRAL near PDH/PDL or HIGH via sweep/event).
Upgrade rule: If executing, reduce size and demand stronger confirmation (displacement + acceptance, no blind entries).
CAP 07 — DIV NEG
Meaning: Divergence is against your current direction (negative risk modifier when Divergence module is ON).
Risk: Continuation becomes fragile; deeper pullbacks; late entries get punished; expectancy compresses.
Best action: Avoid late entries and avoid adding risk into extension.
Upgrade rule: Prefer pullback/mitigation entries only; manage active trades tighter (protect/scale earlier).
Default — NO MAJOR CAPS
Meaning: None of the above caps are currently active (under enabled modules).
Risk: Not a guarantee—only indicates no ECI blockers detected by this build.
Best action: Execute normally while still following your setup/permission/risk rules.
Upgrade rule: Maintain standard confirmations; do not override risk discipline.
CAP NOTES are not “warnings to ignore.” They are execution limits. When a cap is active, the market is telling you: “Your setup may be visible, but your execution edge is capped.” The professional response is not to trade harder — it is to tighten permission.
How to use CAP NOTES correctly:
Treat ECI SCORE as the quality meter, and CAP NOTES as the gatekeeper.
If CAP NOTES increase, your job is to reduce exposure, not increase conviction.
If you feel urgency (“I might miss the move”), that’s usually the moment CAP NOTES are protecting you the most.
MARAL Rule
When conditions are capped, your best trade is often no trade. Consistency is built by the trades you refuse, not the trades you force.
Reminder:
ECI is a decision-support layer. It does not replace risk management, position sizing, or personal accountability. Always execute within your predefined risk limits.
Note : This article is educational and explains a decision-support framework. It is not financial advice, not a promise of performance, and not a buy/sell signal service. Trading involves risk; always apply your own risk management and confirm conditions independently.
#TradingPsychology #RiskManagement #TradingDiscipline #TradingEducation #PriceAction #MarketStructure #Liquidity #SmartMoneyConcepts #MultiTimeFrame #Volatility #ADX #RSI

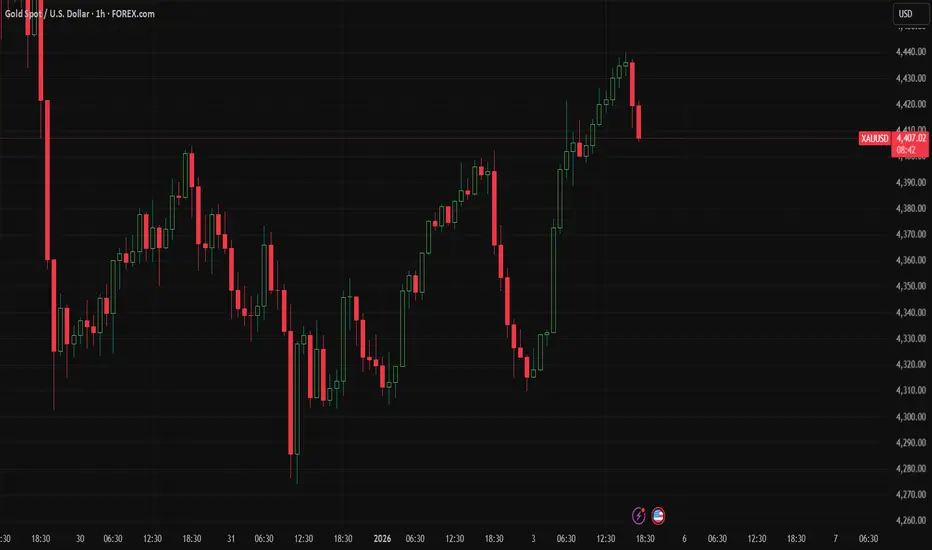
0/0, 1/0, 0/1 Explained: MARAL Liquidity Conditions Liquidity Isn’t an Entry — It’s a Test (XAUUSD Case Study)
This XAUUSD chart is a textbook example of why most traders misunderstand liquidity in live markets.
Price moved strongly higher over multiple sessions, creating a clear bullish structure. Many traders see this and immediately think:
“Trend is up → buy pullbacks.”
That assumption is exactly where execution errors begin.
What This Chart Actually Shows (Objectively)
Strong directional move
Price advanced cleanly from the 4700s into the 5100s.
Momentum expansion is obvious.
Structure remains intact.
Price now stalling near prior highs
The market is no longer impulsive.
Candles compress.
Wicks increase.
Range tightens
This is no longer a trend-entry environment.
This is a liquidity decision zone.
Liquidity Reality on This Chart
Liquidity is not something you predict.
It is something price either takes or doesn’t take.
On this chart:
Buy-side liquidity sits above recent highs.
Sell-side liquidity sits below recent higher lows.
At the current price:
Buy-side liquidity is not yet clearly accepted.
Sell-side liquidity is not yet clearly taken.
Meaning:
Price is between liquidity pools.
This is the most dangerous zone for live trading.
Why the “Middle” Is Where Accounts Get Damaged
When price is between liquidity pools:
Risk-to-reward becomes asymmetric.
Breakouts lack confirmation.
Reversals lack fuel.
Entries become emotional, not structural.
Most losing trades happen here, not at extremes.
This is why MARAL treats the middle as a WAIT zone, not an opportunity.
What MARAL Waits for on This Chart
MARAL does not ask:
“Is gold bullish?”
It asks:
“Has liquidity been resolved in a way that permits execution?”
There are only two valid next steps:
1) Buy-Side Liquidity Taken + Acceptance
Price takes the highs.
Holds above them.
Builds acceptance (not just a wick).
Only then does continuation become executable.
2) Buy-Side Liquidity Taken + Rejection
Price takes the highs.
Fails to hold.
Closes back into range.
Only then does mean reversion or pullback logic activate.
Until one of these happens, MARAL stays inactive.
Why This Protects Live Traders
Without liquidity rules, traders:
Buy into resistance.
Sell into support.
Chase candles.
Tighten stops randomly.
Overtrade ranges.
With liquidity rules:
Trades are earned, not guessed.
Entries happen after information, not before.
Risk is defined by structure, not emotion.
MARAL’s job is not to find more trades.
It is to block bad ones.
Key Takeaway from This XAUUSD Chart
This chart is not saying “buy” or “sell.”
It is saying:
“Wait until liquidity makes the decision for you.”
Liquidity tells you where stops were hit.
Execution permission comes from what price does after that.
Until then:
No prediction.
No anticipation.
No forced entries.
MARAL Liquidity Conditions (0/1) — Execution Rules
In MARAL, liquidity isn’t “concept.” It’s a binary event gate. 0.00 = not triggered. 1.00 = triggered.
Reference pools:
PDH = Prev Day High → Buy-side liquidity
PDL = Prev Day Low → Sell-side liquidity
1) 0.00 / 0.00 → “NO LIQUIDITY EVENT” Price is between pools:
Candle High < PDH
Candle Low > PDL
✅ Meaning: No sweep happened. You’re in the middle zone. MARAL prefers WAIT / reduce size / demand extra confirmation.
2) 1.00 / 0.00 → “BUY-SIDE SWEEP EVENT” Triggered when price tags / wicks above PDH (or a defined swing high).
✅ Meaning: stops above highs were likely harvested. Next decision is NOT “buy.” Next decision is “accept or reject above PDH.”
3) 0.00 / 1.00 → “SELL-SIDE SWEEP EVENT” Triggered when price tags / wicks below PDL (or a defined swing low).
✅ Meaning: stops below lows were likely harvested. Next decision is NOT “sell.” Next decision is “accept or reject below PDL.”
4) 1.00 / 1.00 → “DUAL SWEEP / RANGE LIQUIDITY” Both sides got taken in the same session/window:
A push above highs AND a push below lows
✅ Meaning: stop-hunt environment / expansion trap risk. MARAL demands structure reclaim + volatility control before any entry.
Post-sweep MARAL decision gates (the real edge)
After any sweep (Buy-side or Sell-side), MARAL waits for one of two outcomes:
A) Acceptance (Continuation permitted)
Price holds beyond the swept level
Follow-through candles confirm
✅ Interpretation: the sweep was breakout fuel, not a trap.
B) Rejection (Reversal / pullback permitted)
Price wicks beyond the level then closes back inside
Reclaim confirms
✅ Interpretation: the sweep was liquidity grab, not real continuation.
Golden rule
Liquidity flag = “where stops got hit.” Entry permission = “what price did AFTER stops got hit.”
MARAL Liquidity: How It Helps Live Trading (Not Theory)
Most traders know liquidity.
They still lose live — because they trade it too early or in the middle.
MARAL turns liquidity into execution gates so you don’t “guess.”
You wait for the event, then trade the reaction.
1) MARAL converts liquidity into a binary live signal (0/1)
Liquidity becomes usable when it’s measurable:
Buy-side Liquidity (High) = stops above highs (PDH / swing highs)
Sell-side Liquidity (Low) = stops below lows (PDL / swing lows)
0.00 = not triggered on this bar/window
1.00 = triggered on this bar/window
This is huge live, because it kills imagination:
“Did price actually take the pool, yes or no?”
2) 0/0 is NOT “nothing” — it’s a warning
Buy = 0.00 and Sell = 0.00
means: price is between pools.
Live meaning:
you are in mid-range
RR becomes random
both directions can wick you out
How it helps traders:
MARAL stops you from trading the worst zone where most retail accounts get chopped.
3) 1/0 or 0/1 tells you: “Liquidity event just happened”
When you see:
1/0 → buy-side liquidity taken (stops above highs hit)
0/1 → sell-side liquidity taken (stops below lows hit)
Live meaning:
the market just did its “stop run”
now the real question is acceptance vs rejection
How it helps traders:
You stop entering into the sweep.
You wait for what price does after the sweep.
4) The real edge is post-sweep behavior (MARAL live rule)
After a liquidity grab, MARAL expects only 2 outcomes:
A) Acceptance (continuation allowed)
price holds beyond the swept level
follow-through candles confirm
✅ Meaning: sweep acted as fuel
B) Rejection (reversal/pullback allowed)
wick beyond level then closes back inside
reclaim confirms
✅ Meaning: sweep was a trap collection
How it helps traders:
This is how you avoid the #1 mistake:
“I bought the wick.” / “I sold the wick.”
5) 1/1 is a live “danger mode”
Both sides taken (in same session/window) = stop-hunt environment.
Live meaning:
range expansion
fakeouts increase
structure becomes unreliable
How it helps traders:
MARAL forces extra confirmation or reduces trade frequency.
You stop treating volatility as opportunity when it’s actually noise risk.
MARAL Liquidity Summary (Live Trading)
Liquidity is not a setup. It’s a test.
0/0 → middle zone → WAIT
1/0 or 0/1 → sweep happened → trade only after acceptance/rejection
1/1 → stop-hunt regime → high confirmation needed.
Final Note
This analysis is educational, focused on execution behavior, not signals or financial advice.
Use it to improve decision quality, not to chase outcomes.
#Trading #Liquidity #SMC #PriceAction #RiskManagement #Forex #Crypto #XAUUSD #NAS100 #ICT #Liquidity #Engineering

Chapter 18 — The Reversal TrapWhy trying to catch tops & bottoms destroys accounts
Most accounts don’t blow up from “bad strategy.”
They blow up from one addictive behavior: forcing a reversal when the market has not granted reversal permission.
A reversal is not a candle pattern.
A reversal is a regime change — structure, participation, and liquidity behavior must all rotate together.
1) The trap: “It fell a lot, so it must bounce”
After a strong impulsive move, your brain starts doing dangerous math:
“It already dumped, downside is limited.”
“This is a discount.”
“I’ll catch the bottom with a tight SL.”
“Just one bounce and I’m back.”
That thinking is not analysis.
That is recovery psychology wearing a technical mask.
And the market punishes it because in a real downtrend, bounces are often just liquidation relief, not reversal.
2) What this chart is actually saying (not what you want it to say)
Look at the execution readouts on the BTCUSD 1H chart:
Context Board (right):
Direction: Bearish
H1 / H4 / Daily: Bearish
Momentum: BEAR
Liquidity Context: LOW
Long Score: 10 (No-Trade)
LTF Exec: WEAK
Qualification Gate (top):
SETUP: WAIT
LIQUIDITY: LOW
ENTRY PERMISSION: SKIP
EDC (bottom-right):
SETUP: WAIT
ENTRY PERMISSION: SKIP
LIQUIDITY: LOW
ACTION STATE: HOLD
This is not a “find the bottom” environment.
This is the system telling you: the market is not offering clean participation, and long attempts are structurally unsupported.
3) Why reversals fail here (the mechanics)
In bearish conditions with low liquidity:
Price bounces easily (because thin liquidity lets it lift)
Traders confuse bounce with reversal and enter early
The next sell wave hits (often a liquidity sweep / reloading)
Price drops back into the range
Your “tight SL” becomes a guaranteed stop-out machine
You re-enter to “get it right” → the real damage begins
The trap is not one loss.
The trap is repeat exposure inside a non-permission regime.
4) The hidden killer: “Bottom hunting” creates the worst R:R in reality
On paper, catching bottoms looks like high reward.
In practice, it produces:
Low hit-rate entries
Chop + wick environment
Stop clusters hunted repeatedly
Emotional re-entry loops
Over-leverage temptation (“If I nail this bottom, it’s huge”)
So even if you’re “right” once, the account is often already damaged by the attempts.
5) The professional rule: reversals are earned, not predicted
A valid reversal is when the market proves three things:
A) Structure shift
Break of the bearish sequence (lower highs / lower lows)
A reclaim that holds, not just taps
B) Liquidity behavior changes
Sweeps stop occurring “against you”
Liquidity stops being LOW; participation becomes consistent
C) Participation confirms
Momentum stops bleeding
Follow-through appears after the shift, not before it
Until these are aligned, a “reversal” is just a pullback inside continuation.
6) The Reversal Permission Checklist (use this before touching tops/bottoms)
A reversal attempt is only rational when most of these are true:
HTF context is neutralizing (bearish pressure reducing, not accelerating)
Liquidity is not LOW (no thin, stop-hunt conditions)
Momentum stops being BEAR-dominant (chop resolves into directional intent)
Long side stops showing “No-Trade” quality
Entry permission is not SKIP
LTF execution is not WEAK (execution conditions matter as much as direction)
If the dashboard says WAIT / SKIP / LOW, your job is not to be clever.
Your job is to protect capital and wait for permission.
7) The clean takeaway
Tops & bottoms are where ego trades.
Professionals don’t “guess” turning points — they trade after the market proves it has turned.
If you want longevity:
Stop trying to be first.
Start trying to be right with permission.
Catching a reversal is not a skill.
Avoiding the reversal trap is the skill.
#BTC #BTCUSD #Bitcoin #CryptoTrading #TradingPsychology #RiskManagement #Execution #NoTradeZone #MarketStructure #Liquidity #StopLossDiscipline #Overtrading #FOMO #ReversalTrap #TrendFollowing #CapitalPreservation #TradeManagement #PriceAction #Volatility #Discipline
Educational content only. Not financial advice. Markets involve risk; use your own risk management and decision process.

Chapter 17 — Stop-Loss RespectWhy SL mistakes are discipline failures, not technical errors.
( ETHUSD 1H chart attached)
Most traders think stop-loss problems are “technical”:
“My SL was too tight.”
“Wick hunted me.”
“Spread took me out.”
“The market is manipulated.”
That story feels logical. But it’s rarely the real cause.
The real cause is almost always the same:
Stop-loss mistakes are permission failures — not chart failures.
Because a stop is not a number.
A stop is a commitment to invalidation.
If your stop is not respected, it means you didn’t respect one of these:
Structure (your idea got invalidated)
Risk budget (you sized wrong)
Regime (liquidity/volatility wasn’t tradable)
Discipline (you edited the rules mid-trade)
1) What a stop-loss is supposed to represent
A proper SL is placed at the point where your trade idea becomes false.
Not where it “hurts less.”
Not where you “hope it won’t go.”
Not where you can “avoid getting stopped.”
SL = Invalidation.
If you don’t define invalidation clearly before entry, you are not trading—
you are negotiating with the market.
2) The 4 stop-loss sins (that blow accounts)
(A) Moving the stop because of emotion
This is the most expensive habit in trading.
It converts a controlled loss into an uncontrolled loss.
(B) “Let me give it some room” without reducing size
If you widen SL but keep the same position size, you are increasing risk without permission.
(C) Entering without a stop plan
No invalidation = no trade.
That’s not harsh. That’s professional.
(D) Re-entering immediately after SL without regime reset
This is the revenge loop.
A second entry without context change is usually an emotional trade wearing a technical mask.
3) What the attached MARAL chart is teaching (ETHUSD 1H)
This chart is a clean example of why SL respect is an execution skill.
On the boards, the market was not “quietly supportive”:
ECI score shows “No-Trade” (low execution confidence)
Liquidity Context shows LOW (thin conditions amplify slippage and wicks)
MTF status shows MIXED (conflict risk increases)
Management Desk shows:
Exit Pressure: HIGH
Risk State: OVEREXTENDED
Trade Status: WEAK
Action State: EXIT
Then the market printed a sharp downside displacement.
This is the point:
When the framework is already broadcasting exit / weak / low-liquidity / no-trade, any trader who “widens SL” or “hopes” is not making a technical decision.
They are breaking discipline.
4) MARAL stop-loss protocol (permission-based)
Pre-Entry (before you click)
You must answer all three:
Where is my invalidation? (structure level)
What is my risk if invalidated? (fixed % / fixed R)
Is the regime tradable? (liquidity + volatility + MTF alignment)
If any one is unclear → No permission.
Post-Entry (after you’re in)
You don’t “manage feelings.”
You manage state.
When MARAL flips to:
Exit Pressure: High
Risk State: High / Overextended
Action State: EXIT
ECI: No-Trade / confidence collapse
Your job is not to debate.
Your job is to execute the plan.
A stop is not a suggestion.
It’s a contract.
5) The professional mindset shift
A stopped trade is not a failure.
A stop violation is the failure.
Because:
A stop preserves capital.
Capital preserves opportunity.
Opportunity is what pays you.
If you can’t respect SL, you don’t have a strategy problem.
You have a permission problem.
Closing
The market doesn’t punish traders for being wrong.
It punishes traders for refusing to be wrong.
Respecting the stop is respecting reality.
That is the first layer of execution intelligence.
(Educational only. Not signals. Not financial advice.)
#Trading #RiskManagement #StopLoss #TradingPsychology #Execution #MarketStructure #Discipline #MARAL #CryptoTrading #ETHUSD

Chapter 15 — Confirmation AddictionHow waiting for “more confirmation” creates late entries (and worse trades)
(AVAXUSDT.P — 1H chart reference attached)
Most traders don’t lose because they’re “wrong.”
They lose because they enter after the move has already paid the early participants.
That behavior has a name: Confirmation Addiction.
It sounds responsible (“I’m waiting to be sure”).
In reality, it’s often fear disguised as discipline — and it produces the same outcome again and again:
✅ you feel safe
❌ you enter late
❌ your stop gets wider
❌ your R:R collapses
❌ you get chopped or stopped on the first pullback
What “Confirmation Addiction” looks like on this chart
On your panel, the market is MTF ALIGNED bullish, but not trending cleanly:
H1/H4 Context: Bullish
Daily Context: Neutral
Market Phase: RANGE
ADX ~14.7 (weak trend)
Participation: Weak
Risk Mod: Negative (divergence / internal weakness)
This combination is the perfect trap for late entries:
In a range, price repeatedly does this:
forms a base
pushes up a bit
pulls back and tests
pushes again
then fakes / retests / compresses
A confirmation-addicted trader keeps stacking requirements:
“Let it break the high”
“Wait for candle close”
“Wait for retest”
“Wait for another close”
“Wait for one more push”
By the time all of that happens, you are buying after the best location is gone — usually near the top of the internal range, right before a pullback.
Why “more confirmation” is mathematically worse
Each extra confirmation usually means one of two things:
1) You pay with distance
Your entry moves farther from the invalidation point → your stop must widen → position size shrinks → your upside becomes limited.
2) You pay with timing
The market has already done the displacement. Now you’re entering when mean reversion and pullback probability is highest.
So “more confirmation” often improves emotional comfort but damages:
location
R:R
trade longevity
drawdown tolerance
The real truth
Confirmation is not the edge. Location is the edge.
Confirmation should only answer:
“Is entry permitted here?”
Not: “Can I remove all uncertainty?”
Because uncertainty never disappears — it just gets more expensive.
MARAL Solution: Replace “More Confirmation” with “Entry Permission”
On this chart, you already have the correct framework showing you the truth:
MTF aligned bullish = direction permission exists
Range phase + weak ADX = breakout-chasing is dangerous
Risk mod negative = don’t over-trust pushes; demand clean reaction
Supportive LTF exec = allow precise entries only at good location
So the fix is simple and brutal:
Rule 1 — Define the Earliest Valid Entry (EVE)
Your entry is valid when you have:
HTF permission (aligned bias)
location (discount / range low / protected structure)
reaction (rejection or displacement + micro shift)
Anything beyond that is not “smart.”
It’s often late.
Rule 2 — Use a Two-Step Entry, not a “Perfect Entry”
In range + weak trend environments:
Step A: Probe entry at best location with tight invalidation
Step B: Add only if the move proves itself (structure + continuation)
This keeps you early without being reckless.
Rule 3 — Confirmation should control size, not timing
If you want “extra confirmation,” fine — but don’t delay the entry.
Instead:
Enter with smaller size at EVE
Scale only when the market pays you (acceptance + continuation)
That’s how professionals stay early and controlled.
How to spot Confirmation Addiction in real time (self-audit)
If you catch yourself saying any of these, you’re in it:
“Let me wait for one more candle…”
“I’ll enter after the breakout is confirmed…”
“I missed the first move, I’ll take the next one…” (next one = worst location)
“I need the market to prove it” (translation: I want certainty)
Execution takeaway for this AVAX setup
With MTF bullish but range + weak ADX, your best money is usually made by:
entering at the range base / discount with tight invalidation
not chasing the last confirmation candle near the highs
Trend permission ≠ trend conditions.
That’s why “aligned” can still chop you if you enter late.
A late entry is not a safer entry — it’s a more expensive entry.
Trade uncertainty with rules, not with delay.
(Educational only — not financial advice.)
#Execution #TradingMindset #DayTrading #SwingTrading #CryptoTrading #FuturesTrading #BreakoutTraps #RangeTrading #RRMindset #PositionSizing #TradeManagement #Edge

Chapter 14 — Range Is Not a Trend (Why most losses happen) Why most losses happen when traders trade chop like a trend.
(Chart: BNBUSDT 1H — HTF bullish + score A++… but Liquidity HIGH, Participation NEUTRAL, Risk State OVEREXTENDED, Risk Mode NEGATIVE, DIV NEG, Obstacle Ahead YES, Exit Pressure RISING → “trend-context / range-behavior” mismatch.)
1) The real problem: traders confuse bias with permission
Bias answers: “Where can price go?”
Permission answers: “Should I participate right now?”
In your snapshot, MARAL is basically saying:
Context: bullish (macro push still valid)
Micro-environment: late-stage / liquidity-heavy / rotation-capable
Management: protect, not add size
This is the exact zone where retail enters because “trend is up,” while price is actually transferring inventory.
2) What a range really is (technical definition)
A range is two-sided auction where:
price is mean-reverting around a value area
volatility exists, but directional follow-through is unreliable
the market is building positions, not delivering trend
Range engine = Stop runs + absorption + reversion
Stop run (liquidity sweep) creates fuel
Absorption prevents continuation
Price returns to value (reversion)
So a range is not “flat candles.”
It’s rotation structure.
3) The chop signature you must respect (microstructure)
A) Overlap & Compression (market “breathing”)
Multiple candles share the same body area
Progress stalls (HH forms but doesn’t expand)
Impulses die quickly and get retraced
Translation: aggressive buyers are getting filled by passive sell liquidity (absorption).
B) Wick expansion (two-sided trap)
Upper wicks spike near highs
Lower wicks spike near lows
Both sides get “proof” and then get reversed
That’s not trend. That’s liquidity harvesting.
C) “Continuation” becomes fake continuation
Pullback entries get punished (no displacement)
Breakouts occur into nearby liquidity pools, then revert
MSS triggers without follow-through (classic chop)
4) Why your MARAL states scream “Range Risk”
Liquidity Context = HIGH
High liquidity means price is near where orders exist:
EQH / prior highs (buy stops)
premium zones / supply pools
large resting liquidity (institutions love filling there)
Implication: probability of sweep → stall → revert increases.
Participation = NEUTRAL
Neutral participation = no clean sponsorship.
real trend needs sustained aggressive participation (market orders)
neutral means rotation dominates
Implication: signals become “valid-looking but low-conviction.”
Risk State = OVEREXTENDED
Overextended is the late phase of a leg:
distance from mean increases
marginal buyers are late
reward-to-risk compresses
pullback likelihood rises
Implication: even if trend continues, entries are structurally inferior.
Risk Mode = NEGATIVE + CAP = DIV NEG
This is a high-value filter.
Negative divergence means:
price can push highs,
but underlying momentum/flow is weakening
Implication: more likely to see:
failed continuation
distribution
sharp mean reversion
Obstacle Ahead = YES + Exit Pressure = RISING
Obstacle = next liquidity wall / supply / HTF resistance cluster.
Exit pressure rising means:
the market is encouraging profit-taking behavior,
not adding fresh exposure.
Implication: “add positions” becomes statistically bad.
5) “Trend execution” vs “Range execution” (the technical difference)
Trend execution requires Expansion → Pullback → Expansion
A trend is not the direction arrow. A trend is a delivery mechanism:
Displacement (impulse with strong close)
Pullback to a valid POI (OB/FVG/value area)
Continuation displacement (follow-through)
If step (3) fails repeatedly → range behavior.
Range execution requires Sweep → Rebalance → Reject
Range is a different engine:
Sweep liquidity at an edge (EQH/EQL)
Rebalance to value (FVG fill / mean)
Reject from the opposite edge or value
If you keep trading pullbacks like trend, you’re fighting the engine.
6) The MARAL fix: the Permission Sequence (hard gating)
When context is bullish but environment is range-capable, MARAL requires:
Permission Gate 1 — Liquidity event must occur first
No entry unless price does one of these:
sweeps a local high/low (stop raid)
breaks a micro-structure level with intent
Because without a liquidity event, you’re entering inside the dealer’s inventory.
Permission Gate 2 — Displacement must be measurable
Not “green candle.”
Measurable displacement:
strong body close beyond structure
reduced wick on impulse candle
breaks a micro swing level with momentum
No displacement = it’s rotation.
Permission Gate 3 — Structure shift must be clean
Require:
MSS/BOS after displacement
then retest (not chasing)
If MSS triggers and immediately gets negated → chop.
Permission Gate 4 — POI validation is required
POI is not “order block touched.”
POI is valid only when:
it produces displacement
it aligns with HTF context
it is not inside mid-range value
Permission Gate 5 — Risk desk overrides context
If:
Risk State = OVEREXTENDED
Exit pressure = RISING
Obstacle Ahead = YES
Then default action becomes:
reduce size
tighten SL
wait for reset
This is why your Management Desk says SCALE OUT / TIGHT SL.
7) “Range Trap Zones” (where most trend traders die)
Trap Zone 1 — Mid-range value
best place to get chopped
worst R:R
both sides can be right and still lose
Rule: MARAL blocks mid-range entries unless displacement proves trend.
Trap Zone 2 — Late-stage premium (overextended highs)
liquidity is harvested
divergence appears
breakout buyers become exit liquidity
Rule: when OVEREXTENDED + DIV NEG → treat new highs as risk, not opportunity.
Trap Zone 3 — Breakout into obstacle
A breakout that runs into HTF obstacle is often:
a stop run
a fill event
a reversal trigger
Rule: obstacle ahead blocks chase entries.
8) Practical execution rules
MARAL Chapter 14 Rules — “Range Mode”
No mid-range entries. Only trade edges or after proven displacement.
Entry requires liquidity sweep (raid) first.
Displacement is mandatory. No displacement = no permission.
MSS + retest only. No chase.
If Liquidity HIGH + Participation NEUTRAL, treat as rotation until expansion proves otherwise.
If OVEREXTENDED + DIV NEG, default to protect / scale-out / wait for reset.
New trend entries are allowed only after:
pullback to POI
sweep
displacement
BOS
retest acceptance
A trend is a delivery. A range is a distribution.
When you buy distribution thinking it’s delivery, you donate to the chop.
#PriceAction #MarketStructure #Liquidity #SMC #ICT #OrderFlow #TradingPsychology #RiskManagement #Execution #CryptoTrading #BNB #TradingView

Chapter 13 — The First Entry IllusionWhy the “first entry” is rarely the safest entry (NZDUSD • 1H case study)
Retail logic says: “First touch = best price.”
Institutional logic says: “First touch = highest uncertainty.”
On the 1H, the first interaction with a zone is usually where liquidity is collected, not where clean continuation is guaranteed.
1) What “First Entry Illusion” really is
The illusion is thinking that a level is an entry.
But the market doesn’t pay you for finding levels.
It pays you for entering after the market proves intent.
First touch is often used to:
trigger impatient entries
run tight stops (because everyone places SL at the obvious edge)
create the real fill for the move (after liquidity is harvested)
So the first entry becomes the best price… for the other side.
2) Read this chart like an institution (using the boards)
A) Context Board (where the bias is, but also the conflict)
From your panel:
Direction: Bearish
H1: Bearish
Daily: Bearish
H4: Neutral
Structure: Bull Struct
Momentum: BEAR
Short Score: 78 (A)
Liquidity Context: HIGH
MTF Status: MIXED
15m bias: Bearish | 5m bias: Bearish
Translation:
Bias is leaning short, but structure is not perfectly aligned (bull-structure tag + mixed MTF).
That’s exactly where the first-entry trap becomes likely.
B) Qualification Gate (this is the key proof)
From your gate:
SETUP: SHORT
HTF CONTEXT: WARN
STRUCTURE: BAD
MOMENTUM: OK
VOL/REGIME: OK
LIQUIDITY: HIGH
ALIGNMENT: 78 / 65
ENTRY PERMISSION: ENTER
This is the “First Entry Illusion” signature:
You can get “ENTER”…
while HTF is WARN and Structure is BAD
and Liquidity is HIGH (meaning: stop pools likely still active)
So the system is basically saying:
“Yes, the short idea is valid — but the environment is still capable of a shakeout.”
That’s institutional thinking: permission is not a promise.
C) Management Desk (why first entry needs management discipline)
From your desk:
Trade Status: VALID
Market Phase: CONTINUATION
Exit Pressure: LOW
Momentum Health: STRONG
Risk State: OVEREXTENDED
Trade Age: FRESH
Action State: HOLD
Translation:
The move is alive (strong momentum / low exit pressure), but risk is overextended → chasing first entry or late entry is expensive.
Institutions don’t “feel” that — they measure it.
3) The institutional sequence (what retail skips)
Retail tries to win by being early.
Institutions try to win by being right after proof.
The safer sequence:
1) Liquidity job happens (HIGH liquidity = expect raids / stop runs)
2) Displacement confirms intent (real push, not just a wick)
3) Retest gives controllable invalidation (this is where risk becomes clean)
4) Then execution (not before)
✅ Rule:
First touch = information.
Second interaction + proof = execution.
4) Practical “No-Trap” rule for Chapter 13 (viral simple, institutional true)
If LIQUIDITY = HIGH and STRUCTURE = BAD/WARN, treat the first entry as a probe, not a full position.
Your discipline upgrade:
First touch: small size / or no trade
Wait: displacement + retest (or structure repair)
Then: full entry with clean SL logic
That is the mindset shift:
From “I want the best price” → to “I want the safest permission.”
5) The real goal (mindset change)
My objective is not to excite retail traders with “early entries.”
My objective is to re-engineer retail behavior into an institutional execution mindset:
Permission > Prediction
Proof > Hope
Risk governance > emotional timing
The core mistake:
Retail thinks: “First touch = best price.”
Institutions think: “First touch = liquidity extraction zone.”
If liquidity is high, the first touch is often designed to punish impatience.
Mistake #1 — Treating a level as an entry
Retail behavior:
“Price reached my zone → I must enter.”
Why it fails (market mechanics):
A zone is only a location. Institutions still need inventory + liquidity.
So they often use the first touch to:
trigger breakout entries
trap reversal entries
sweep obvious stop placements
✅ MARAL solution: Qualification Gate separates “location” from “permission”
Even when SETUP = SHORT, MARAL exposes the danger when:
HTF CONTEXT = WARN
STRUCTURE = BAD
LIQUIDITY = HIGH
Translation: “You are early in a hostile environment. First touch is not a green light.”
Mistake #2 — Ignoring the Liquidity Job
Retail behavior:
Entering before the market raids nearby liquidity pools.
Why it fails:
When Liquidity = HIGH, the market is telling you:
“There are stop pools nearby. Price will likely interact with them before continuing.”
Most first entries get stopped because they sit exactly where liquidity is being harvested.
✅ MARAL solution: Liquidity Context becomes an execution filter
When LIQUIDITY = HIGH, MARAL forces a mindset shift:
First touch = observation / probe
Second interaction after proof = execution
This is institutional sequencing.
Mistake #3 — Thinking “ENTER” means “SAFE”
Retail behavior:
If a tool says “enter”, they go full size emotionally.
Why it fails:
A valid setup can still be a low-quality entry timing.
Market can be right — but the entry can be wrong.
✅ MARAL solution: Permission ≠ Promise (soul of execution)
MARAL gives permission, but the boards reveal risk context.
That’s why ENTRY PERMISSION can show ENTER while
HTF = WARN + STRUCTURE = BAD still exists.
Meaning: Trade idea may be valid, but first entry risk is elevated.
Mistake #4 — Using “tight SL at the obvious place”
Retail behavior:
Stops placed at the clean edge of the zone.
Why it fails:
The clean edge is exactly where the market expects stops to sit.
First touch often manufactures a wick to take those stops, then continues.
✅ MARAL solution: Management Desk converts entries into risk-governed positions
Use the desk like a professional:
If Risk State = OVEREXTENDED → don’t chase / don’t full size
If Trade Age = FRESH + Momentum Health = STRONG → hold winners logically, not emotionally
If Exit Pressure = LOW → avoid panic exits on noise
It’s not about “being right”. It’s about “staying right.”
Mistake #5 — No “Proof Step” (they skip confirmation)
Retail behavior:
They enter at touch. They don’t require displacement or structure repair.
Why it fails:
Without proof, first entry is just a guess.
✅ MARAL solution: Proof-based execution gating
MARAL’s institutional workflow is:
Context → Qualification → Management
So the correct approach is:
When Structure is BAD/WARN: demand proof (displacement / repair)
When MTF Status = MIXED: reduce aggression (no hero entries)
When Liquidity = HIGH: expect traps first
The MARAL “First Entry Protocol” (simple + viral)
When you see this combination:
✅ Setup: SHORT
⚠️ HTF: WARN
❌ Structure: BAD
🔥 Liquidity: HIGH
Your action is not “enter fast”.
Your action is:
1) No full size on first touch
First entry = probe or wait.
2) Require proof
Displacement + cleaner retest.
3) Let the market pay you for patience
Second interaction is usually safer than the first.
Closing line (institutional mindset)
Retail asks: “How early can I enter?”
Institutions ask: “Has the market earned my participation?”
Your goal is not to catch the first move.
Your goal is to catch the safest move.
#Trading #Forex #SMC #SmartMoneyConcept #OrderBlocks #Liquidity #MarketStructure #PriceAction #RiskManagement #TradingPsychology #TradingDiscipline #DayTrading

Chapter -12 The Waiting Skill (Why Waiting Is a Weapon)Chapter -12 The Waiting Skill (Why Waiting Is a Weapon)
Why inactivity is often more profitable than constant trading
Chapter 10 (Exit Intelligence & Trade Aging) proved something important: traders don’t actually need more signals — they need more control. The response i got (≈2.3K views + 131 Like) is the evidence: people are emotionally hungry for execution discipline and loss prevention, not “another buy/sell arrow.”
This chapter is the missing half of that story:
Exit Intelligence protects you once you’re in.
Waiting Skill protects you before you enter.
And the market rewards the second one even more.
1) The uncomfortable truth
Most accounts don’t blow up because the trader “can’t find entries.”
They blow up because the trader cannot sit still.
Overtrading is not a technical issue.
It’s a behavioral leak disguised as “analysis.”
You don’t lose because you didn’t trade enough.
You lose because you traded when the market did not give permission.
2) Why inactivity is profitable
Waiting is profitable for three reasons:
A) It deletes your worst trades
Your worst trades almost always come from:
low liquidity
mixed timeframes
range/chop
late entries after expansion
“forced setups”
Waiting removes those by default.
B) It upgrades your entry price
When you wait, you don’t chase.
You let the market come to your area.
That means:
tighter stop
better R:R
less stress
fewer “save trades” and revenge trades
C) It preserves mental equity
Capital is not only money.
It is also clarity.
Every unnecessary trade reduces clarity.
And clarity is the asset that produces the next clean trade.
3) The Waiting Skill is not “doing nothing”
Professional waiting is active. It has rules.
Waiting means:
scanning
grading conditions
refusing weak liquidity
refusing low-quality regime
refusing entries when permission is locked
Waiting is a decision. Not an absence of decision.
4) The chart lesson (your attached BTCUSD reference)
On your BTCUSD 4H chart, the story is perfect for this chapter.
What the Context Board is telling you
Direction: Bullish
H1 Context: Bullish
H4 Context: Bullish
Daily Context: Neutral
Liquidity Context: LOW
LTF Exec: WEAK
Market Phase: RANGE
Risk State: OVEREXTENDED
Active Window: OFF
ECI score shows 78 (A) but with CAP NOTES: LOW LIQ
This is the core lesson:
Even with a strong score, LOW LIQ + RANGE + OVEREXTENDED + LTF WEAK means:
your edge is not entry — your edge is waiting.
What the Qualification Gate / EDC is saying
SETUP: WAIT
ENTRY PERMISSION: WAIT
LIQUIDITY: LOW
So MARAL is doing exactly what a real execution system must do:
✅ it separates “market bullish” from “trade allowed”
✅ it blocks forced participation
✅ it prevents the most common type of loss: the impatience loss
What this means in real trading language
This is not a “no trend” environment.
It’s a “trend exists, but entry quality is currently unsafe” environment.
And that distinction saves accounts.
5) The retail illusion: “If it’s bullish, I must buy”
Retail logic:
Market bullish → buy now → hope
Professional logic:
Market bullish → wait for liquidity + timing + permission → then execute
Direction is not permission.
Trend is not timing.
Bias is not entry.
The Waiting Skill is the ability to hold that separation.
6) What MARAL is really teaching here
MARAL is not only a tool.
It is a behavior correction system.
It forces three professional behaviors:
(1) Permission-based execution
If Entry Permission is not granted, you do not trade — no matter how “good” the chart looks.
(2) Liquidity-aware patience
Liquidity LOW means:
spreads/inefficiency in execution
chop fake-outs
poor follow-through
stops get hunted easier
So MARAL uses liquidity as a safety switch.
(3) Regime recognition
Market Phase = RANGE means:
more noise than edge
you need perfect timing or you bleed slowly
So MARAL pushes you into WAIT mode until structure becomes tradeable.
7) The Waiting Checklist
Use this as a strict gate:
WAIT if ANY of these is true
Liquidity Context = LOW
Market Phase = RANGE
Risk State = OVEREXTENDED
LTF Exec = WEAK
Entry Permission = WAIT
Setup = WAIT
Daily Context = Neutral while lower TFs are pushing late
Only consider entry when
Liquidity improves (LOW → Neutral/High)
Market Phase shifts (Range → Trend / Expansion)
Risk State cools down (Overextended → Normal)
Entry Permission unlocks
LTF Exec strengthens
This is how you convert “I want more signals” into “I want better trades.”
8) The hidden advantage: waiting gives you cleaner exits too
Chapter 10 was about Exit Intelligence.
Here’s the connection:
Bad entries create bad exits.
If you enter during:
low liquidity
range regime
overextended conditions
…your exits become emotional:
early exit
late exit
panic close
revenge re-entry
So waiting is not just “entry discipline.”
It is exit quality protection.
Engineering Analogy (This Is Exactly Engineering)
A pump system never runs at full speed all the time.
It operates only when the system demands it — and only when safe operating conditions are confirmed.
It waits for:
Demand signal (real requirement, not noise)
Pressure setpoint deviation (a valid reason to engage)
Safe operating window (operating inside design limits)
Stable suction condition (NPSH safety — no cavitation risk)
Now bring the same logic to trading:
A professional trading system doesn’t “run” because it can.
It runs only when conditions permit safe operation.
Think of this like a BMS (Building Management System) Engineering point of view — to show how an execution framework should behave every second, not only at entry.
Just like a BMS continuously monitors:
Temperature
Pressure
Flow
Alarms
Safety thresholds
This framework continuously monitors:
Market state
Execution permission
Risk conditions
Liquidity pressure
Trade validity
Every second. No guessing. No prediction.
Key point:
This is not about generating buy/sell signals.
This is about real-time decision governance.
Just like a BMS doesn’t open a valve because temperature moved 0.1°,
this system doesn’t allow a trade just because price ticks.
Markets don’t need faster traders.
They need better decision control.
Watch the seconds — not the candles.
And one more point — because this is engineering:
I don’t ignore small variables in complex systems.
In engineering, micro-deviations create macro failures (vibration → fatigue → breakdown).
Markets are no different: small condition shifts become big losses when execution is uncontrolled.
That’s why this is an engineering-driven execution tool —
built to monitor micro-changes and enforce discipline before damage happens.
In buildings, a BMS (Building Management System) does not “guess.”
It enforces interlocks:
If a safety condition fails → the system blocks operation
If the environment is unstable → it stays in WAIT / HOLD
If alarms trigger → it shifts into protective mode
If multiple parameters don’t align → it refuses to start, even if one signal looks good
Trading should be the same.
MARAL is built exactly like that.
It is not a “signal generator.”
It is an engineering-grade execution control system — a safety interlock + decision logic that prevents forced participation.
Because in real engineering:
Running at the wrong time destroys equipment.
And in markets:
Trading at the wrong time destroys accounts.
chapter closing
The trader who wins long-term is not the one with the most trades.
It is the one with the most refused trades.
Waiting is not passive.
Waiting is selecting only the market moments that pay.
Note : This is an educational execution framework demonstration — not a signal service, not investment advice, and not a recommendation to buy or sell any asset.
#Trading #TradingPsychology #Discipline #RiskManagement #Execution #PriceAction #SmartMoney #ICT #Liquidity #Bitcoin #BTC #Forex #Futures #SystemTrading #TradingRules #NoTradeIsATrade #EngineeringMindset #BMS #AutomationLogic #ProcessControl #MARAL

Chapter 11 — Late Entry Trap (What traders keep repeating)Deep Dive on “Late Entry Trap” Mistakes (What traders keep repeating)
(Reference: the attached XAUUSD 1H chart)
This chart is a perfect example of a common trading failure pattern:
1) The real trader problem here (human behavior)
After a strong impulsive move, the brain does something dangerous:
A) “I missed it” becomes urgency
• When price runs without you, it creates pain.
• That pain turns into a decision like: “I must enter now to fix the regret.”
• This is not analysis. It’s emotional compensation.
B) Candle strength becomes “proof”
• Big green candles feel like confirmation.
• But strong candles are often the end of the easy part, not the beginning.
• Late buyers enter when smart money is already reducing risk, not increasing it.
C) Traders confuse movement with opportunity
• Movement looks like opportunity.
• But the best opportunities often come during reset, not during acceleration.
________________________________________
2) Deep explanation of each mistake (common + costly)
✅ Mistake 1 — Chasing after expansion (the “late momentum buy”)
What they do:
They buy after a long push because it “looks strong.”
Why it fails:
After expansion, the market naturally wants to:
• rebalance,
• cool down,
• or trap late participants.
Truth:
When you enter after expansion, you’re not early.
You’re the liquidity for someone else’s exit.
________________________________________
✅ Mistake 2 — Buying near the top (entering at worst risk zone)
What they do:
They enter where price already traveled a lot.
Why it fails:
• Your stop has to be bigger (because structure is far below).
• Your target becomes smaller (because price is already high).
• So the trade becomes bad math instantly.
Truth:
Late entry turns a good trend into a bad risk-reward trade.
________________________________________
✅ Mistake 3 — Entering during low participation (thin liquidity trap)
What they do:
They enter when the market “moves” but participation is weak.
Why it fails:
Thin participation = price can jump both ways easily:
• small orders move price too much,
• sudden wicks hit stops fast,
• reversals become sharp.
Truth:
In low participation, your stop becomes a magnet.
________________________________________
✅ Mistake 4 — Ignoring range behavior (trend fantasy inside a pause)
What they do:
They trade as if continuation is guaranteed.
What’s really happening:
After a run, price often enters a “rotation” phase:
• back-and-forth candles,
• fake breakouts,
• stop sweeps.
Truth:
A range after a push is not “rest before continuation.”
It’s often a trap-building zone.
________________________________________
✅ Mistake 5 — Confusing candle strength with trade quality
What they do:
They believe: “Strong candle = safe entry.”
Why it fails:
Strong candles often appear:
• right before pullback,
• right before profit-taking,
• right before consolidation.
Truth:
Strong candles can be the last invite before reversal.
________________________________________
✅ Mistake 6 — Overtrading after missing the first entry
What they do:
They attempt multiple entries:
• first entry fails → re-enter,
• second fails → re-enter again.
Why it fails:
Because they’re no longer trading the chart — they’re trading their ego.
Truth:
Multiple entries inside the same zone is often revenge trading in disguise.
________________________________________
✅ Mistake 7 — Widening stop-loss (the silent account killer)
What they do:
They widen SL because they “believe” the direction is right.
Why it fails:
Direction might be right — but timing is wrong.
Widening SL doesn’t fix timing; it just increases damage.
Truth:
A widened SL is not risk management.
It’s denial.
________________________________________
✅ Mistake 8 — No rebuild entry (entering without reset structure)
What they do:
They enter with no:
• pullback base,
• retest,
• clean trigger zone.
Why it fails:
Without rebuild, the market has no “support floor” to protect your entry.
So even a normal pullback looks like a stop hunt.
Truth:
No rebuild = no protection.
________________________________________
✅ Mistake 9 — Entering while conditions deteriorate (the “looks good but weak” trap)
What they do:
They ignore that momentum quality is weakening.
Why it fails:
Markets can still go up while strength fades — and then collapse quickly.
This is why late entries get punished:
• upside slows,
• downside snaps.
Truth:
When quality deteriorates, your entry becomes a coin flip.
________________________________________
✅ Mistake 10 — No re-entry rule (entering emotionally, not logically)
What they do:
They treat every re-entry like the first entry.
Why it fails:
Re-entry is a different trade type.
It requires confirmation that:
• the move reset,
• conditions stabilized,
• risk reduced.
Truth:
Without a re-entry rule, every missed move becomes a future loss.
________________________________________
3) Simple market reality (why this “danger window” exists)
After a strong bullish leg, the market is usually deciding between:
• Pullback (healthy reset)
• Range (trap + liquidity sweep)
• Final push (exhaustion move) → then sharp reversal
So late entries get punished because:
✅ risk is high (stretched price)
✅ reward is limited (less space left)
✅ noise is higher (range + sweeps)
________________________________________
✅ Solution: What MARAL does in this exact situation
Now we bring MARAL in.
4) MARAL’s core message here
MARAL prevents the “late entry trap” by doing two things:
A) It blocks entries when trade quality is not stable
Even if direction looks bullish, MARAL checks:
• Is the market in a clean trend or in a range?
• Is liquidity supportive or thin?
• Is execution safe or “avoid” conditions?
• Is the score improving or deteriorating?
• Is the market overextended?
If those conditions are not healthy, MARAL pushes you into WAIT / NO-TRADE / AVOID mode.
B) It forces a “reset rule” before re-entry
MARAL doesn’t allow “I missed it so I’ll chase.”
It demands a reset first, like:
• price cools down,
• structure rebuilds,
• liquidity improves,
• alignment becomes clean,
• execution window turns active again.
Only after this reset does it give re-entry permission.
________________________________________
5) MARAL’s practical outcome for the trader (what changes)
• It stops you from buying after the move (where most traders get trapped).
• It protects you during low-liquidity / mixed conditions.
• It prevents “revenge re-entry” and overtrading.
• It trains you to wait for permission, not candle excitement.
• It turns “missing a move” into a non-event: skip → wait → re-enter only when conditions reset.
________________________________________
Final punchline (Chapter 11 close)
Most traders don’t lose because they read direction wrong.
They lose because they enter at the wrong moment — late, stretched, and emotional.
This chapter is about eliminating that exact mistake.
#TradingPsychology #TraderMistakes #LateEntry #FOMO #RiskManagement #Liquidity #MarketStructure #Execution #NoTradeIsATrade #Discipline
Educational Purpose Only
This content is shared strictly for market education and trader awareness.
It explains common behavioral mistakes, market conditions, and execution concepts observed in real charts. This is not financial advice, not a buy/sell signal, and not a trading recommendation. Trading involves risk, and all decisions remain the responsibility of the individual trader. Past market behavior does not guarantee future results.
Chapter 10 — Exit Intelligence & Trade AgingHow MARAL manages exits when the trade is “right”… but the market is changing.
(Reference: your attached BTCUSD 1H chart, Jan 04, 2026)
10.1 The core idea
Most traders lose profits for only two reasons:
They exit too early (fear) during continuation.
They exit too late (greed) after expansion is already mature.
MARAL Exit Intelligence is designed to solve this by converting “exit emotion” into rule-based states:
Trade Age tells you where the trade is in its lifecycle
Risk State tells you how fragile the trade is right now
Exit Pressure + Obstacle Ahead tells you when the market is starting to push back
Action State tells you the next move: HOLD / REDUCE / PROTECT / EXIT
MARAL does not “predict the top.”
It detects when the trade has shifted from profit potential → risk dominance.
10.2 What MARAL watches for exits
MARAL exits are not one trigger. They are a stack of confirmation.
A) Trade Age (time + distance)
Trade age is not only “how many candles.”
It’s also: how far price has traveled relative to normal movement.
MARAL treats a trade like this:
FRESH → early delivery, best continuation odds
MATURE → mid-delivery, needs management discipline
OVEREXTENDED / LATE → high reward already captured, risk of reversal increases
STALE → market stopped paying you, exit logic becomes aggressive
✅ In your chart, Management Desk shows TRADE AGE: FRESH, but RISK STATE: OVEREXTENDED.
This is an important combination and MARAL handles it cleanly.
Meaning:
The trade may still be structurally healthy (fresh continuation context),
but price has moved far enough that risk is now elevated, so management must tighten.
B) Risk State (profit protection mode)
Risk State is the exit-intelligence backbone.
Common MARAL Risk States (conceptually):
STABLE → normal management
CAUTION → tighten SL, stop adding
OVEREXTENDED → scale out + protect aggressively
NEGATIVE / FRAGILE → exit-ready, do not negotiate
✅ In your chart: RISK STATE = OVEREXTENDED
This is MARAL’s warning that “the move has already paid; don’t let profit turn into regret.”
C) Exit Pressure (market pushback detector)
Exit Pressure rises when the market starts showing:
momentum weakening after expansion
repeated wick rejection near highs
inability to progress (stalls)
divergence behavior (internal weakness)
reaction at premium arrays / obstacles
✅ In your chart: EXIT PRESSURE = LOW and MOMENTUM HEALTH = STRONG
So MARAL does not ask you to panic-exit.
Meaning:
The market is still supporting continuation, but because Risk State is overextended, MARAL says:
“Hold — but protect.”
D) Obstacle Ahead (where exits are likely to trigger)
Obstacle Ahead flips to YES when price is approaching:
a higher timeframe premium array / resistance
a likely sell-side liquidity defense
an unfilled imbalance or supply zone that historically rejects
“stop run zones” where continuation often pauses
✅ In your chart: OBSTACLE AHEAD = NO
So MARAL is not seeing an immediate structural ceiling right in front.
10.3 Reading your attached chart using MARAL Exit Intelligence
What the boards are saying (your screenshot)
Context Board (Right):
Direction: Bullish
Structure: BULL Struct
Momentum: BULL
Trend strength: ADX 42.8 (strong)
Liquidity context: LOW
ECI Score: 58 (B)
LTF Exec: AVOID
EDC / Decision Core (Bottom center):
Setup: WAIT
Entry Permission: WAIT
Liquidity: LOW
Trade Status: VALID
Action State: HOLD
Management Desk (Bottom right):
Market Phase: CONTINUATION
Momentum Health: STRONG
Exit Pressure: LOW
Risk State: OVEREXTENDED
Trade Age: FRESH
Action State: HOLD
MARAL interpretation (clean execution meaning)
This is a textbook “do not add / do not chase” condition.
The trend is strong (ADX high, momentum strong)
Market phase is continuation
Exit pressure is low (so no forced exit)
But liquidity is low + risk is overextended
Therefore the correct action is:
✅ HOLD the position (if already in)
❌ DO NOT open new entries here
✅ Switch into protection mode (Exit Intelligence)
10.4 What MARAL would recommend here (practical playbook)
If you are already in profit (best-case)
MARAL Exit Intelligence = “Hold with protection.”
Do this in order:
Scale-out logic (profit locking)
Take partial profit at the first “overextended” warning
Keep a runner only if momentum remains strong and exit pressure stays low
A premium rule:
If RISK STATE = OVEREXTENDED, you must “pay yourself” at least once.
Move to protected SL
Tighten SL under:
the nearest clean structure low, or
last impulsive base, or
a logical “continuation invalidation” level
Never widen SL during overextended state.
Trail only after confirmation
Trailing should activate only if:
momentum stays strong AND
exit pressure remains low-to-neutral
If exit pressure starts rising → trailing becomes aggressive.
No re-entry / no pyramiding
Your own board says it: Entry Permission WAIT, LTF Exec AVOID, Liquidity LOW.
This is not a “more entries” zone. It’s a “manage the winner” zone.
If you are NOT in a trade (most important)
Your chart is clearly telling:
ECI 58 (B) + Entry Permission WAIT + Liquidity LOW + LTF Exec AVOID
That is MARAL’s way of saying:
“This is not a clean entry location.
Your job is to wait for a better execution window.”
So the correct decision is no trade until permission flips.
10.5 When MARAL would flip from HOLD → EXIT
Your chart is HOLD now, but Exit Intelligence has clear upgrade triggers.
MARAL would push toward EXIT when you see any combination like:
Exit trigger stack (high reliability)
Exit Pressure: LOW → NEUTRAL → HIGH
Momentum Health: STRONG → MIXED → WEAK
Obstacle Ahead: NO → YES
Risk State stays OVEREXTENDED while progress stalls
Trade Age shifts toward MATURE / STALE
Liquidity remains LOW and price starts “wicking” repeatedly
When 2–3 of those align, MARAL’s action state should shift:
HOLD → PROTECT → REDUCE → EXIT
10.6 Trade Aging rules (MARAL discipline)
This is how you keep winners and kill losers fast:
A) Fresh trade
Let it work
Do not micro-manage
Only adjust SL after structure confirms
B) Mature trade
Start paying yourself
Convert SL to protected
Stop re-entries unless liquidity improves
C) Overextended trade (your chart)
Mandatory profit lock
Tight management
No adding
Exit plan prepared in advance
D) Stale trade
If it doesn’t progress, it must exit
Time becomes an enemy when liquidity is low
10.7 The hidden advantage in your screenshot
Your chart shows something very “institutional”:
✅ Continuation + Strong momentum
but also
⚠️ Overextended + Low liquidity
This is exactly where most retail traders give profits back.
MARAL’s solution is precise:
It does not panic-exit (because exit pressure is low)
It does not allow greed entries (because permission is WAIT)
It converts the trade into a protected asset:
“Let it run, but don’t let it reverse.”
That is Exit Intelligence.
Exit when:
Exit Pressure rises + Momentum Health degrades
OR Obstacle Ahead becomes YES and progress stalls
OR Trade becomes stale (time without progress)
#MARAL #ExecutionIntelligence #TradingPsychology #RiskManagement #TradeManagement #SmartMoneyConcepts #ICT #PriceAction #Liquidity #Bitcoin #BTCUSD #TradingView

Chapter 9 — Reading the Market Moment Through Live Execution Chapter 9 — Reading the Market Moment Through Live Execution Intelligence
(A SENSEX Case Study — Observation → Permission → Post-Entry Reality)
1. Why This Chart Matters (Start With Reality, Not Theory)
This SENSEX 1H chart is a textbook example of how markets reward disciplined execution and punish emotional continuation.
Price is bullish.
Trend strength is present.
Context alignment is strong.
Yet — not every candle here was tradable.
This is exactly where most traders fail.
(Maral execution trading view live chart attached)
2. Market Moment vs MARAL Moment (Seen on This Chart)
On this chart:
Direction: Bullish
HTF Context: Aligned
Liquidity: High
Participation: Strong
Alignment Score: 93
ADX: Above 30
➡️ This confirms a Market Moment.
But MARAL does not assume permission automatically.
MARAL checks:
Is the move healthy now?
Is continuation supported now?
Is risk expanding now?
This distinction protects traders from late or emotional entries.
3. The Critical Zone: Where Traders Usually Make Mistakes
Observe the mid-chart consolidation and pullback zone.
This is where most traders:
Add aggressively because trend is bullish
Refuse to exit because bias is strong
Ignore internal stress building
Miss early momentum fatigue
Price did not collapse —
but risk quality temporarily degraded.
This is invisible to price-only traders.
4. ECI in Action: Execution Confidence, Not Signal
On this chart:
ECI Score: 93 (A++)
But ECI trend and state matter more than the number
ECI here is used to:
Validate holding, not chasing
Prevent panic during controlled pullbacks
Avoid re-entries during execution stress
ECI does not push trades.
It regulates behavior after entry.
5. Post-Entry Stress: What MARAL Reveals Live
During the pullback phase:
Market Phase: Range
Momentum Health: Neutral
Exit Pressure: Low
Risk State: Overextended
This combination tells a clear story:
Trend intact
But continuation quality temporarily weak
MARAL warns traders:
“Hold is allowed — aggression is not.”
This single insight saves traders from:
Over-adding
Emotional exits
Premature leverage
6. Divergence Risk Modifier: Silent Protection
Even while price structure remained bullish:
Momentum did not expand aggressively
Speed slowed
Energy recycled
This is where divergence risk does not mean reversal,
but means patience is required.
MARAL helps traders:
Avoid adding at exhaustion
Tighten management mentally
Wait for participation to return
7. Participation Strength: The Green Light for Continuation
Notice the right side of the chart:
Participation: STRONG
Liquidity Context: HIGH
Momentum: BULL
Alignment: ACTIVE
This is where MARAL confirms:
Holding remains logical
Trend continuation is supported
Stress has reduced
The rally that follows is earned, not chased.
8. The Key Insight for Real Traders
A trader may already have:
Their own entry setup
Their own trigger
Their own strategy
MARAL does not replace that.
Once the trade is live, MARAL answers:
Is my trade still healthy?
Is risk increasing or stabilizing?
Should I hold, reduce, or stay neutral?
This transforms trading from hope-based holding
to information-based decision-making.
9. Chapter 9 Summary — The Execution Truth
Markets move even when conditions weaken
Strong trends still contain high-risk zones
Most losses happen after entry
Observation must continue after execution
Holding is a decision — not an assumption
MARAL does not tell traders when to enter.
It helps traders understand what is happening now — and respond correctly.
The edge is not predicting the move.
The edge is staying aligned while the market reveals itself.
Educational Disclaimer
This analysis is for educational purposes only.
It does not provide financial advice or trade signals.
Trading involves risk. All decisions remain the trader’s responsibility.
Chapter 10 — Exit Intelligence & Trade Aging (Next chapter coming soon)
Just tell me if you have any clarification.
#TradingEducation
#MarketStructure
#ExecutionDiscipline
#RiskManagement
#TradeManagement
#MarketObservation
#ExecutionIntelligence
#TradingPsychology
#InstitutionalTrading
#PriceAction
#Liquidity
#TrendAnalysis
#CapitalProtection
#Consistency
#TradingView

Chapter 8 — MARAL Execution in Live MarketETH / USD (5-Minute Chart) — Context → Permission → Protection
Instrument: ETHUSD (Chart attached)
Execution TF: 5-Minute
Framework: MARAL — Reduced Execution Workflow
Purpose: Educational (Live Market Reading, Not Signals)
8.1 Objective of This Chapter
This chapter demonstrates how MARAL is read in a live market environment, using ETH/USD on a 5-minute chart, without hindsight, indicators abuse, or signal dependency.
MARAL does not predict price.
It governs execution decisions by answering three questions in sequence:
What side is allowed?
Is execution permitted now?
How must risk be protected after entry?
8.2 Context Board — Directional Permission (First Gate)
The Context Board defines directional eligibility, not entries.
Live ETHUSD Context (Observed)
Direction: Bullish
Structure: Bullish Structure
Momentum: Bullish
H1 Bias: Bullish
H4 Bias: Neutral
Daily Context: Bearish (higher-timeframe pressure)
Context Interpretation
Long positions are allowed
Shorts are blocked
Due to HTF conflict, aggressive continuation is discouraged
MARAL Rule:
If context allows only one side, execution must respect that side — even during pullbacks.
8.3 ECI Board — Execution Permission (Second Gate)
The Execution Confidence Index (ECI) is a quality filter, not a trigger.
Live ECI Observations
ECI Score: ~73
Risk Mode: Neutral
MTF Conflict: Present
Volatility Regime: Low Liquidity
ECI Interpretation
Execution permission is granted (ECI ≥ 65)
Environment is fragile, not expansive
Expectation must be reduced
Key Principle:
ECI ≥ 65 allows execution,
but liquidity and MTF alignment decide how much to expect, not whether to trade.
8.4 Entry Logic — What Makes Entry Acceptable
An ETHUSD long is acceptable only when all are true:
Context direction = Bullish
ECI ≥ 65 and stable
Entry aligned with structure (pullback / acceptance)
Liquidity condition acknowledged (Low → strict management)
This setup qualifies as a:
Low-Liquidity Continuation Long (Non-Aggressive)
Not ideal — but not invalid.
8.5 Management Desk — Activates Immediately After Entry
Once entry is taken, execution logic ends.
Risk protection begins immediately.
What Must Be Monitored Live
ECI behavior: must not collapse below 60
Candle closes: acceptance vs rejection
Follow-through: expected within 2–4 candles (5-min)
Context stability: no sudden flip or neutralization
MARAL assumes:
If continuation does not appear quickly in low liquidity, probability is decaying.
8.6 Stop-Loss Logic — Fixed, Structure-Based
Correct SL Placement (5-Minute ETHUSD)
Below the most recent valid Higher Low (HL)
Or below the local structure support
SL Rules
SL defined before entry
SL never widened
Wide ATR SLs are not suitable in low liquidity
MARAL Principle:
In low liquidity, the market must prove you right quickly —
otherwise, the idea is invalid.
8.7 Target Logic — PDH / PDL Usage on 5-Minute
Are PDH / PDL valid on 5-min?
Yes — PDH / PDL are high-quality liquidity objectives.
But they must be treated as reaction zones, not guarantees.
TP Structure
TP1 (Mandatory):
Before PDH
Or nearest internal high
Typically 1R–1.2R
Extended Target (Optional):
PDH only if:
ECI remains ≥ 65
Liquidity improves
Price shows acceptance near highs
In low liquidity, TP before PDH is professional discipline, not fear.
8.8 Re-Entry Rules (Often Violated)
Re-entry is allowed only if:
New liquidity is created
OR structure resets
AND ECI stabilizes again
AND context remains unchanged
Re-entry is not allowed:
Immediately after SL
For emotional recovery
Without new information
8.9 Key Takeaways from Live ETHUSD Execution
Context allowed long, but with caution
ECI permitted execution, not expansion
Liquidity demanded conservative expectations
Management discipline mattered more than entry
PDH acted as a reaction zone, not a breakout promise
MARAL does not chase moves.
It protects decisions.
8.10 Final Rule (This Chapter in One Line)
Context decides → ECI permits → Management protects
If any step fails, execution must stop.
Final Note — Role of the Trader vs MARAL
With MARAL, the trader is not required to continuously interpret or read raw charts.
All critical market states are already translated and structured through MARAL’s boards:
Context Board → defines directional allowance
ECI Board → evaluates execution confidence
Liquidity & Alignment States → qualify risk conditions
Management Desk → governs post-entry protection
The trader’s responsibility is not analysis, but rule adherence.
MARAL does not remove discretion —
it removes noise, impulse, and emotional decision-making.
Execution becomes a process of confirmation and discipline, not prediction or constant chart interpretation.
If MARAL does not permit execution, no chart reading can justify a trade.
With MARAL, the chart speaks through structure — the trader only listens and executes the rules.
Educational Disclaimer
This chapter is for educational and analytical purposes only.
MARAL is a discretionary execution framework, not a signal service, automation tool, or financial advice system.
#TradingView #ETHUSD #CryptoTrading #TradingExecution #RiskManagement
#MarketStructure #Liquidity #ExecutionDiscipline #DiscretionaryTrading
#RuleBasedTrading #CapitalProtection #MARAL

Volatility–Momentum–Trend (VMT) Model🔎 Intro / Overview
Three-indicator confirmation using Bollinger Bands (BB) , MACD , and RSI to align trend and price action.
BB often detects the move first (least lag), MACD follows the BB trend (mid reaction), and RSI confirms last (most lag).
This staged confirmation helps reduce false signals and keeps entries disciplined.
___________________________________________________________
📔 Concept
• Bollinger Bands (BB) → Early detector at volatility extremes.
– Buy : Price first moves outside the lower band , then a candle closes back above lower band → early bullish alert.
– Sell : Price first moves outside the upper band , then a candle closes back below upper band → early bearish alert.
• MACD → Momentum confirmer.
– Buy : MACD crossover above its signal line supports the bullish shift.
– Sell : MACD crossunder below its signal line supports the bearish shift.
• RSI → Final confirmation (filters traps).
– Buy : RSI crosses above its moving average, confirming bullish momentum.
– Sell : RSI crosses below its moving average, confirming bearish momentum.
✅ Only when BB + MACD + RSI all align in the same direction is the signal confirmed.
Notes:
- BB often reacts first (fastest, but prone to false starts).
- MACD provides mid-reaction confirmation.
- RSI lags but acts as the strongest filter against false trades.
Notes: Sometimes BB reacts immediately; MACD/RSI can prevent traps. At times BB+MACD demand a trade but RSI rejects (good filter); other times RSI demands but BB+MACD filter it.
___________________________________________________________
📌 How to Use
🔴 Sell Signal
1) BB: Price first extends outside upper band in an up-move, then a candle closes back under the upper band → BB sell signal.
2) MACD: Crossunder of MACD line below signal line.
3) RSI: RSI crosses below its moving average → final confirmation.
✅ All three aligned = Valid Sell.
🟢 Buy Signal
1) BB: Price first extends outside lower band in a down-move, then a candle closes back above the lower band → BB buy signal.
2) MACD: Crossover of MACD line above signal line.
3) RSI: RSI crosses above its moving average → final confirmation.
✅ All three aligned = Valid Buy.
___________________________________________________________
🎯 Trading Plan
• Entry → Only when all three confirm in the same direction.
• Stop Loss → - Stop-Loss → Near the structure swing that formed when BB first detected the signal (e.g., recent swing high for shorts / swing low for longs).
• Target → At least 1R ; scale/exit remainder using ATR, Fibonacci levels, or box trailing to ride trend.
___________________________________________________________
📊 Chart Explanation
Symbol/TF: BANKNIFTY · 1H
1) 20 Aug · 10:15 — SELL
• BB detected first, MACD mid-reaction (after ~2 candles), RSI confirmed last → Entry @ 55,676.30
• Target @ 55,387.05
• Stop-loss @ 55,965.55
• 🎯 Target hit on 22 Aug · 09:15 .
• Remaining lots can be trailed using ATR , Fibonacci levels , or Box Trailing to ride the extended trend
2) 29 Aug · 10:15 — FILTERED SELL
• BB and MACD demanded sell, but RSI did not confirm → No trade; RSI saved a false signal.
• 🦋 “The aqua dots represent false signals. At times, BB detects early entries but RSI and MACD do not confirm. Sometimes BB and MACD align, but RSI rejects the move. Other times BB and RSI confirm, yet MACD signals false. ✅ Only when all three align together is the signal valid.”
3) 01 Sep · 13:12 — BUY
• All three aligned long
• Entry @ 53,917.05
• Target @ 54,121.50
• Stop-loss @ 53,712.60
• 🎯 Target hit.
• Remaining lots can be trailed using ATR , Fibonacci levels , or Box Trailing to ride the extended trend
👉🏼 “A Sell setup looked promising today, but MACD did not confirm the trend ❌. With BB, RSI, and MACD now nearing alignment, the next reversal opportunity will be valid only when all three confirm together ✅.”
___________________________________________________________
👀 Observation
• BB provides the earliest cue; MACD validates momentum shift; RSI filters late-stage traps.
• Most reliable signals occur near key structure (support/resistance) with confluence.
• Not all alignments are equal—strength improves with decisive closes and supportive volume.
___________________________________________________________
❗ Why It Matters?
•A rule-based, three-step confirmation reduces noise and emotions.
•It clarifies when to enter , when to skip , and how to manage risk consistently across changing market conditions.
___________________________________________________________
🎯 Conclusion
BB → detect , MACD → follow , RSI → confirm .
When all three align, entries are clearer and risk is defined.
🔥 Patterns don’t predict. Rules protect. 🚀
___________________________________________________________
⚠️ Disclaimer
📘 For educational purposes only.
🙅 Not SEBI registered.
❌ Not a buy/sell recommendation.
🧠 Purely a learning resource.
📊 Not Financial Advice.
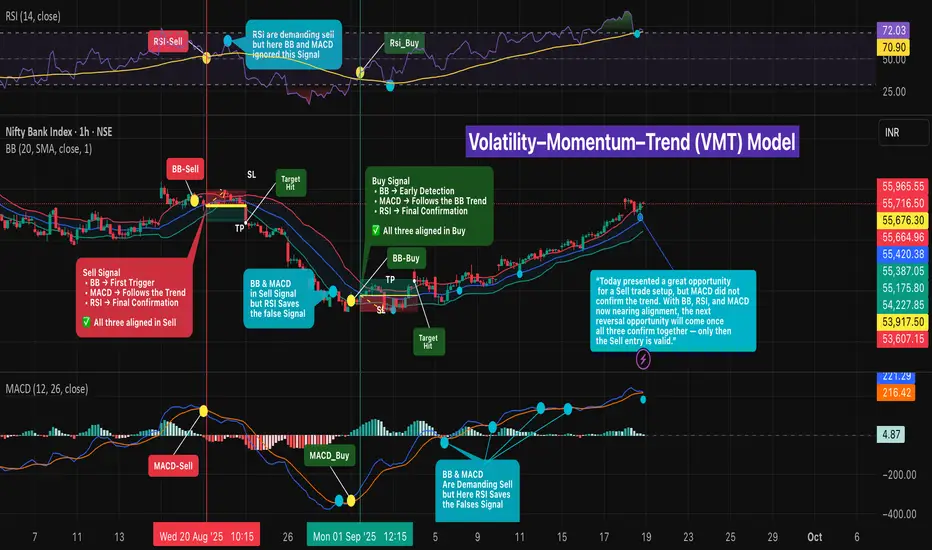
Heikin Ashi with Bollinger Bands – Rule-Based Reversal Strategy🔹 Intro / Overview
The Bollinger Bands are one of the most widely used indicators for identifying overbought and oversold market conditions.
They consist of an upper band, middle band (SMA), and lower band that expand and contract based on volatility.
In this setup, we focus on Bullish and Bearish signals generated when price closes outside the bands.
Heikin Ashi Chart In this idea Apply Boolinger band on Heikinashi chart to capture reversal signals.Heikin Ashi candles help reduce market noise, providing smoother price action and clearer trend signals.
When combined with Bollinger Bands, they offer disciplined entries, defined stop losses, and structured target management.
---
📖 How to Use
🔴 Bearish Signal - Appears after a uptrend
- Trigger → Candle closes above the Upper Band. (Signal candle)
- Candle High = Devalidation line.
- Candle Low = Validation line.
- Entry Confirmed → When price closes below the validation line.
- ❌ No Entry → If price moves above the devalidation line before validation.
🟢 Bullish Signal - Appears after a downtrend
- Trigger → Candle closes below the Lower Band. (Signal candle)
- Candle High = Validation line.
- Candle Low = Devalidation line.
- Entry Confirmed → When price closes above the validation line.
- ❌ No Entry → If price moves below the devalidation line before validation.
- 👉🏼 RESET → if Another New Trigger Comes Before Validation-Devalidation, the system RESET Validation and devalidation line to new values.
---
🎯 Trading Plan
- Entry → On validation close (Bearish: below signal Candle Low, Bullish: signal Candle above High).
- Stop Loss (SL) → Signal candle low for Bullish, signal candle high for Bearish.
- Target → 1R (equal to risk: Entry–SL distance).
- Remaining Lots → Trail with ATR, Fibonacci, Box Trailing, or structure-based stops for extended moves.
---
📊 Chart Explanation
1️⃣ 🛑Bearish Signal →
- Candle validated as price closed below the validation line .
- 🎯 Target 1 achieved, remaining lots managed with trailing methods. Exit may occur at swing bottom with best trailing method.
2️⃣ 🟢 Bullish Signal →
- ❌ Candle Devalidated as price closed below the devalidation line . . no Entry
3️⃣ 🟢Bullish Signal →
- ❌ Candle Devalidated as price closed below the devalidation line . . no Entry
4️⃣ 🟢Bullish Signal →
- ❌ Candle Devalidated as price closed below the devalidation line . . no Entry
5️⃣ 🟢Bullish Signal →
- Candle validated as price closed above the validation line
- 🎯 Target 1 achieved, remaining lots managed with trailing methods. Exit may occur at swing top with best trailing method.
6️⃣ 🛑Bearish Signal →
- Candle validated as price closed below the validation line .
-Still active during trading hours, monitoring continues.
---
👀 Observation
- Bearish signals are more effective during strong uptrends when volatility peaks.
- Bullish signals work best at market bottoms or oversold conditions.
- Early invalidations prevent false entries.
- Trailing stops allow scaling out while capturing bigger moves.
---
❗ Why It Matters?
- Provides rule-based trading using Bollinger Bands, not just blind signals.
- Validation & devalidation ensure disciplined entries.
- Helps traders avoid chasing moves by waiting for confirmation.
- Enhances risk management with clear SL & trailing systems.
---
🎯 Conclusion
The Bollinger Band Strategy offers structured bullish & bearish setups.
By combining validation lines, devalidation rules, and trailing systems, traders can capture high-probability trades while avoiding false signals.
🔥 Patterns don’t predict. Rules protect. 🚀
⚠️ Disclaimer
📘 For educational purposes only · 🙅 Not SEBI registered · ❌ Not a buy/sell recommendation · 🧠 Purely a learning resource · ❌ Not financial advice.
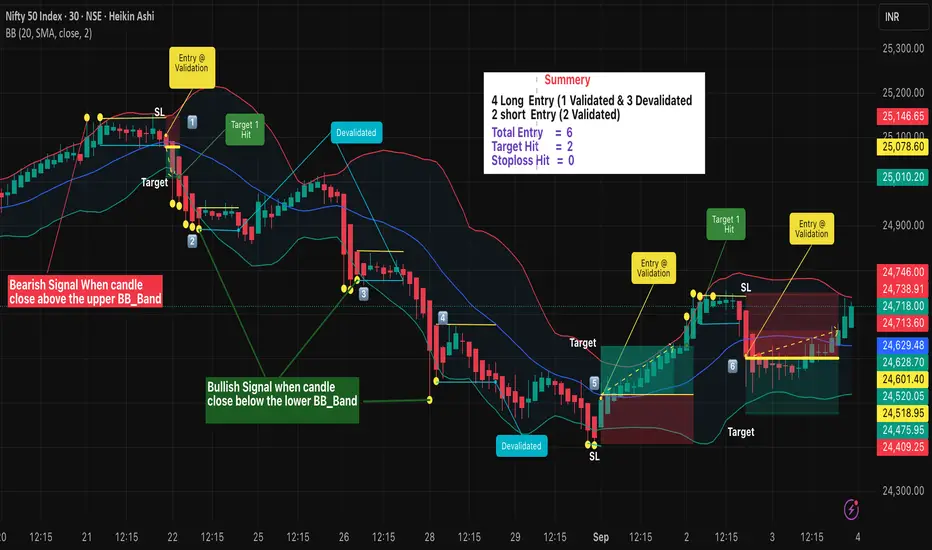
Death Crossover Strategy Explained with 50-EMA & 200-EMA line.Hello Traders! In today's post, we’ll explore the Death Crossover Strategy , a highly effective technique used by traders to identify potential trend reversals. This strategy involves the 50-EMA (Exponential Moving Average) crossing below the 200-EMA , which is considered a bearish signal.
In this chart of IndusInd Bank Ltd., we can clearly see the Death Crossover in action. The 50-EMA (green line) has crossed below the 200-EMA (red line), signaling a potential downtrend.
Key Insights:
Death Crossover : Occurs when the short-term moving average ( 50-EMA ) crosses below the long-term moving average ( 200-EMA ), suggesting the beginning of a downtrend.
Volume Confirmation : A sudden increase in volume after the crossover confirms the strength of the signal. In this case, the volume spike at the crossover indicates a strong bearish momentum.
Target Areas : After a Death Crossover , look for potential support levels to target as the price moves lower. In the chart, we can see how the price retraced and then continued its downward journey.
Price Action Post-Crossover:
In this example, the stock dropped by approximately -38.12% after the Death Crossover , highlighting how powerful this signal can be in catching major trend reversals.
Risk Management :
Stop Loss : To protect your capital, always use a stop-loss order just above the 50-EMA (green line) when entering a short trade after the crossover.
Position Sizing : Keep your position sizes small in trending markets to manage risk and ensure a favorable risk-to-reward ratio.
Note: We have used this chart just for teaching the strategy and its potential impact.
This is a great strategy to catch long-term downtrends, but as always, remember to use it alongside other technical indicators and fundamental analysis to increase your chances of success.
Happy Trading!

Options Trading Strategies on Budget Day 2025A Comprehensive Guide on Nifty, Niftybank, and Sensex Options
Introduction
Trading options on Union Budget day can be an exhilarating yet challenging endeavour. The Indian stock market sees significant volatility on this day, influenced by the budget announcements made by the Finance Minister. This guide will provide insights into trading options on the three major indices in the Indian markets: Nifty, Nifty Bank, and Sensex. We will also analyse the past data of these indices on budget days and examine how India VIX have fluctuated during these days. Based on this data we will deploy 4 delta neutral strategies and see how these strategies have performed on the budget days for all the 3 indices. The basic idea of this study is to find out the optimal strategy that can be deployed on budget day. Also please note since Sensex is a new instrument for weekly options data for the strategies is only available for 2024
Understanding the Major Indices
• Nifty: The Nifty 50 index, representing 50 of the largest companies listed on the National Stock Exchange (NSE).
• Niftybank: The Nifty Bank index, comprising the most liquid and large capitalized Indian banking stocks.
• Sensex: The Sensex or BSE 30 index, representing 30 of the largest and most actively traded stocks on the Bombay Stock Exchange (BSE).
Historical Performance on Union Budget Days
To make informed trading decisions, it is essential to analyse how these indices have performed on budget days over the past decade. The following tables provide detailed data on the indices' performance, including values for Open, High, Low, Close, and percentage changes from Open to Close and High to Low. Additionally, the tables include India VIX movement throughout the day.
Analysing Implied Volatility and India VIX
On Union Budget day, implied volatility and the India VIX are crucial indicators to watch. Typically, an IV crush occurs post the Finance Minister's speech, leading to a significant drop in volatility. This section will explore these trends based on historical data and provide insights into how traders can capitalize on these movements.
PS: The IV considered here will be the ATM Straddle IV
Options Trading Strategies
Although multiple options strategies can be deployed on budget day we are going to consider deploying a Directional and a Non-Directional Straddle with protective hedges. We will compare the strategies to see which strategy has given the best back testing performance and we will compare the performance of these strategies for all indices Nifty, Bank Nifty and Sensex.
Short Straddles using Wait & Trade
A conventional short straddle involves selling an ATM call and an ATM put option. However instead of entering both the legs at once we are going to perform a wait and trade directional straddle. This means that we will enter the call leg or the put leg only when the premium falls below 5%. We will take the reference time of entry as 9:20 am and exit time for the strategy will be 3:25 pm. We will check the reference price of both the calls and put options at 9:20 am for the ATM Straddle strike price. Let us say the Nifty on budget day is trading at 22500 then we will check the premium of the 22500 CE and 22500 PE and note down these prices. Let us say both are trading close Rs 100 each then we will enter only when the price of those options goes below Rs 95 implying that there is some direction in the market. So we will enter only that leg and avoid executing the other leg. If the market takes a direction we are bound to profit from the leg that has been executed. If the market moves up first and then down then it is likely that both the legs will get executed. The stop loss on the individual legs will be 70% each. One can execute this simple strategy via an algo execution platform.
Pros: This strategy profits from the decrease in implied volatility and can be profitable if the market remains sideways or directional.
Cons: This strategy will tend to loose money in a V-shape or U-shape market since there is a possibility of both stop losses triggering.
Iron Butterfly
An Iron Butterfly strategy involves selling an ATM straddle and buying protective wings (an OTM call and an OTM put) to limit risk. The offset units will be purely selected on the basis of the breakeven points of the straddle to keep it simple. This strategy is limited risk limited reward strategy. We will execute this strategy on all indices at 9:20 am and exit at 3:25 pm on all budget days.
Pros: On budget days the usual tendency of the market is to make some extreme movements but tend to close flat or closer to the open. If on the budget day the market tends to behave in this manner then the strategy turns out to be a high profitable strategy.
Cons: On budget day if the market becomes extremely directional then this strategy will end in a limited loss
Back tested Results
The back tested performance of short straddles and Iron Butterfly on Nifty, Nifty Bank, and Sensex indices are summarized in the following tables. These tables will help traders understand the potential profitability and risks associated with each strategy. For some strategies there is lack of back tested data available, so it is denoted as NA in the column of the strategy name
Note: All the strategies deployed as a part of this exercise are time based straddles. To optimize the performance of these strategies one can look at ATM straddle charts and can add some technical indicators such as super trend, vwap or moving averages to plan precision entries and exits for these strategies. The usage of these will definitely help increase the probability of the trade.
Please find the link below for your reference with all the data
Historical Data Indices.xlsx
The software used for backtesting the strategies in StockMock.
Conclusion
Budget week brings volatility; traders should employ delta neutral strategies to benefit from price fluctuations and implied volatility changes
Some of the key highlights of all budget days:
1. Budget week is highly volatile, with significant price movements expected.
2. Historical analysis shows an average 2-2.5% movement from high to low on budget days.
3. Implied volatility typically decreases around 11 AM on budget day.
4. Delta neutral strategies are recommended for traders lacking directional clarity.
5. Various strategies like straddles, strangles, and iron condors can be employed.
6. One should use algo platforms to automate executions since markets will tend to move very fast and in such situations, execution becomes extremely critical
7. Also do your own study by backtesting, forward testing and only then deploy your strategy in the live market
Hope you found the above article useful in helping you to prepare yourself in advance for Budget Day. All the best!

Dual Bollinger Band Jackpot Strategy.This is a strategy for Swing Traders who just want to capture the swing and don't want to hold the stock for months. This strategy requires 3 indicators:-
Bollinger band (20,2) and Bollinger band (20,1)
Volume
MACD
Trade Setup for Long:-
1] The candle which closes above UB 2, we will call it BREAKOUT CANDLE.
The BREAKOUT CANDLE should have following properties;
a) The volume of this candle should be greater than previous TWO CANDLE's volume.
b) MACD histogram and MACD line should be greater than zero.
2] There should be minimum TWO CANDLES just before the BREAKOUT CANDLE which closed
between UB 2 and BASIS. Those TWO CANDLES should consists of atleast one RED CANDLE.
And that RED CANDLE should not touch the BASIS.
TIMEFRAME:- DAILY CHART.
When all of the above requirements is fullfilled we can BUY above the high of BREAKOUT CANDLE.
STOPLOSS is 1 point below the low of BREAKOUT CANDLE.
TARGET is 2 times the STOPLOSS.
DISCLAMER:- this is for educational purposes only.
DON'T apply this startegy directly with real money. First do paper trade and see the results and analyse the profitability of this strategy.

What are Bollinger Bands and How to Use themBollinger Bands are a widely used technical analysis tool traders rely on to gauge market volatility and identify potential entry and exit points. Developed by John Bollinger in the 1980s, they provide a simple yet effective method to analyze price trends and determine potential movements.
In this post, we'll cover the fundamental concepts of Bollinger Bands, including how they work and how you can use them to your advantage . This post will also lay the groundwork for future posts about more advanced topics on Bollinger Bands.
Please remember this is an educational post to help all of our members better understand concepts used in trading or investing. This in no way promotes a particular style of trading!
What are Bollinger Bands?
Bollinger Bands are composed of three lines that are plotted on a price chart. The first line is a simple moving average (also known as the basis line), and the other two lines are standard deviation lines, one located above the SMA and the other below it.
When plotted, the SMA appears at the centre of the chart, flanked by the upper and lower bands. The width of the bands is determined by market volatility; the bands will expand as volatility increases and contract as volatility decreases
Components of Bollinger Bands
Basis line: The basis line is the middle line in the Bollinger Bands and represents the simple moving average (SMA) of the closing prices of an asset over a defined period.
Upper Band: The upper band is calculated by adding a specified number of standard deviations to the SMA. Typically, traders use two standard deviations from the SMA, making it the most common setting used. However, these settings are not universal and vary as per the trading style.
Lower Band: The lower band is calculated by subtracting the same number of standard deviations from the SMA. This results in a channel of three lines, with the upper and lower bands fluctuating around the SMA, reflecting volatility.
Usage:
👉 Overbought and Oversold Conditions
Bollinger Bands can help in the identification of overbought and oversold conditions. Generally, when the price of an asset touches or exceeds the upper band, it may suggest that the asset is overbought, and a pullback or reversal could be on the horizon.
In contrast, when the price touches or falls below the lower band, it may indicate that the asset is oversold and could be due for a bounce or reversal.
However, it's worth noting that in strong trends, the price may remain at the upper or lower band for an extended period. This occurrence is not a signal for a pullback or reversal, and traders should consider other factors to confirm the actual trend.
Exhibit: Strong Uptrend
Exhibit: Strong Downtrend
👉 Volatility Indicator
Bollinger Bands serve as a measure of volatility. As the bands widen, it indicates that the volatility is increasing, which means that price swings are likely to be more significant. Conversely, when the bands become narrower, it suggests that the volatility is decreasing, which could result in smaller price fluctuations.
👉 Bollinger Band Squeeze
A squeeze occurs when the bands contract and move closer together, indicating decreased market volatility. This phenomenon is often a precursor to a significant price movement or breakout, as periods of low volatility often precede periods of high volatility in the market.
👉 Trend Confirmation
Bollinger Bands can also be used to confirm the direction of a trend. During an uptrend, prices often stay within the upper half of the Bollinger Bands, while in a downtrend, prices tend to remain in the lower half of the bands.
In addition, when prices repeatedly bounce off the basis line or keep getting rejected from it, it could indicate the continuation of a trend.
Exhibit: Trend continuation in a Bullish trend
Exhibit: Trend continuation in a Bearish trend
Thanks for reading! Hope this was helpful.
As we mentioned before, this isn't trading advice, but rather information about a tool that many traders use.
See you all next week. 🙂
– Team TradingView
Be sure to follow us on Twitter , Instagram , and Telegram for more valuable content! 💘

Bollinger Bands - Failed Breakout TradeThis material is only for educational purposes and knowledge sharing, and shows a past trade. Learn concepts, do not copy trades.


Comparison between NSE Broader MarketsComparison between Nifty 50, Nifty Mid Cap 50, Nifty Small Cap 50, Nifty 500, Bank Nifty after it made a bottom on 24th March as we can see Small Cap clearly outperforming Benchmark Index and Bank Nifty underperforming the overall broader market.

