Silver at a major resistanceSilver has reached a major resistance level. A breakout above this will see more rally. It will be very interesting to see what happens from here. Big Macro development if a breakout happens. The metal will continue to shine if it breaks out, otherwise it is a top and correction will follow.
#silver#commodities

#Silver up for another short sell move?Silver is currently completing the 4th wave and may witness a down move in the short term. Keeping my eyes glued. :)
**This is an educational market outlook, not investment advice. Please consult a SEBI-registered advisor before taking any investment decisions.**
Silver Form H&S pattern.Silver form H&S pattern with neckline 88222. if sustain below this level it may test 79777 and 75075.

Silver; H&S pattern indicating a fallSilver chart is having a head and shoulder pattern copy book pattern which is indicating further fall of 10-12k, only for education purpose, do you own research

SilverSilver has been in wide sideways range since past 3 year. Any retracement from here towards the horizontal zone lines could be final retracement before taking out the upper edge of the rectangle and give clear breakout. Next 2 year may be good be bulls.

XAGUSD / Silver Swing long Setup Silver is currently trading in a Mid Range
- On a 4HTF Silver looks bullish
- I will look to scout for longs more here cause I believe a leap can be seen easily

DXY BEARISH REVERSALTVC:DXY Finally confirms it's Bearish Reversal
By Breaking down the prolong Uptrend. Now we can expect long term downtrend in DOLLAR to Resume.
It's Highly Bullish for Stocks, Commodities, Precious Metals, Paired Currencies and Cryptocurrencies.

SILVER VIEW silver is sell on rise as there is no change in the fundamentals yet so break above the given resistance line is not seen in near future so we continue to drop in the downward channel also it depends on the behaviour of dollar index and cpi data of usa so upcoming Data can be used as a trigger for change in the fundamentals and can help silver to get above the resistance and shine again Till the time we are experiencing low industrial demand.

I THINK GOLD HAS SOMETHING INTERESTING GOING ONTVC:GOLD
GOLD is making a classic entry for a good upside
I have drawn the whole perspective I think is the best possibility right now
I am buying gold with the SL of breaking the trendline drawn on the bottom which I think it will retest once
plz trade according to your knowledge and understanding, don't follow anyone blindly

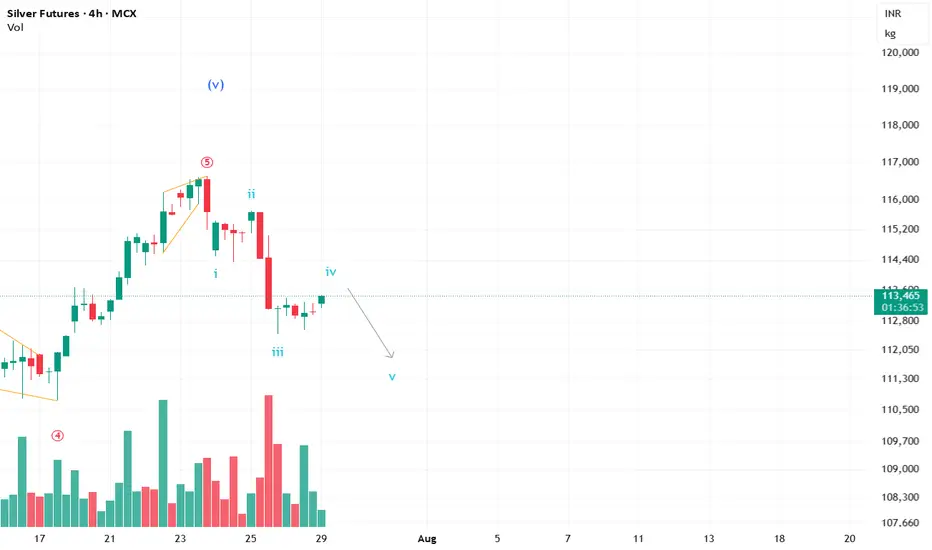
SILVER CRITICAL UPDATE As updated in the charts we still expect a little upside movement in silver for completing its 4th leg before moving towards its final showdown or the last leg (wave 5).
It’s not the right time to trade anyways in silver . We still wait for a perfect entry .
Thank you so much .

Silver refreshes three-month low, bears eye sub-$22.00On Friday, silver prices closed at the lowest levels last seen during early February while portraying a seven-day downtrend. Not only that, but the bright metal also ended up breaking the key support line stretched from mid-December 2021. The south-run, hence, gets validation to challenge a four-month-old horizontal area surrounding $21.90. However, oversold RSI may test the bears around 78.6% Fibonacci retracement (Fibo.) of December 2021 to March 2022 upside, near $22.60-55. Should the quote remains weak past-$21.90, the downside move won’t hesitate to challenge the late 2021 bottom of $21.40.
Meanwhile, the corrective pullback will initially aim for the 61.8% Fibo level close to $23.50. Following that, the 200-DMA and the 100-DMA can question the optimists near $23.80 and $23.90 respectively. Also acting as an upside hurdle is March’s low near $24.00 and January’s high near $24.70.
Hence, silver bears have control until prices rally beyond $24.70. Though, there’s a bumpy road to the downside.

SilverDue to the uncertainty in the stock market, Gold and Silver raised to a greater extent.
If you are looking for shorting opportunity, then we have to wait for perfect time in which the market reverses.
This chart will gives you support and resistance for both long and short term.
Disclaimer :
Analysis are purely for educational purpose. Do not take any trade based on this. It is very important to do your own analysis before making any investment.

Silver ( XAGUSD )Silver is side ways expecting movement in coming 2 month by breakout from current resistance line .


Silver Gonna crash?One can see in the charts that all levels on daily and weekly timeframes are tested. The white trend line keeps on adjusting as we go while blue is intact, signs of distribution.
once it comes to confluence zone(intersection of 2 trend lines) , perfect short opportunity.
It is a positional trade so we have to be patient.
Targets
Passive- 56000
Aggressive - 51500


XAGUSD SHORT WE CAN GO FOR SHORT IN SIDE THE PATTERN WITH SMALL SL.
AS PER DOW Theory we have lower low now and pullback so short possibel

Technical Analysis: 100-DMA stops gold from being next silverAlthough an ascending trend line from March keeps challenging gold sellers, 100-day SMA raise bars for the bull’s entry. Considering the improvement in RSI conditions and upbeat MACD, gold is likely to follow silver’s jump to the highest since August. However, a clear break above the 100-day SMA level near $1,880 becomes necessary for the bulls. It’s worth mentioning that the run-up to August high near $2,075 will have a descending trend line from the mid-September, around $1,955, as the key hurdle to cross.
If at all the yellow metal remains below $1,878 immediate resistance, odds of its downside break to the key support line, at $1,835 now, regain market attention. Should that happen, which has fewer back-ups, the November low of $1,764 will return to the charts. In doing so, the $1,800 threshold can play as an intermediate halt during the fall whereas June 2020 low near $1,670 may lure gold bears afterward.

Silver retaces biggest gains in eight weeks above key supportsWith the market spiral full of talks over Gamestop-led fund diversion to silver weighing on risks, the white metal trims the previous day’s gains on Friday. The commodity rose the most since early December on Thursday while extending its bounce off 100-day SMA beyond 21-day SMA. The upside move also gained support from bullish MACD and upbeat RSI. Also supporting the silver buyers is the quote’s ability to keep the SMA breakout. As a result, silver is well-directed towards a falling trend line from August, around $27.60 while the monthly near $27.90 and September 2020 peak surrounding $28.90 adds to the upside filters.
On the contrary, a 21-day SMA level of $25.85 offers nearby support to the bullion before dragging it to the $25.00 threshold. However, 100-day SMA near $24.80 and an ascending support line from November 30, at $24.70 now, will become tough nuts to crack for the silver bears afterward. Overall, silver consolidates the upside momentum but the bulls can stay hopeful.

SilverCurrently Silver is within consolidation on Hourly Chart. It has taken support multiple times in the range of 15.450 to 15.550 which is very akin to 0.382 Fibo Retracement from the previous swing low. Till the time its holding onto that support, the chances of breakout above resistance zone increases and we might get a good long entry.

SILVER ready for 16.90Silver - should be positive abv 16.35 for a tgt at 16.90. Keep SL at 16.10 on longs
