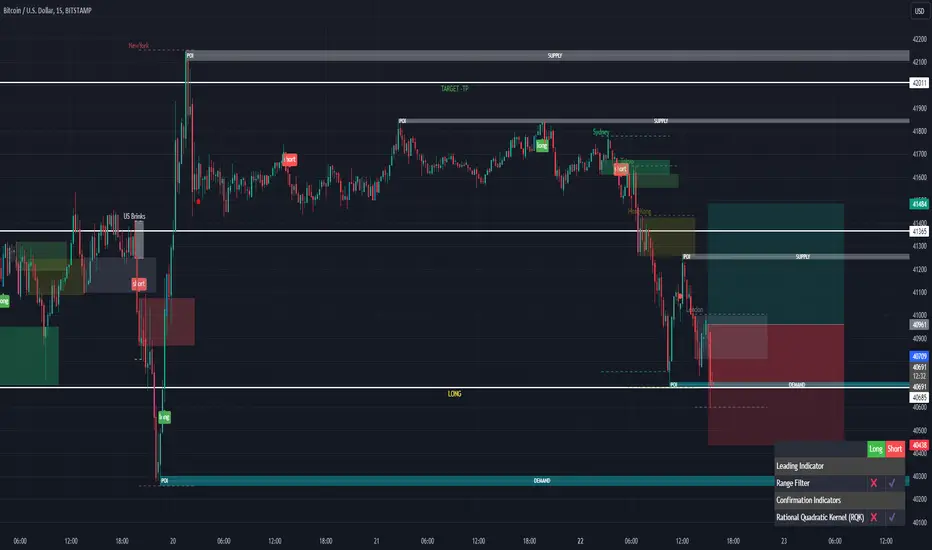
LONG ON BTC- from 40687, Due to accumulation of H&S PatternWe are looking to Buy BTC/USD from 40687 for a target of 44167 in a medium term range for a Leg Up Completion. Gold is also bearish, this will help market put more demand on Cryptos. Stops should be below 39500. Wish you a best of luck and happy Monday
1-BTCUSD
BTC future projection possibilities BTC makes correction everytime before halving so this must be one while making the perfect Head and shoulders which if goes as i planned the price would be close 150k per btc which is not that difficult if youo know.
#btc #crypto #analysis

BITCOIN CRASHI believe crypto is the future, but bitcoin give me chills. It's really showing a zero crash. This month is just a beginning of something huge. This changes my whole beliefs about the mother coin, I hope and wish that my analysis are wrong. Lets Download Success.

Woo networkAfter a good breakout restest in weekly time frame with such a bullish crypto market woo gonna blast soon

Before $300,000 - $500,000 Bitcoin Hits $20,000 to $11,300...It has come to my attention that some of the new readers and beginners are a bit confused... This is normal, do not worry...
I am here for you.
I reply to all comments and take care of everybody.
Those positive, those negative and those in between.
Now, to start, just keep in mind that it is normal to be confused if you are just getting started or haven't been around long enough.
What I do here is read charts, I share my opinion of what is going on with the charts.
Below you have everything in a nutshell.
Bitcoin LONG-TERM VIEW
We believe that Bitcoin will hit $300,000 to $500,00 within 3-5 years.
Before Bitcoin hits $300/$500K, it will hit a new low first around $20,000 to $11,300.
That's all, pretty simple.
Now, this is only our view and it can be right or wrong...
What happens if I am wrong?
Nothing really, life goes on.
What happens if I am right?
Nothing really, just no surprise.
This is just my view, you can easily share yours.
We have here on Trading View over 30,000,000 traders according to the statistics on the front page, I am just one (1) of those.
You can browse around, there will be many opinions...
Who will you trust?
Me, the trolls, other traders?
I say you trust yourself.
Do your own research.
Practice, study and only decide based on your results.
If you have doubts or still feel confused, just leave a comment and I will do my best to lend my support...
We focus on the Altcoins though.
Now, the low can happen in a few days or a few weeks or a few months....
We are not predicting the time, we are sharing our general long-term view.
Is this clear enough for you?
I really hope so...
Thanks again for your time and reading.
Remember that you can always leave a comment with your questions...
I am here for you.
Thanks a lot for the continued support.
Namaste.

Today BTC will be Bearish or Bullish After 42900 and 42600Today BTC will be Bearish or Bullish After 42900 and 42600 because see the chart market making a channel with taking so much time of weekend and it all work after when new year party will be end and trading volume is coming to btc so market so in a single direction.........#btc

Next entry Touching the 15m ob and enter after choch the stop loss fix the above the ob and exit the liquidity

STRONG BULLISH4H tomeframe showstrendline show bullish move after breakout and give min 1500 pts move

Trading setup for BTC for todayHii Guys here is the trading setups for today in bitcoun chart .
as per the support we can expect the up move again

$BTC Daily UpdateCRYPTOCAP:BTC #BTC Precisely predicted $43,145 support test, bearish engulfing on 1D and 4H from Sat played out as expected. Currently struggling to gain string support at $43,145. RSI on 4h and 1d looks fine. $43,868-$44,174 resistance area to watch for breakout, $42,070 next key support

ORDI USDT Swing Long Setup - ORDI is currently trying to build up a matured base on a 4h TF
- For refined and overly safe entries in SPOT keep your limit orders at 40-45$ 45-48$
- Let the base get matured first post that try entering after a solid confirmation
- Targets - 70$, 85$, 100$

Bitcoin/ Btc USDT Swing Long Setup - Bitcoin is currently trading at a crucial supply
- Bitcoin if this continues where we eq highs and higher lows we can soon expect a huge leap
- I still stick to my target of BTC mitigating 48k first post that we might see a retracement
- Support 40,800$-41,500$
- Resistance - 44,000-45,000$

ARK is good for buying ark long
entry 0.98-0.95 (Wait for buying)
tp
1
1.2
1.4
1.7
1.9
sl i will update

BTC trendDear friends, in general, the price trend of Bitcoin recently is still increasing.
Buy above 43550 and sell at 44200 . As it is following the trend. Plan accordingly

Bitcoin Swing Long ETF News - Bitcoin is currently trading in a crucial area
- It will be important to see how BTC reacts from this crucial overhead supply.
- ETF news can make the BTC price shoot up like anything

Ethereum (#Ethereum) tests its long-term trendline support When Ethereum (#Ethereum) tests its long-term trendline support, it often sparks a significant upward market movement, known as a bull rally.
#Pattern_Recognition: Ethereum (#Ethereum) has shown a recurring pattern where testing its long-term trendline support has resulted in substantial bull rallies.
#Historical_Timing: Notably, each of these support tests has historically occurred in the month of January.
#Projection_for_2024: If the historical trend continues, there's a possibility of witnessing a similar upward market movement or bull rally in January 2024, following the long-term trendline support test.

The Bitcoin Charts Of 2020 And 2023Crypto Analyst Reveals Uncanny Similarities In The Bitcoin Charts Of 2020 And 2023
A crypto analyst has revealed what seems to be one of the most uncanny similarities in two separate Bitcoin charts. The two charts taken from 2020 and 2023 show a very similar price trend, and the most important part is what happens if Bitcoin continues to follow this trend.
What Happens If This Trend Continues?
If the historical performance of Bitcoin back in 2020 is repeating itself once more, then it is very bullish for the price. This is because 2020 is actually the year the last bull run began. From December 2020, going into the year 2021, the Bitcoin price would rise continuously to beat its previous all-time high set in 2018.


Bitcoin Short Trade - 38-40k can be the magnet
- Stay cash let Btc retrace and then add alts
- Do not do FOMO buying, market is deleveraging late longs

ETHereumEth is booming after 2150 will it still be bullish?
With the breakout, it is now pushing itself for 2400
Meanwhile, it tested the 2400 and now it's making its way towards the lower support.
A smaller time frame showed the trend change but 1hr and 4hr is still bullish so this chance is to be of buy on dip .
As it has broken down the 0.23 of fib-retracement.
we need another confirmation for bearish which is trendline support. So re-entry would be at 0.5 and 0.6 lvl.
The first target would be 2350. once it breaks that level, we are surely moving towards 2400.
#eth #bitcoin #trendanalysis

SAND/USDT Swing Long Update - Sand so far has just started recovering it's lost price
- Sand has recovered 30% only remember it has more potential
- Sand has more potential to keep going up
- Hold Sand in your bags
- If you are looking to add sand in your bag for trading purpose then I would suggest waiting for a 20% retracement at least

AAVE USDT Swing Long Trade Setup - AAve is currently setting up for an impulsive move
- AAVE can blow up soon I believe some more consolidation is needed for that
- Hold AAVE in your bags
- DEFI driven run will pump this
- IMO AAVE is a long term gun

Movement to the downside!Bitcoin is expecting a major movement to the downside, target expecting to reach at 27,000$
