Bitcoin – Bullish Setup Forming After FVG Retest!Hello Traders!
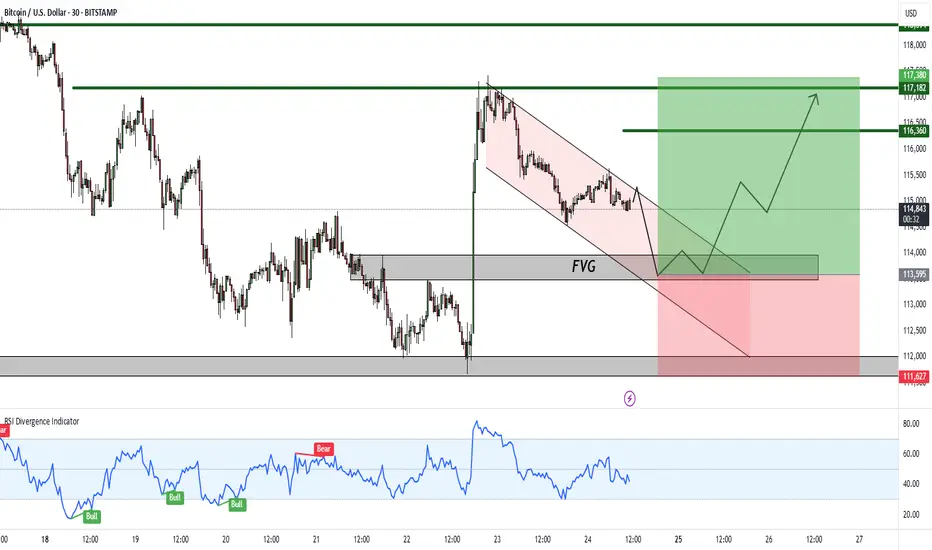
Bitcoin is currently showing signs of forming a bullish setup after rejecting lower levels. The price has created a clean FVG (Fair Value Gap) zone and is moving within a falling channel, suggesting a possible accumulation before the next leg up.
Key Observations:
FVG Support: Price is likely to retest the FVG zone before a strong upward move.
Falling Channel: The structure indicates potential breakout to the upside.
RSI Divergence: Momentum indicators are showing signs of strength, supporting a bullish reversal case.
Targets: The upside targets are marked at 116,360 – 117,380 – 118,394 levels.
Invalidation: A breakdown below 111,627 would negate this bullish setup.
Rahul’s Tip:
Always wait for confirmation around the FVG zone. Entering too early may expose you to false breakouts. Risk management is crucial, especially in volatile assets like Bitcoin.
Disclaimer:
This analysis is for educational purposes only and not financial advice. Please do your own research before making any trading decisions.
1-BTCUSD
BTC/USDT Technical Analysis – Key Levels & Trend Outlook📊 BTC/USDT Technical Analysis – Key Levels & Trend Outlook 🚀📉
🔹 Trend Structure
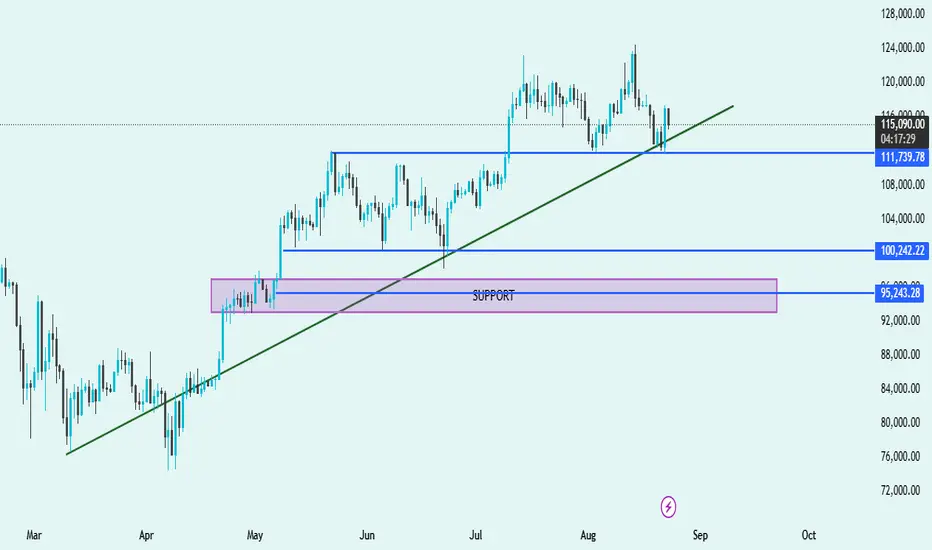
Price is currently trading above the trendline, suggesting bulls are still in control, but momentum has weakened.
🔹 Support Zones
Immediate Support: 🔵 $111,739
Price recently tested this level and bounced, showing demand from buyers.
Key Mid-Support: 🔵 $100,242
Strong historical level where buyers stepped in multiple times.
Major Demand Zone: 🟪 $95,243 – $96,500
Highlighted purple support box; this is a critical accumulation zone where bulls are likely to defend strongly.
🔹 Resistance Levels
Near-term resistance: Around $120,000 – $124,000 (recent swing highs).
A breakout above this zone could fuel a new bullish rally.
🔹 Market Outlook
✅ Bullish Bias as long as price respects the green trendline and stays above $111,739.
⚠️ If the price breaks below $111,739 and the trendline, expect a deeper pullback toward $100,242 or even the major demand zone $95,243.
🚀 A breakout above $120K will signal strong continuation to new highs.
📌 Summary:
Trend: Uptrend ✅
Key Supports: $111,739 → $100,242 → $95,243
Resistance: $120,000 – $124,000
Bias: Bullish above $111K, cautious below 🔻
"Bitcoin Eyes $100K Re-Entry: Retest, Support Zone, Then Push ?Chart Analysis
1. Price Structure & Trendlines
The chart displays a former upward trendline that has been broken, leading to a corrective pullback.
Following that, price is perched within a “retest zone” (the red-shaded rectangle), which aligns with both historical horizontal resistance—now turning into support—and an area of previous consolidation. This is a classic setup: price often retests key breakout levels before resuming its move.
2. Support Levels
The main support is clearly drawn around the $100K zone, highlighted by a grey bar below the retest zone. This is a psychological and structural area to watch for potential strong buying.
Immediate support appears near $110K–$112K, as noted by the lower edge of the red retest area—this zone has shown to catch corrections before in technical analysis and news reports
AInvest
Mudrex
Barron's
.
3. Resistance & Upside Targets
If the retest holds, the chart charts a potential bounce toward the upper rising trendline and beyond, potentially aiming for the $126K–$130K region, as marked by Fibonacci retracement levels.
This aligns with several external forecasts suggesting resistance or target zones in that range
AInvest
Mudrex
Barron's
.
4. Potential Price Path & Scenarios (Denoted by Red Arrows)
Bearish Scenario: Price may dip down into the retest zone, test support, and—if the breakdown occurs—continue lower toward $100K—a key area of interest.
Bullish Scenario: The support holds, leading to a V-shaped recovery that propels price back above $115K, potentially triggering a rally toward $122K–$130K.
Summary Table
Key Zone / Level Significance & Note
$110K–$112K Critical near-term support; breakdown risks move toward $100K
AInvest
Mudrex
Retest Zone (~$114K–$115K) Area combining horizontal support and trendline; serves as pivot for next move
Mudrex
AInvest
$120K–$123K Major resistance where a breakout could fuel continuation toward $127K–$130K
Mudrex
Barron's
Broader Context & Market Sentiment
Bitcoin is currently consolidating after setting new highs near $124K
MarketWatch
The Economic Times
Barron's
Cointribune
.
Analysts observe that sustaining above the $110K–$112K band is essential to the bullish case; falling below it could invite deeper downside
Barron's
Cointribune
AInvest
.
Conversely, a decisive move above $120K–$123K could validate continuation toward $127K–$130K, and even higher—some forecasts extend to $135K and beyond
Mudrex
Indiatimes
Barron's
CoinCodex
.
Final Thoughts
Your chart beautifully illustrates the classic “retest after breakout” dynamic:
Hold above the retest zone? Look for a rebound toward $120K+, with the potential for a full bullish revival aiming for $130K.
Break below $110K–$112K? Watch for a possible move toward $100K—a critical support level.
Stay alert to macro catalysts too—like Federal Reserve interest rate signals, institutional inflows (ETFs), and regulatory developments—which could steer the next leg substantially

Bitcoin Trend – Breakout from the Downward ChannelBitcoin Trend – Breakout from the Downward Channel
Hello traders,
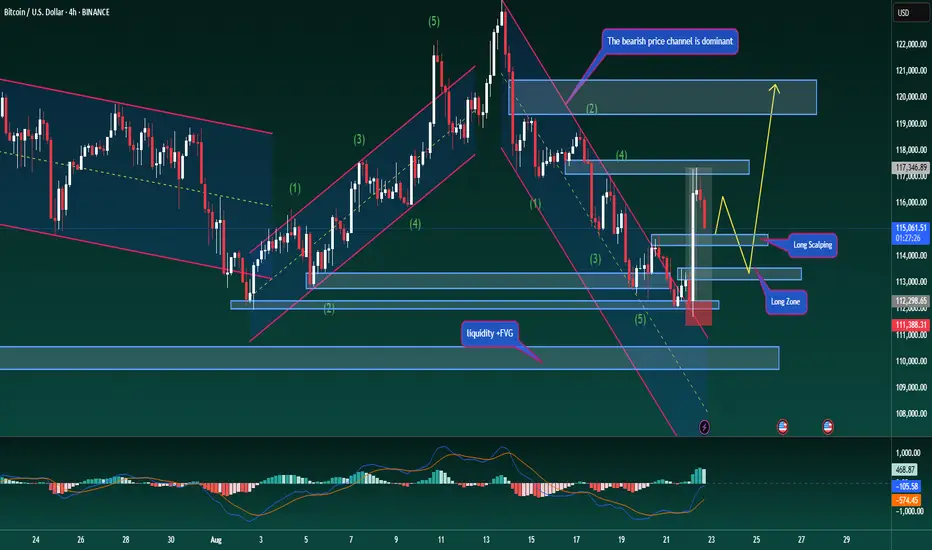
BTC has broken out of its descending channel with a very strong candle, moving exactly as expected in the corrective rally. At present, price is reacting around 117k, which confirms a shift in structure. For the medium term, the primary trend should now be considered bullish. Traders can look for pullbacks around 114.5k – 113k to add fresh long positions.
From an Elliott Wave perspective, BTC is moving within the final ABC structure. The current move is wave B, and we will be looking to position long once wave C completes.
Target for this long scenario: 120k – 121k, where a mild correction may occur as liquidity is taken.
This is my personal outlook on Bitcoin. Always follow price closely and manage your account carefully to stay safe.
What’s your view on BTC’s breakout? Share your thoughts in the comments so we can trade better together.
Buy BTC for 10K up move - Price Action confirmationLast few days multiple false news were spread in middle of correction.
Deliberate sell off by big players to trap the retailers etc etc
joined with US FOMC meetings etc only played down side which is
not technical.
I predict price tracing back to 124K asap.
Bitcoin is Digital Gold. At the same time keep long qty with liquidation level as
low as 105 or 100 or 95 K so no one can liquidate you....
Keep Booking profits and re enter at every dip.... rock it my friends

Bitcoin is Bullish or Bearish - 20th Aug 2025First, In my previous charts mentioned take long with money management. I didnt expect this much of fall and i had to cut my longs to hold the rest. Technically no answer for this fall since its mad short selling and group games or big players selling to get liquidity before they buy. They are buying at every dips in very large qty. Exchanges buy sell as well to kill and eat others
Price is at previous tested proved support. Any analyst can only suggest buy this dip and to be 100% security allow price to test the support again and then buy based on reaction. Support and Resistance are tested and will hold or breakout as well right. In my view for Bitcoin every previous proved support should not break since whales buy and rise the price. Not sure who is that whales selling causing support to break. In news I didnt see or knowing how is that big player sold causing price to drop this much. Stay Safe, I am doing my best or suggesting what I am also doing. God Bless Bitcoin traders.

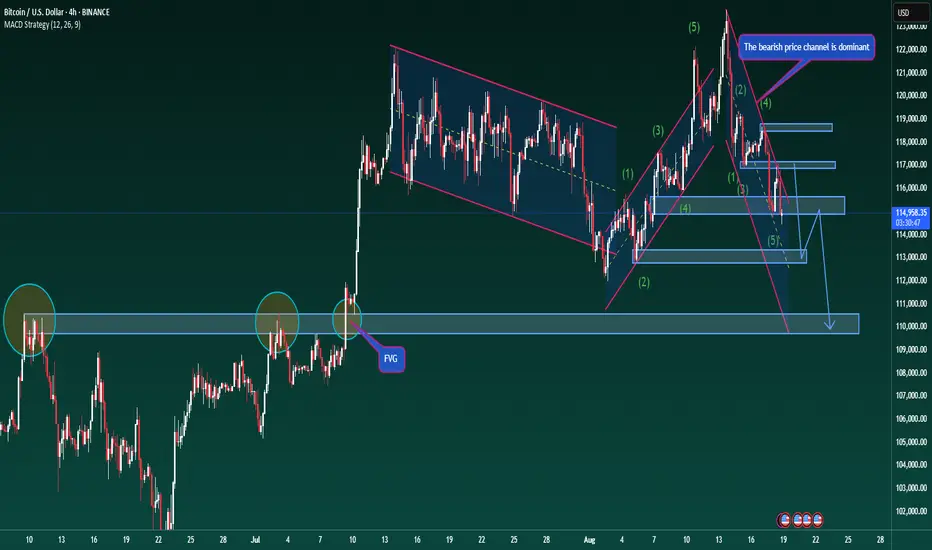
Bitcoin – Updated Trading ScenarioBitcoin – Updated Trading Scenario
BTC followed the expected move by testing the 117,000 zone before turning lower, but it did not align with the anticipated ABC correction under Elliott Wave. At present, price is showing signs of slipping below the 114,700 support, suggesting that the corrective phase may not have ended at the previous wave 5 low.
Based on Dow Theory, the ongoing decline could extend towards the 113,000 area before the market sees a stronger rebound. A descending channel has now formed, and price is reacting well to the upper trendlines, reflecting that short-side pressure remains dominant.
In this context, prioritising short positions in line with the prevailing downtrend may improve the probability of success. The next major target lies near 110,000, where strong resistance clusters from higher timeframes converge.
For short-term traders, it is possible to take advantage of pullbacks towards the channel trendlines to look for quick entries following the main direction. Risk management is key here, and traders should avoid rushing into longs while the corrective leg is still in play.
A downtrend often lasts longer than expected, but once selling pressure fades, the recovery phase can be sharp. Patience and discipline are essential to capture the right opportunity rather than fighting against the flow.
#BTCUSD #Bitcoin #CryptoAnalysis #TechnicalAnalysis #PriceAction #ElliottWave #MACD #CryptoTrading #ForexIndia
BTC - 18th Aug Before US Open - Dump & Pump or Dump ?History was repeating exactly till half of 5th wave but market considered new ATH as possible profit booking and sold off instead of going in to parabolic up move. The exact place where it has to start the parabolic up move it got dumped. Either its due to CME close and few market players doing false move or its sure dump or lack of buying at these high price or ETH got importance instead of BTC. In this cycle ETH, SOL and XRP and few mother crypto pulling the liquidity and BTC missing those money. Need to wait and watch today and this week. Right now price is still at swing low from where it can move to new ATH to 127 and 130K.

BTC - TP 130K - History repeating with more bullish trendIn my previous chart I clearly said we are going to see 3rd wave as per history pattern seems to be repeating as per ABC pattern worked exactly. In chart clearly shown 3rd wave, 4th wave and one top followed by accumulation (right now happening) after 3rd wave and before parabolic 5th wave exactly happenings. From ABC to 4th wave its exact price move repeating and I wish and expecting the 5th wave in parabolic move and reach the FIB extension shown in chart for 130K logic. since its more bullish may be TP may be higher than 130K as well. Right now price is in accumulation phase after one top followed by wave3 top.
Do not lose your 50 to 60% BTC qty in any false moves. And do not take 100% long qty as well
Maintain Money Managment strictly.
Factors Supporting Crypto - mainly BTC and ETH
1) Fiat money printing causing $ index and US dollar weak
2) Strong US data, Euro zone data and no recession in any country now
3) All trade tax with Europe and China and most of the countries are good
4) Pension money flow in crypto in US + new adoption by corporates one after another
5) New IPO focusing on BTC and nonstop ETFs fund flow as usual

BTC - 17th Aug Asia Night view - Bullish TP1 -120700Explained my view in chart text it self. Its Bullish and expecting 120700 and 121600 minimum first to see if any resistance ome or not... not point is selling now and just need to be 50 to 60% capacity long in BTC now

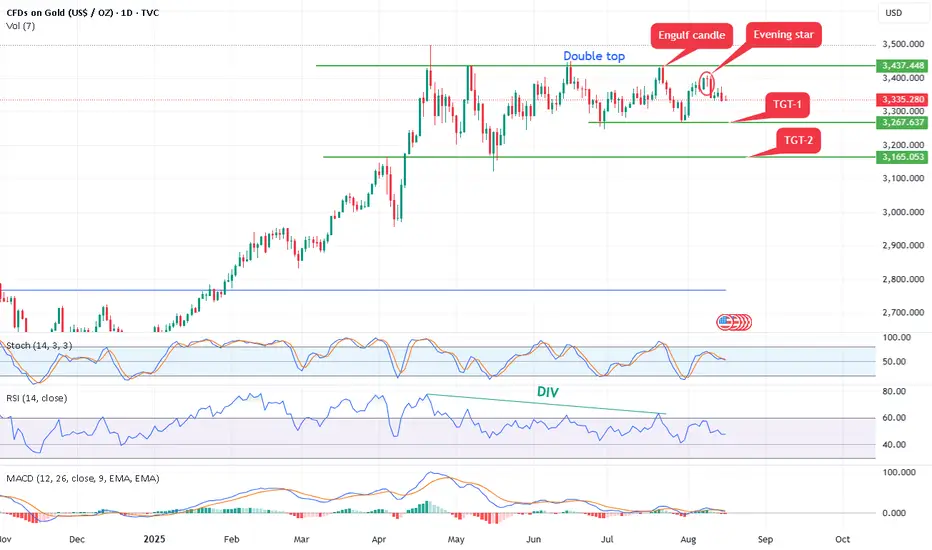
Gold form double top bearish pattern,Bearish Patterns Annotated:
Double Top: A classic bearish reversal pattern resembling an "M" shape. It occurs when price hits resistance twice at similar levels (here, approximately $3,437 and $3,448 in July and August) and fails to break higher. This signals potential exhaustion of buyers and a shift to sellers.
Evening Star: A three-candle bearish reversal pattern marked near the recent high. It typically consists of a large green candle (up day), followed by a small-bodied candle (indecision), and then a large red candle closing below the midpoint of the first candle. This suggests bulls are losing control.
Engulf Candle (Bearish Engulfing): A red candle that completely "engulfs" the body of the prior green candle, indicating strong selling pressure overriding previous buying. It's marked near the top, reinforcing the reversal theme.
Opportunity: - As per chart it can short 3380-3350 with stop loss 3400 above for the targets of double bottom pattern 3260 and 3160.
BTC - 17th Aug - Buy @ 117K during re test of supportBitcoin reacts and respects Fib levels and as expected seen taking support at very crucial and stronger support area around 117 K. Its a confluence of support area. 1) 10th Aug Strategy bought BTC at this area, 2) resistance line broken area converting to support. 3) FIB golden line area. Price is coming for re test of the support and expecting very good buying interest today 17th Aug. Its a must buy time in Bitcoin today. Buy with all required Money Management.
Last few days ETFs funds inflow only seen so many people are accumulating only,

BTCUSD-Eyes on Bullish PullbackPrice action formed a clean pullback into prior support after an earlier rally.
Multiple Buy signals have appeared at the lows, with the latest near a previous Liquidity Control Box.
The yellow caution label triggered near the top earlier, signaling possible short-term exhaustion — now invalidated as price re-approaches structure.
🔍 Trade Structure (Educational Reference):
Observed Entry Zone: Near 117,840 after reclaiming short-term EMA
Stop Level: Below 117,379 (beneath structure low)
Potential Target: 121,102 — aligns with higher timeframe imbalance and previous untested levels
🧠 SignalPro Notes:
The earlier Sell signals followed by failed downside continuation show weakening bearish control.
EMA realignment in progress — continued strength above white EMA could accelerate momentum.
⚠️ This chart and analysis are for educational purposes only. It is not financial advice. Please perform your own analysis and manage risk carefully.

BTC/USDThe BTC/USD trade with an entry price of 117,000, stop-loss at 116,404, and exit price at 116,932 has successfully achieved its target, marking it as a profitable short-term sell trade. This setup was structured to capture a downward move in Bitcoin’s price, with a potential gain of 68 points while keeping risk under control. The trade reflects precise planning, as the target was reached efficiently without triggering the stop-loss.
The entry level at 117,000 was carefully selected, likely at or near a resistance zone where price showed signs of rejection or bearish signals from indicators such as RSI or MACD. This confirmed the potential for a downward move.
The stop-loss at 116,404 was set strategically to protect against sudden volatility and unexpected price spikes. Although it was close enough to manage risk effectively, the market respected the direction of the trade and did not test this level.
The exit price at 116,932 acted as a take-profit point aligned with short-term support, ensuring profits were secured before any reversal.
This successful target hit highlights the importance of discipline, technical analysis, and strict risk management in BTC/USD trading, especially in a highly volatile market.

BTC - 15th Aug - Buy Price as shown in chart around 118 and below is 2nd wave support and buy zone for upper 3rd wave. Trend is Bullish. SPX open higher than yesterday is bullish. I am expecting BTC moving to again new ATH or at least previous high. Risk - big players may manipulate to get their liquidity ... they too need to buy before pushing price to upside.... hold 50 to 60% long in BTC and hold tight for higher levels in coming days or even for today. All US , Europe Data is +ve for US equity and BTC. Dollar Index is crashing as expected fiat money. BTC will go up for sure

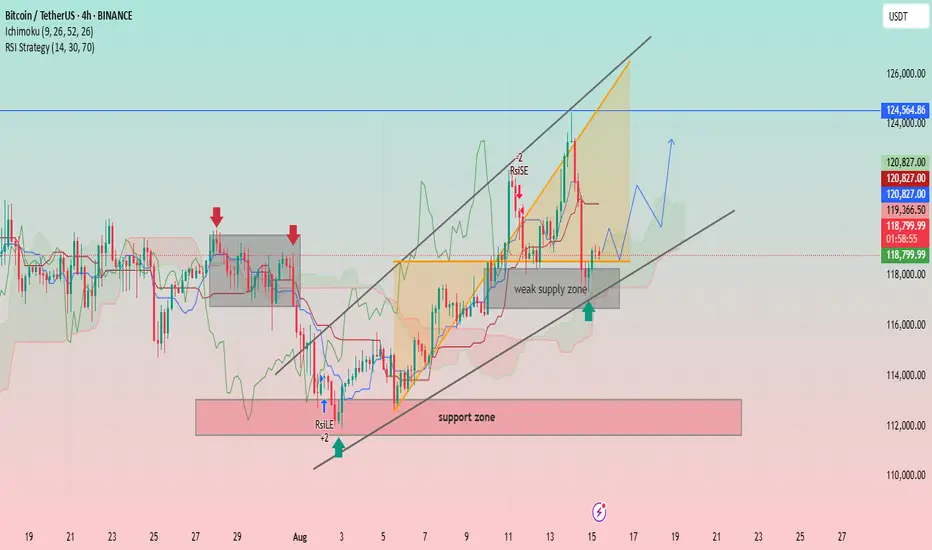
BTC/USDT: Bullish Momentum and Key Support LevelsUptrend Channel: The price is trading within an ascending channel, denoted by two parallel black trendlines. This suggests a bullish trend is in play.
Support and Resistance:
A significant support zone is identified between approximately 112,000 and 114,000 USDT.
A weak supply zone is marked around 118,000 USDT. The price has recently tested this area and found some support.
A strong resistance level is visible at approximately 124,564.86 USDT.
Indicators:
Ichimoku Cloud (9, 26, 52, 26): The price is currently trading above the cloud, indicating a bullish sentiment. The cloud itself appears to be thin and slightly bullish, suggesting potential for continued upward movement.
RSI Strategy (14, 30, 70): The Relative Strength Index (RSI) is used as a strategy, with a "RSILE" signal (likely "RSI Low Entry") marked with a "+2" and a red arrow, suggesting a potential buy signal near the support zone in early August. A "-2" signal is marked near the top of the channel, indicating a potential overbought condition or reversal signal.
Price Action and Projections:
The price recently experienced a sharp decline from the upper trendline, indicating profit-taking or resistance at that level.
The price is currently near the lower trendline and the "weak supply zone," which appears to be acting as support.
A potential future price path is drawn with a blue arrow, suggesting that the price may consolidate or bounce off the current support area and move higher towards the upper boundary of the channel.
Another potential path is drawn with a red arrow, showing a possible further drop towards the lower trendline before a bounce.
BTC - 14th Aug - Buy re enter level - Buy below 121 for TP -131In my previous charts i clearly commented to Book Profit.
No Price has done correction 2nd wave all most done and
is expected to take key support at support & resistance
inter change zone marked in green in chart. This area is strong support zone forming a
strong W formation and rectangle of support given breakout on
up side. I strongly expect price to take support from here and move up side mostly.
Keep buying the dips with money management.
This view is given before US Jobs data expected in less than 1 hr from now
As pointed out earlier given CPI data failed to create any impact.
In my view this Jobs data too is not important for Bitcoin but few people
listen to others and do buy or sell ... Market makers need to pull BTC from others.
Buy BTC below 121 in small qty and green area at 121300 is strong level to accumulate.
Up move could be in sub waves which we will know based on price action.
We got Buy levels for now. Price went to new ATH due to so many big whales massive
buying and they are holding ... only the weak hands keep seeing US data and other news sell.
All corrective trend have lesser volume compared to main trend.
US Dollar Index and Dollar - Fiat money will keep crashing and Bitcoin going to Moon - 150 or 180 after 131 K

BTC/USD Eyeing Breakout Toward $121.5K – Supply Zone Retest ?Current Price: ~$119,872 showing consolidation just above the 0.618 Fibonacci retracement level.
Structure: Price has bounced from the supply zone (~118.4K–118.6K) and is currently pushing upward.
Ichimoku Cloud: Price is trading within a cloud breakout attempt, indicating potential bullish momentum.
Fair Value Gaps (FVG): Two unfilled FVGs above suggest liquidity targets at ~$120.6K and ~$121.5K.
Support Levels:
Strong Support: ~$115.8K–116.5K.
Local Supply Zone Support: ~$118.4K.
Target: Main upside target sits at $121,533, aligning with a prior high and liquidity pool.
Trade Plan (Long Setup):
Entry: $119,700 – $119,900 (current consolidation zone)
Stop Loss: Below $118,400 (below supply zone)
Take Profit 1: $120,600 (first FVG target)
Take Profit 2: $121,533 (major resistance/liquidity target)
Risk/Reward Ratio: ~2.8
Notes: Wait for a bullish confirmation candle or 1H close above $119,900 before entering. Avoid chasing if price spikes without retest.
This plan follows the chart’s bullish structure and aims to ride the move into the untested liquidity areas above.
If you want, I can also give you a short scenario plan in case price rejects here. That would make this a full two-way trade setup.

#XAUUSDGOLD start it's correct from 22 April 2025 ,and complete a flat correction on 15 may 2025 , after that the price rise but not able to cross the high of B wave ,so it enter in a complex correction and form a X wave on 16 jun 2025 and make its A wave on 30 june 2025 , and rice to B wave and forming a double flat correction .the price is now in its C wave and expected to come lower to the level of 3200-3100.We can put over SL to the high of B wave.

BTC - 13th Aug viewPrice seems to be making sub waves inside the 5th wave where we have new ATH targets open.
In the sub waves price just took 2nd wave support and make 3rd wave and need to see 4th sub wave re test 120200 to 120400 support area or else make false move by breaking to 118 which is a possibility but i do not want or do not expect it to happen after such a good up move. Just want to caution so money management is taken care and do trade only with 50 to 60% capital all ways. buy the dips and sell the rallies with profits and with no greed for more and more without taking profits... we will get dips too... or at least higher low with proved support to take raisk instead of chasing

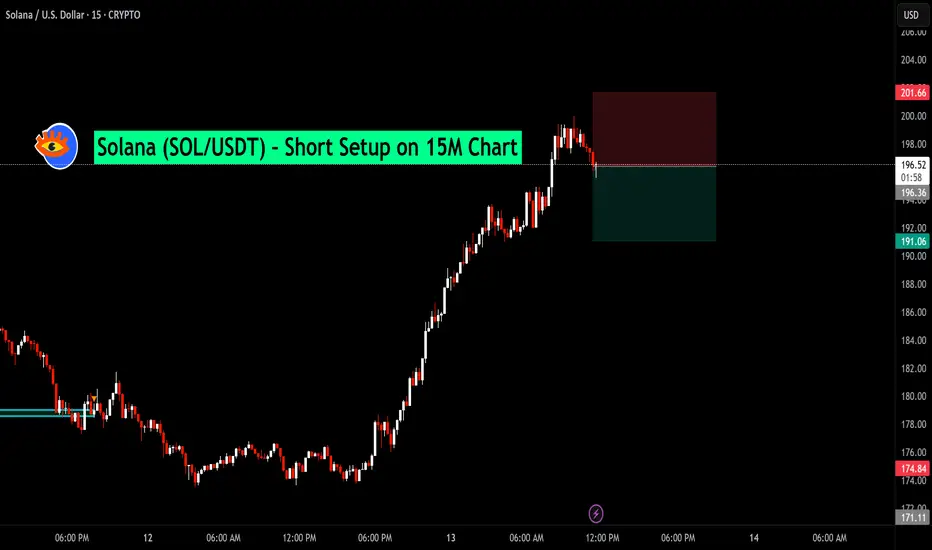
Solana (SOL/USDT) – Short Setup on 15M ChartAfter an extended bullish run, Solana is showing early signs of exhaustion near the $196–$197 zone. Price has failed to sustain above recent highs, forming a potential short-term reversal pattern.
📉 Trade Idea:
Entry: $196.40
Stop Loss: $201.66 (Above recent swing high)
Target: $191.06 (Support zone from prior consolidation)
This setup aims to capture a pullback move following a strong rally, with a favorable risk-to-reward ratio.
"BTC Hits Premium Zone – Is $117K the Next Stop?""BTC Hits Premium Zone – Is $117K the Next Stop?"
Bitcoin has rallied into the $121,000–$123,000 resistance zone, aligning with a Fair Value Gap (FVG) and a Breaker Block, both of which are high-probability reversal points in Smart Money Concepts (SMC). This region represents a premium pricing area, where institutions often take profits and trigger retracements.
Key Observations:
Liquidity Sweep: Prior highs have been taken, potentially fulfilling buy-side liquidity objectives.
Breaker Block Resistance: Price is currently reacting to this zone, indicating sellers stepping in.
Fair Value Gap: The unfilled imbalance between $121,000–$123,000 is acting as a short-term supply area.
Projected Retracement: A move down toward $117,000 is anticipated, coinciding with prior structure support and a liquidity pocket.
Technical Levels:
Resistance Zone: $121,000–$123,000
Target Zone: $117,000 (first key support)
Major Support: $112,000–$113,000 range
Bias: Short-term bearish toward $117,000 before potential continuation, unless price closes strongly above $123,000, invalidating the reversal thesis.

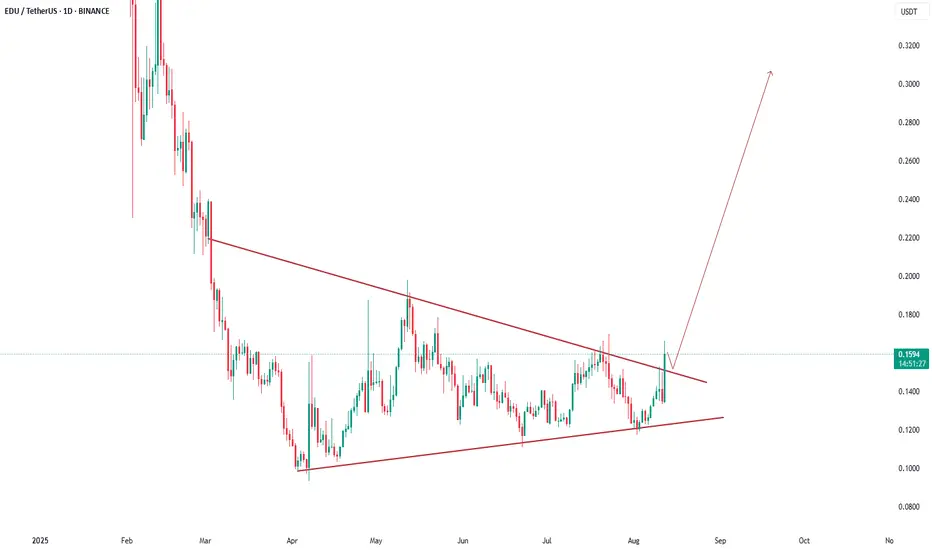
EDU/USDT Breakout from Symmetrical Triangle — Potential Bullish The daily chart for EDU/USDT on Binance shows a breakout above a long-term symmetrical triangle pattern after months of consolidation. Price has surged by over 18% today, supported by strong volume, signaling bullish momentum. If the breakout holds, the chart projection suggests a potential rally toward the $0.30 zone. Traders may watch for retests of the breakout line as possible support before continuation.
This is general information only and not financial advice. For personal guidance, please talk to a licensed professional.