BTC - 12thAug2025 - 4th wave bottom and 5th wave TP - 1248004th wave has fallen more because 2nd wave was also bigger. 4th wave bottom is expected in the zone marked in green where we have W formed support and this area is vital to call the trend is in bull trend and no change of character untill this area holds. my wave count is in line with all analysts so far and if this support is broken then BTC is too much manipulation, This view is shared before important US data so stay cautious in money management. Its good level to buy BTC and hold at least 60% long as its a key technical support area and potential move to new ATH from here with out further down move.
1-BTCUSD

BTC/USDThe BTC/USD trade with an entry price of 116,579, stop-loss at 116,404, and exit price at 116,932 is a short-term buy trade setup aimed at capturing a modest upward movement in Bitcoin’s price. This trade targets a profit of approximately 353 points, with a controlled risk of about 175 points, giving a favorable risk-to-reward ratio of nearly 1:2.
The entry price of 116,579 is likely chosen after confirming bullish momentum through technical analysis. This could include a breakout above a short-term resistance level, a bounce from support, or confirmation from indicators such as RSI, MACD, or moving averages. Entering at this point suggests the trader expects continued upward movement toward the profit target.
The stop-loss at 116,404 is placed strategically below a recent support area. This ensures that if the market moves against the trade, losses are minimized and capital is preserved. In volatile assets like Bitcoin, having a tight but logical stop-loss is critical to avoid large drawdowns.
The exit price of 116,932 serves as the take-profit level. This target is likely aligned with a nearby resistance zone or calculated through chart patterns like Fibonacci extensions. Securing profits at this point helps prevent losses from sudden reversals.
Overall, this setup reflects disciplined trading with a well-defined entry, strict risk control, and a realistic profit goal—key elements for consistent success in BTC/USD trading.

BTC trade planBullish: BTC broke major resistance yesterday with strong green candle, it may retest at 115000 level and continue upside momentum.
Bearish: If it breaks115000 level and starts going down wait for retest and target can be below trend line.

BTCUSD Eyes Lowest Support Retest-Weakness PersistsThis 15-minute chart on BTCUSD reflects sustained bearish conditions, with clear rejection patterns and sell momentum guided by Leola Lens SignalPro overlays.
🔍 Technical Structure Highlights
🔻 Multiple SELL signals continue to appear below compression zones — indicating persistent supply.
🟡 Caution Labels marked each major swing low, capturing high-probability trend reversal zones, but no structural breakout followed.
🟥 Price remains trapped beneath both adaptive red and white base trendlines, confirming dominant downside bias.
🟩 A brief BUY signal appeared inside a narrow range, but failed to follow through — highlighting overall market weakness.
🔁 What to Watch
A clean move above $113,374 is needed to shift momentum toward the $114,800–$116,000 resistance band.
If rejection holds, price may rotate back toward the lower support zone near $112,713, or further.
🧠 This chart illustrates a structure-first approach using Leola Lens SignalPro. For educational analysis only. Trade safe.
#BTCUSD #Bitcoin #Crypto #LeolaLens #StructureTrading #SmartContext #PriceAction

BTC - will the history repeat now ? 6th Aug 2025 viewIn Bitcoin previous patterns repeat and many people refer to previous year or earlier pattern.
The price at which price took support and moving up now is similar to the move in below levels in chart as shown and explained. only difference now is in the below pattern wave 3 was much earlier and very aggressive but right now its much lower level tested and yet to move up and show signs of wave 3 to confirm whether history will repeat or not. price action this week is crucial for Bitcoin

Chart update for BTCNBL
I trail my sl to strict at the pointed area
And tp also maintain on the chart
RSI also oversold area

BTC - revised TP is 130K - Logic explainedI agree two times support for completion of wave 4 got broken but due to news flow other wise logic given in previous charts are based on confirmation of support. Now this may not go wrong. First resistance is at 116K and mean revision level is 118, once we cross these two level every analyst agree we will make new ATH and that level is 130 as per my calculations for wave 5. This is minimum level and it can be more higher as well like 150 , 180K which many people talking with their logics which i agree too. I am saying 130 is minimum we will see this year 2025 by sooner for sure.

#PUMP Is Ready For A Downside Movement#PUMP Can Dump Because Of Low Vol And Weak Structure, We May See A Downside Movement.
Disclaimer -: This Is Not A Trade And Not A Financial Advise, We Dont Bear Any Responsibility Of Loss Or Profit You Made In This Trade, This Is Just An Idea

BTC/USDThe BTC/USD trade with an entry price of 113,461, stop-loss at 113,735, and exit price at 112,913 is a short-term sell trade setup. In this scenario, the trader expects Bitcoin’s price to decline after entering at 113,461, targeting a profit at 112,913. The total potential profit is around 548 points, while the risk is about 274 points, giving a favorable risk-to-reward ratio of nearly 1:2.
The chosen entry price indicates that BTC may be at a resistance level or showing bearish confirmation signals, such as a rejection from a higher level, bearish candlestick patterns, or overbought conditions on indicators like RSI or MACD.
The stop-loss at 113,735 is placed above the entry to limit losses if the market reverses upward. This level is chosen just beyond the resistance zone to avoid being stopped out by minor fluctuations.
The exit price at 112,913 is the target level, likely based on a nearby support zone or a projected price move.
This trade setup reflects disciplined trading with defined risk and profit targets. By adhering to the plan and avoiding emotional decisions, the trader can manage risk effectively while seeking profits from short-term BTC/USD downward movements.

$BTC Weekly Bearish Divergence is Screaming!BTC has been moving up nicely on the weekly, no doubt. But right now, it’s literally sitting on a major trendline support. I mean, this is make-or-break territory. If we lose this level and drop below $109K, I’m telling you — it could flush straight down to $95K–$90K. That’s a clean gap zone, no real structure there.
And here’s what’s bugging me — RSI is throwing up a bearish divergence, and the Stochastic RSI is also screaming the same thing. Just waiting on that MACD crossover confirmation... if that happens and the trendline breaks, this thing might not even wait for a proper retest. Could dump hard.
I’m not buying the $150K narratives right now. Personally, I don’t see it going past $125K in this cycle unless something wild happens.
Keeping it real — this is the level I’m watching like a hawk. If we break, strap in.

#APT Bearish Setup And IdeaAPT Is Also In Bearish Structure, Also Its Failing To Hold The Support, We Have A Small Reversal Area Downside, We Can See A Good Momentum In APT From Our Reversal Area, But Until Then There's No Pump (If Market Pumped, This Idea Will Be Invalidate).
Disclaimer -: This Is Not An Financial Advise, This Is An Idea, We Are Not Responsible For Any Profit And Loss You Will Made.

BTC/USDTrading BTC/USD at an entry price of 113,414, with a stop-loss at 112,666 and an exit price at 114,900, is a well-defined trade setup designed to capture a bullish price movement while managing risk effectively. The trade aims to take advantage of potential upward momentum in Bitcoin, with a target profit of around 1,486 points and a risk of approximately 748 points. This results in a favorable risk-to-reward ratio of about 1:2, which is an essential element of disciplined trading.
The entry price at 113,414 is selected based on market analysis, possibly indicating a breakout above a short-term resistance or confirmation of a bullish trend. Traders often rely on technical indicators such as moving averages, RSI, MACD, or support-resistance levels to identify optimal entry points. Entering at this level suggests confidence that BTC/USD will continue moving upward toward the target.
The stop-loss at 112,666 is placed strategically below a key support area to limit losses if the market reverses. It acts as a protective mechanism, ensuring that unexpected volatility or bearish moves do not lead to significant capital loss. Setting a stop-loss is crucial, especially in cryptocurrency trading, where price swings can be sharp and sudden.
The exit price at 114,900 is a predefined take-profit level where the trader plans to close the trade to secure gains. This level may coincide with a resistance zone or a calculated price target based on technical patterns like Fibonacci extensions.
This trade setup reflects a disciplined approach by having clear entry, exit, and risk management. By following the plan strictly and avoiding emotional decisions, the trader increases the chances of achieving consistent profits while minimizing potential losses in the highly volatile BTC/USD market.

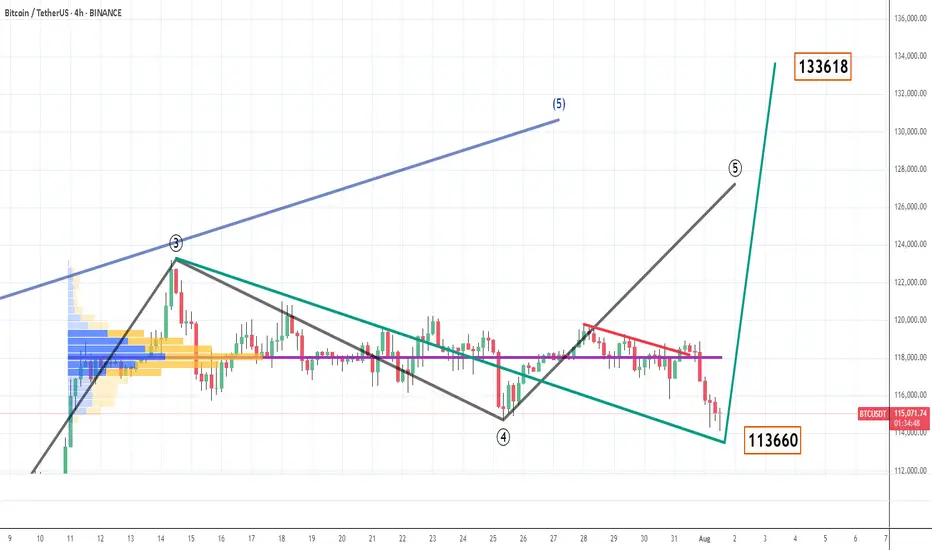
BTC - 1st Aug view - 4th wave revised and new TP - 133KBig players played a false move to shake weak hands when US data, trade deals, crypto policy etc etc favoring continuation of impulsive move. But its big players deliberate move to generate liquidations and get bigger qty of bitcoins.
Now
As per revised 4th wave shown in green line and black was earlier given wave counts.
There is no 100% accurate levels and its based on demand and supply when ever big players and algo wants to move the price either side.
In case price move above 116030 then i wish to consider 4th wave is done and we move towards 133K even if its not going to happen then also mean revision or rejection comes above 118K only and risk to reward Favours buying this dip or hold with money management.
Tariff news is not at all a impacting factor for economy as US customers going to choose the better deals and move on. every day importers and exporters compete with each other. countries compete with each other. why BTC which gets higher price due to fiat money printing get impacted now. its all big player games i think
BTC Took Support – Big Move from Demand Zone Expected!🚀 BTC Took Support – Big Move from Demand Zone Expected!
Bitcoin (BTC/USD) has touched the demand zone and now showing signs of upside reversal. After taking out sell-side liquidity, price is getting ready for a bullish push toward higher targets.
📊 Technical Analysis:
🟤 Demand Zone (115,000 – 116,000):
Market came down and respected this zone. This is a strong area where buyers entered again.
🧲 Sell-Side Liquidity Grab:
Price formed equal lows, then broke them to collect liquidity before reversing — typical smart money behavior.
🔁 Break of Structure (BOS):
Structure break confirmed that trend might reverse now from bearish to bullish.
🟪 Fair Value Gap (FVG):
A clean FVG is also visible near the top side, and price may move to fill this imbalance.
🎯 Target: 119,000 USD:
If bulls hold the demand zone, BTC can easily move towards this resistance area. This is the short-term upside target.
📚 Key Learning Points:
Liquidity was collected below equal lows
Buyers stepped in from the demand zone
Break of structure confirms bullish pressure
FVG + Resistance area aligns with target
✅ Conclusion:
As long as BTC holds above 116,000, bulls are in control. This is a good zone for long entries, with a target near 119,000. Traders should watch for confirmation with minor BOS or strong bullish candles.

BTC - TP 127200 confirmed coming !!! 29th july viewEveryone are in same page with respect to wave 5 is in progress and we will be seeing new high.
Inner waves of 5th wave is clear now with support formed and ABC corrective move of 2nd wave seems to be completed price moving up. when price respect fib levels and align with wave theory then we can predict the targets. 3rd, 4th and 5th are plotted based on the first 2 move and this will happen for minimum possibilities. so with this data points I am predicting TP of 127200 for BTC very soon in short term.

BTCUSD - Consolidation Breakout & RetestBitcoin has successfully broken out of its consolidation zone on the 15-minute chart. After a strong breakout above the horizontal resistance, we are now seeing a textbook retest of the breakout level, which may act as a fresh support.
✅ Bullish confirmation if price sustains above the breakout zone
📍 Resistance turned support at ~118,700
🎯 Upside momentum likely to continue if this retest holds

Bitcoin rebounds with strength after whale dumpAfter a surprising sell-off triggered by whale pressure, Bitcoin (BTCUSD) has shown impressive internal strength, bouncing quickly from the Fibonacci support zone between 114,488 and 116,571 USD (0.618 – 0.5 levels).
The D1 chart reveals that the bullish structure remains intact, with EMA 34 and EMA 89 acting as solid support levels. The recent "dump" did not alter the overall trend; on the contrary, it created an opportunity for reaccumulation within the price box—serving as a vital base for the next breakout.
A likely scenario is that BTCUSD will continue to move sideways for a few more sessions before targeting the 1.272 Fibonacci extension near the 128,000 USD area. If this plays out, it would be a strong confirmation of the next growth phase for Bitcoin.
Do you believe Bitcoin is ready to break all-time highs and set a new record? Share your thoughts below!

Buy BTC @ 117250 area - FIB LevelEvery one know BTC is in 5th main wave and in that it has done first wave and now second correction wave which is mostly 50% FIB level of first level coming at 117250 area where i strong suggest every one to buy long positions again in BTC

Trendline Breakout in ETHUSD – Watch for Momentum!Ethereum has successfully broken above a key descending trendline on the 15-minute chart, signaling a potential shift in short-term sentiment.
📈 Breakout Level: ~$3,829
🎯 Target Zone: ~$3,873
🛑 Stop Loss: Below ~$3,767
After several rejections along the resistance, ETH finally managed a clean breakout with a strong bullish candle. If it sustains above the trendline, we could see follow-through buying towards the upper zone.
🔍 Keep this setup on radar — a retest and bounce from the trendline could offer a high-probability entry.

Target hit on BTC/USD
The entry price of 117,605 is likely chosen based on technical analysis, where Bitcoin shows bullish signals, such as a breakout above resistance or confirmation from indicators like RSI, MACD, or moving averages. Entering at this price suggests that the trader expects upward momentum to continue, aiming for the target of 118,857.
The stop-loss at 117,000 is set just below a support level to protect against unexpected downward moves. If Bitcoin fails to sustain above the entry zone, this stop-loss helps minimize losses. Setting the stop at a strategic level prevents being stopped out by normal market fluctuations while still managing risk.
The exit price at 118,857 acts as the take-profit level, aligned with a resistance area or projected price target. Exiting at this level ensures that profits are locked in without waiting for unpredictable price reversals.
This trade setup reflects disciplined trading with predefined risk management. Using a clear entry, stop-loss, and exit strategy avoids emotional decision-making. Because BTC/USD is highly volatile, continuous monitoring of price action and market news is essential. Sticking to the plan ensures the trader can capture potential gains while limiting downside risk, making this trade a balanced and calculated approach to cryptocurrency trading.

DOGE MARKET CAP PENGING RALLY , NOW WANT TO BE CONTINUE Current Market Cap: $35–40 billion
Global Rank: #8 among all cryptocurrencies
Price per DOGE: $0.23–$0.27
Circulating Supply: ~150 billion DOGE
All-Time High Market Cap: ~$85 billion (May 2021, at ~$0.73 per DOGE)
Supply Type: Inflationary – ~5 billion DOGE added annually
Volatility Drivers: Strongly influenced by social media, especially Elon Musk’s activity
Investor Sentiment: Divided – strong community vs. concerns over hype and centralization

BTCUSD-Eyes 120000 after Liquidity Sweep & Support RetestPrice action on the 15-min chart shows Bitcoin forming a potential bullish continuation after a liquidity sweep below short-term support. Here’s what stands out:
🔹 Triple Tap Support: Price respected a key zone multiple times, hinting at strong buyer interest.
🔹 Post-Sweep Reaction: Sharp recovery followed by consolidation suggests demand re-entered the market.
🔹 SignalPro Context: Leola Lens™ SignalPro highlighted key zones (yellow + orange), offering caution and trend context.
🔹 Projected Path: With price stabilizing above the reclaimed zone, potential upside target aligns with the 120000 region.
📌 Educational Note:
This setup highlights how liquidity collection below support and subsequent recovery can offer clues to short-term directional intent. Always manage risk based on volatility and session context.

