UPL Limited – Weekly Chart Analysis
📊 UPL Limited – Weekly Chart Analysis
Company Overview:
UPL Limited is a global leader in sustainable agricultural solutions, ranked among the top five agricultural solutions companies worldwide. The company operates across multiple countries, offering an integrated portfolio of patented and post-patent agricultural solutions for both arable and specialty crops — including biologicals, crop protection, seed treatment, and post-harvest solutions.
UPL is principally engaged in:
Production and sale of agrochemicals, field crops, and vegetable seeds
Non-agro business of industrial chemicals, chemical intermediates, and speciality chemicals
With market access across the world’s food basket, UPL is focused on driving growth and innovation throughout the entire agricultural value chain — from growers to distributors and partners. 🌱
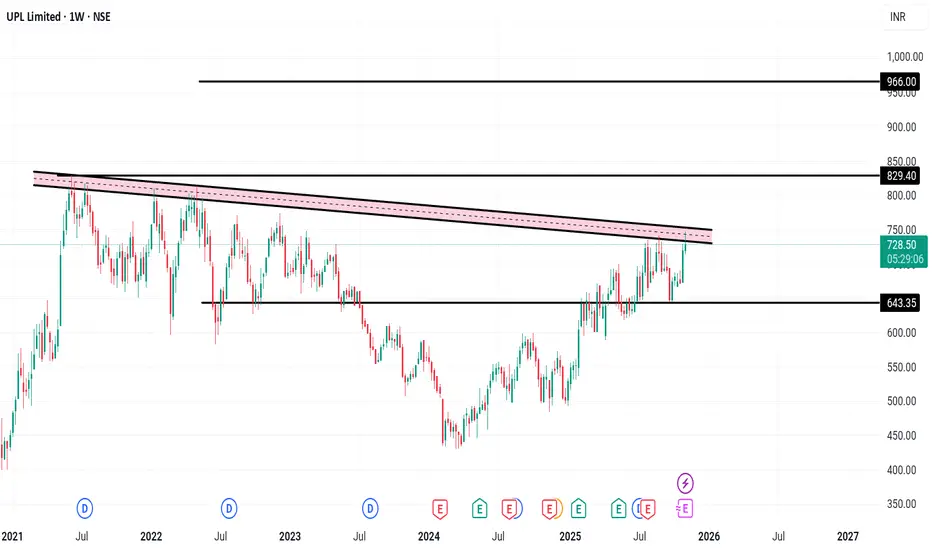
📈 Technical View (1-Week Chart):
A trendline formation is observed on the weekly timeframe, indicating a potential breakout setup.
Resistance: ₹830 – strong resistance zone. A breakout above this level can trigger the next target near ₹930.
Support: ₹643 – strong support base.
This formation suggests the move could take time to play out, as it’s developing over the weekly chart.
📊 Key Financial Snapshot:
UPL’s current market price is around ₹724.15 with a P/E ratio of 11.65. The company holds a market capitalization of ₹61,068.53 crore and offers a dividend yield of 0.83%.
In the latest quarter, net profit stood at ₹612 crore, reflecting a 125.74% increase compared to the previous quarter. Quarterly sales were ₹12,019 crore, showing an 8.38% rise. The company’s Return on Capital Employed (ROCE) is 7.66%, indicating stable operational efficiency.
Disclaimer: For educational purposes only, not investment advice
1week
INDUS TOWERS LTD - POSITIONAL - 1 WEEKINDUS TOWERS LTD .. Positional Bullish for short term pick ( 1 week ..) hourly chart seen bullish trendline as well as resistance breakout recently,
Last trading session bullish hammer candle at support level also seen , HAMMER CANDLE is indication of strong support level Where stock does not want to fall further.
RSI seen at 60 bullish level.
1 week positional target 275 ( 17 - 25 Feb 2022 ) Potential upside 10%
BUY INDUS TOWERS LTD 258
TARGET 270-275
STOP LOSS 250
** THIS IDEA IS FOR EDUCATIONAL PURPOSE..trade at own risk. !
HAPPY TRADING. !!

Only for study purpose ... DISCLAIMER :
You can see ENTRY and TGT points and also SL ...
But one more thing ...
you can Enter here or you can take entry on a retest of the zone.

RELIANCE INDS LONG 1WA Triple bottom (encircled in the chart) can be seen on the weekly chart of Reliance Inds. RSI shows good momentum in the stock. MACD giving bullish signs. I would recommend a LONG swing on Reliance Inds.
Target 1: 2140
Target 2: 2194
Target 3: 2320 (A long jump is expected after crossing target 2)
Stop Loss: 1927
Note: Trail your stop loss to avoid losing achieved targets.
Just for educational purpose.

