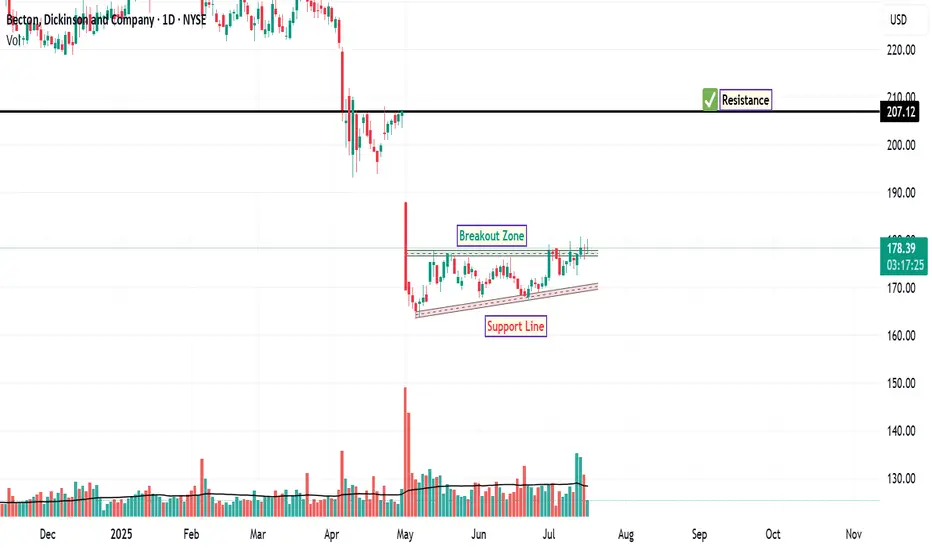
BDX: Technical ViewThe stock of BDX currently exhibiting a notable technical setup, with key levels identified on the chart.
Support Level: The price has shown consistent buying interest on ascending trend line , indicating a strong base. This level has been tested multiple times, confirming its significance.
Resistance Level: The next major resistance is located at $207 , which has historically acted as a ceiling for price movement. A breakout above this level could open the path for further upside momentum.
Disclaimer:
The information provided in this technical analysis is for informational and educational purposes only and should not be construed as financial or investment advice. It is an interpretation of historical price data. Market dynamics can change, and past performance is not indicative of future results. All trading and investment activities involve risk. Always conduct your own thorough due diligence and consult with a qualified financial advisor before making any investment decisions.
2025
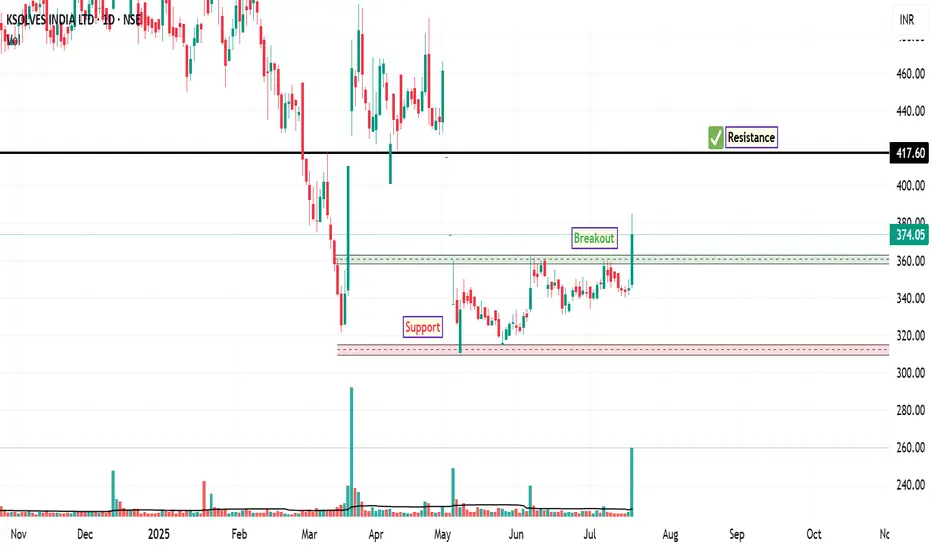
KSOLVES: Upside PotentialThe stock of KSOLVES is currently exhibiting a notable technical setup, with key levels identified on the chart.
Support Level: The price has shown consistent buying interest around 311 indicating a strong base. This level has been tested multiple times, confirming its significance.
Breakout Level: A potential breakout is observed near 366 . A decisive close above this level, accompanied by increased volume, could signal the beginning of a bullish trend continuation or reversal, depending on the broader context.
Resistance Level: The next major resistance is located at 418 , which has historically acted as a ceiling for price movement. A breakout above this level could open the path for further upside momentum.
Disclaimer: The information provided in this technical analysis is for informational and educational purposes only and should not be construed as financial or investment advice. It is an interpretation of historical price data and technical indicators. Market dynamics can change, and past performance is not indicative of future results. All trading and investment activities involve substantial risk. Always conduct your own thorough due diligence and consult with a qualified financial advisor before making any investment decisions.
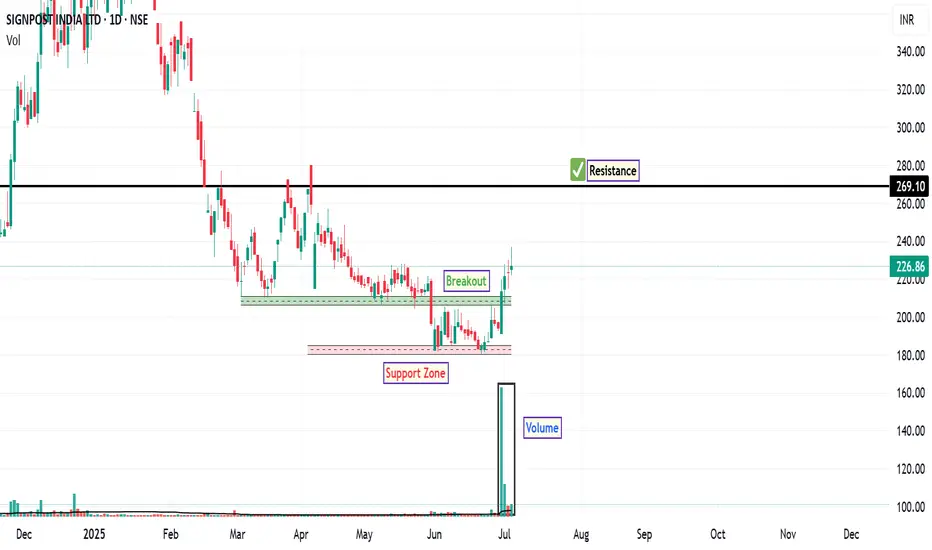
SIGNPOST: Potential Trend ReversalFollowing a significant corrective phase initiated in January 2025, SIGNPOST is now exhibiting a confluence of technical signals that suggest a potential reversal in trend. A noteworthy catalyst appears to be the recent institutional activity, substantiated by a bullish shift in price action, key moving average reclamations, and strengthening momentum indicators.
The most compelling recent development has been the report of bulk deals on Monday and Tuesday of this week. Such large-volume transactions often indicate institutional interest and can act as a catalyst for a shift in market sentiment. This event appears to have marked a local price floor, leading to a sharp upward thrust and suggesting a potential absorption of selling pressure. This influx of significant volume provides a strong foundation for the bullish hypothesis.
The price has now achieved consecutive closes above both its 20-day and 50-day EMAs. These moving averages are critical medium-term trend indicators. By moving above these levels, which previously acted as dynamic resistance during the downtrend, the price action indicates a material change in character. These EMAs may now be observed to act as the first line of dynamic support during any potential pullbacks or periods of consolidation.
Momentum oscillators are also corroborating the bullish price action, indicating a potential underlying shift in market control. The RSI has advanced sharply to a reading of 67. It is important to note that this level indicates strong bullish momentum and is approaching overbought territory, not oversold. A sustained reading above 60 typically signifies a robust and healthy trend is in place.
The MACD has registered a bullish crossover, with the MACD line moving above the Signal line. This is further supported by a positive and expanding histogram, which visually confirms that bullish momentum is accelerating.
The technical developments suggest the current price level is of significant interest. The recent price action indicates a potential shift in sentiment, making the present zone a noteworthy point for observation. The ₹269 price level appears to be the next significant technical hurdle. This area may correspond with prior price structure and could act as a potential zone for profit-taking or consolidation. The ₹181 level serves as a key area of underlying support. A decisive break below this level would potentially undermine the current bullish structure and suggest that the reversal attempt has failed.
Disclaimer: The information provided in this stock analysis is for informational and educational purposes only and should not be construed as financial advice. Always seek the advice of a qualified financial advisor or do own research before making any investment decisions.
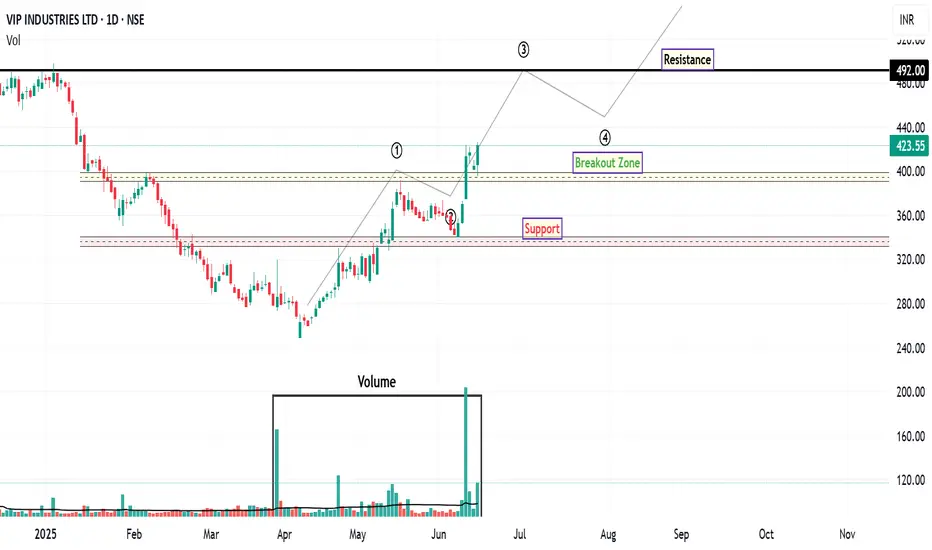
VIPIND: Unlocking Potential After Downtrend
VIP Industries has demonstrated robust bullish momentum over the past few trading sessions, signaling a notable shift in market sentiment. This upward trajectory is particularly significant given the stock's prolonged downtrend since October 2024.
From an Elliott Wave perspective, the recent price action suggests the potential completion of a corrective phase. The retracement from what appears to be Wave 1 to Wave 2 aligns closely with the 61.8% Fibonacci retracement level, which often precedes the initiation of a strong Wave 3 impulse. This potential wave structure, if confirmed, could indicate further upside potential.
A key development supporting this bullish outlook is the stock's recent decisive close above its 200-day EMA, accompanied by a significant surge in trading volume. This confluence of price action and volume confirms strong buying interest and suggests a potential long-term trend reversal. The increased volume further validates the strength of the breakout, indicating broader market participation.
While the immediate outlook appears constructive, traders should be mindful of potential profit-taking around the ₹446 level. This area may present a temporary resistance zone where some short-term corrections or consolidation could occur. However, should the stock successfully navigate this level, the next significant upside resistance target to monitor is ₹492 . This level aligns with prior price highs and could represent a more substantial challenge for further upward movement.
For risk management purposes, a prudent approach would involve considering a stop-loss order positioned below the identified support zone, as depicted on the chart. This strategy aims to mitigate potential downside risk in the event of an unexpected reversal in market sentiment.
Disclaimer: The information provided in this technical analysis is for informational and educational purposes only and should not be construed as financial advice. It is based on observations from the provided chart and commonly used technical indicators. Market conditions can change rapidly, and past performance is not indicative of future results. Always conduct your own comprehensive due diligence and consult with a qualified financial advisor before making any investment decisions.
PepsiCo (PEP): A Potential Shift from Downtrend
Following a prolonged corrective phase that commenced in March 2025, PepsiCo's price action is exhibiting noteworthy signs of a potential bullish reversal. A significant breakout from a multi-week consolidation range on the daily timeframe suggests a possible shift from distribution to accumulation. This hypothesis is supported by strengthening momentum indicators and the reclamation of a key moving average, warranting a closer look at key technical levels.
Detailed Technical Analysis:
1. Price Action: Breakout from Consolidation
After establishing a clear downtrend, PEP entered a period of consolidation, forming a well-defined trading range with a base near the $127 level. Today's session saw a decisive breakout above the upper boundary of this range. Such a move often indicates an exhaustion of selling pressure and an influx of demand. For this bullish thesis to gain further conviction, continued closes above this breakout zone would be constructive. The quality of this breakout would be further substantiated by an accompanying surge in trading volume, which signals significant market participation.
2. Momentum Analysis: RSI Indicating Renewed Buying Interest
Daily RSI: The RSI on the daily chart has surged to 62. A move above the 60 level typically suggests that bullish momentum is accelerating and is now in a strong position.
Weekly RSI: On the weekly timeframe, the RSI has advanced above 42. While still below the key 50 midline, this upward trajectory from oversold territory indicates a notable waning of long-term bearish momentum and may be an early sign of a strengthening trend.
3. Trend Analysis: Reclamation of the 50 EMA
The stock has successfully achieved a close above its 50-Day EMA. This moving average is a widely watched indicator for the medium-term trend. For much of the recent downtrend, the 50 EMA acted as dynamic resistance. By reclaiming this level, it suggests a potential shift where it may now serve as dynamic support during any subsequent pullbacks.
Potential Forward Outlook & Key Levels to Monitor:
Primary Area of Resistance: The $143 zone stands out as the first significant technical hurdle. This level could coincide with prior price structure and may attract initial profit-taking from short-term traders.
Secondary Area of Resistance: Should the momentum carry the price decisively through the primary resistance, the next major level of interest appears to be around $158 . This area represents a more significant structural resistance from the preceding downtrend.
Area for Risk Management: The zone below $127 is a critical area to monitor. This level represents the floor of the recent consolidation base. A sustained break below this level would potentially invalidate the bullish breakout hypothesis and suggest a continuation of the prior downtrend.
Disclaimer: The information provided in this technical analysis is for informational and educational purposes only and should not be construed as financial or investment advice. It is an interpretation of historical price data and technical indicators. Market dynamics can change, and past performance is not indicative of future results. All trading and investment activities involve substantial risk. Always conduct your own thorough due diligence and consult with a qualified financial advisor before making any investment decisions.

BEWARE MARKET COLLAPSE IS COMING IN FEW MONTH 2025 OR EARLY 2026I am not an expert. By analysing the chart patterns of global market and our country India. In coming months of 2025 or early months of 2026 the market will collapse. The reason could be either be WW3 or banking institutions defaulting, or can be due to digital crises. It's going to happen. So just invest in Gold, FD or bonds now. The Market is making M pattern in weeks time frame.

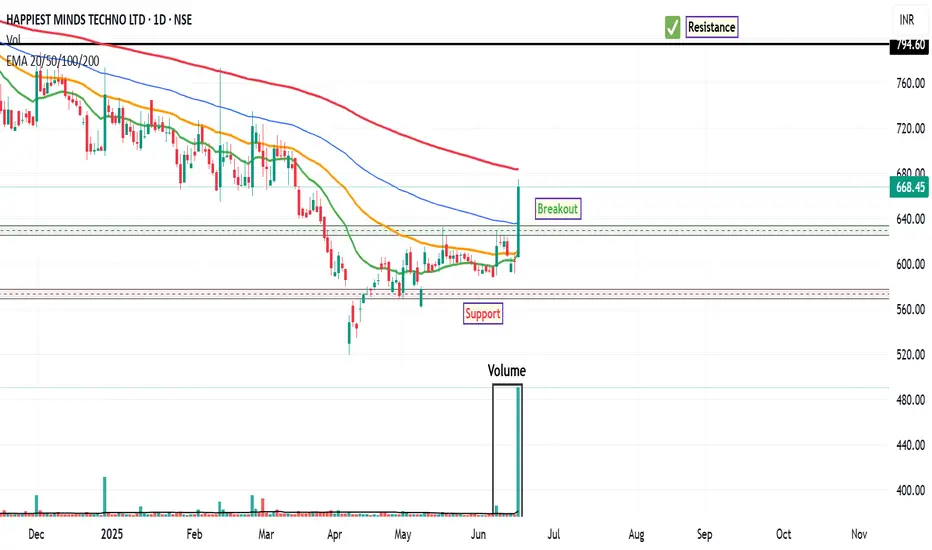
HAPPSTMND: Analysing the Bullish BreakoutHappiest Minds Technologies ( HAPPSTMND ) has recently exhibited a significant shift in market dynamics, marking a potential end to its prolonged downtrend that commenced in July 2024 . In a recent trading session, the stock registered an impressive 11% gain in single trading session signaling a resurgence of buyer interest.
This notable price appreciation was accompanied by a substantial surge in trading volume, with approximately 25M shares changing hands. This volume figure represents nearly 15 times the 20 MA volume, indicating a robust influx of buying conviction and significant market participation behind the upward move. Such a volumetric anomaly often provides strong confirmation for price breakouts or reversals.
From a momentum perspective, the technical indicators are also aligning to support a more constructive outlook. The MACD indicator on the weekly timeframe executed a bullish crossover several weeks ago, a development that typically precedes or accompanies long-term upward trends. Furthermore, the RSI has now advanced to the 54 level . While not yet in overbought territory, this move above the 50-mark suggests increasing bullish momentum and a healthy strengthening of the trend. This confluence of weekly MACD signals and improving daily RSI readings points towards a potentially strong long-term bullish movement.
Considering these technical observations, the stock may face a significant long-term resistance level around ₹794 . This level could present a crucial test for the prevailing bullish momentum, where a sustained breakout might pave the way for further upside. Conversely, for risk management purposes, traders may identify a suggested stop-loss zone and a breakout zone as illustrated on the accompanying chart, which would serve as key areas to monitor for potential shifts in price action or to define risk parameters.
Disclaimer: The information provided in this technical analysis is for informational and educational purposes only and should not be construed as financial advice. It is based on observations from historical price and volume data, and commonly used technical indicators. Market conditions can change rapidly, and past performance is not indicative of future results. All trading and investment decisions involve inherent risks, and losses can exceed initial investments. Always conduct your own comprehensive due diligence and consult with a qualified financial advisor before making any investment decisions.
TEXRAIL: Breakout FocusTEXRAIL has recently exhibited a notable technical development on the daily chart. On Friday, 16 May , the stock completed a breakout from an inverted head and shoulders pattern, a formation often associated with potential trend reversals. The breakout occurred with a decisive close above the neckline, which had previously acted as a key level of resistance and had been tested multiple times, reinforcing its technical significance.
Following the breakout, the price action has respected the neckline as a new support level, with multiple successful retests and rebounds observed. As of today’s session, TEXRAIL has once again rebounded from a brief consolidation phase, accompanied by a substantial increase in trading volume—approximately 18M shares , significantly above its recent average. This surge in volume may indicate renewed interest and participation from market participants.
Momentum indicators are also aligning with the bullish structure. The Relative Strength Index (RSI) is currently approaching the 70 level , suggesting strong upward momentum, though it is nearing overbought territory. Additionally, the MACD histogram is showing signs of potential short-term consolidation or profit-taking, particularly as the price approaches a previously identified supply zone.
Looking ahead, the chart outlines three potential resistance levels that may act as intermediate targets or areas of interest for traders monitoring the trend. These levels are derived from historical price action and volume profile analysis.
📊 Please refer to the accompanying chart for a visual breakdown of the pattern, volume dynamics, and resistance zones.
Disclaimer:
The information provided in this analysis is intended solely for educational and informational purposes. It does not constitute investment advice, a recommendation, or an offer to buy or sell any securities. Always conduct your own research or consult with a qualified financial advisor before making any investment decisions.

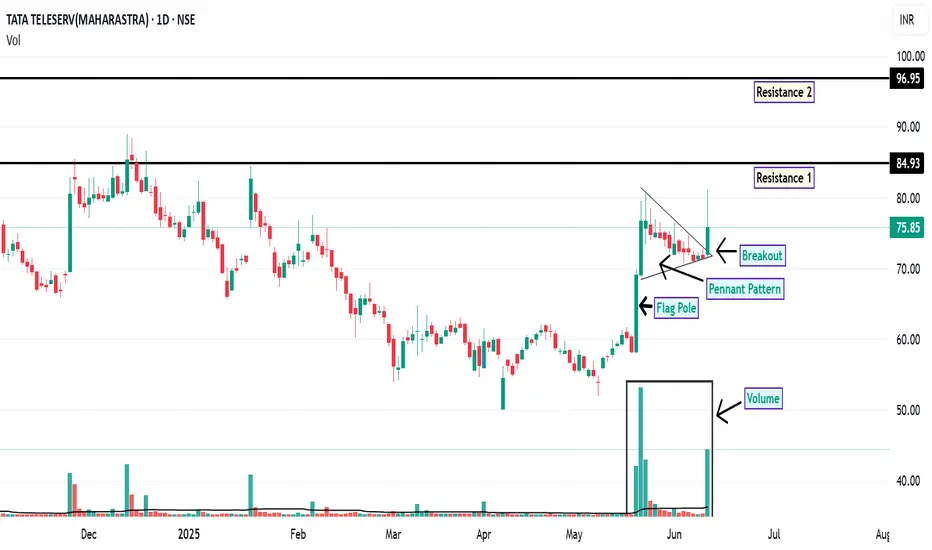
TTML: Pennant Breakout Signals Potential Upside
On the daily chart, TTML has recently exhibited a breakout from a pennant formation , a pattern often associated with potential continuation of the prevailing trend. This breakout is accompanied by a notable increase in trading volume, which may indicate growing market interest and participation.
Additionally, the price action has shown support at the 200-day EMA, a widely observed long-term trend indicator. This confluence of technical signals may suggest a strengthening bullish sentiment.
From a momentum perspective, both the RSI and MACD indicators are currently positioned in bullish territory on both the daily and weekly timeframes. This alignment across multiple timeframes can be interpreted as a sign of potential trend continuation.
Looking ahead, the price may revisit the ₹75 level, which could act as a demand zone. Should the stock manage to close and sustain above ₹76.40 , the next potential resistance levels to monitor are around ₹84.93 and ₹96.95 . For risk management, a suggested stop-loss level could be considered below ₹62 , based on recent support structures.
Disclaimer: This analysis is intended solely for informational and educational purposes. It does not constitute investment advice or a recommendation to buy or sell any financial instrument. Market participants are encouraged to conduct their own research or consult with a licensed financial advisor before making any investment decisions.
Tirumalai: The Anatomy of a BreakoutOn the daily chart, TIRUMALCHM appears to be approaching a potential breakout from an ascending triangle pattern, a formation often associated with bullish continuation. Notably, the price has managed to close above all key EMAs, including the 200-day EMA, which is widely regarded as a long-term trend indicator.
From a momentum perspective, both the RSI and MACD indicators are showing strength on the daily and weekly timeframes. These signals may suggest the early stages of a sustained upward trend, contingent on broader market conditions and follow-through price action.
Given the current technical setup, the stock may be considered for gradual accumulation near the CMP. Alternatively, more conservative participants might prefer to wait for a potential retest of the breakout zone in the coming sessions, which could offer a more favourable risk-reward entry with a next long term resistance of ₹340 .
A technical invalidation level could be considered below the ₹251 mark, depending on individual risk tolerance and trading strategy.
Disclaimer: This analysis is intended solely for educational and informational purposes. It does not constitute investment advice or a recommendation to buy or sell any financial instrument. Market participants are strongly encouraged to conduct their own research or consult with a qualified financial advisor before making any investment decisions.

Jayshree Tea: A Worthy Stock Pick!The chart of JAYSHREETEA provides delineates critical price thresholds that signify breakout points, along with specific support levels that serve as indicators of where buying interest may manifest.
Additionally, the chart highlights regions likely to act as ceiling points for future price ascensions, allowing for informed decisions on entry and exit strategies.
Disclaimer: The information contained in this technical analysis report is intended solely for informational and educational purposes. It should not be interpreted as financial advice or a recommendation to buy or sell any security. Investors are strongly encouraged to conduct their own research and consult with a qualified financial advisor before making any investment decisions.

SERVOTECH: Volume Surge Signals StrengthAn analysis of the weekly chart for SERVOTECH indicates a noteworthy technical development. The security has exhibited a breakout above a key pivot level previously identified around the 148 price zone.
This price action was accompanied by a substantial volume surge. The weekly volume registered approximately 34 million shares, a figure representing a more than five-fold increase compared to its 50W moving average of volume. Such a significant expansion in volume on a breakout can suggest strong institutional interest and conviction behind the move.
Further supporting a bullish outlook of RSI is situated above the 60 level on both the weekly and daily timeframes. A confluence of strong RSI readings across multiple timeframes is often interpreted by market participants as a sign of robust and broad-based upward momentum.
Based on this technical structure, the following price levels may be of interest for observation:
From a strategic standpoint, the stock may present a potential accumulation zone around the 150 level. The 195 level is identifiable as the next area of potential overhead supply, or resistance, where selling pressure might emerge. From a risk management perspective, a breach of the 136 level could challenge the validity of the recent bullish structure and might be monitored accordingly.
Disclaimer: The information provided in this stock analysis is for informational and educational purposes only and should not be construed as financial advice. Always seek the advice of a qualified financial advisor or conduct your own thorough research before making any investment decisions. Market conditions are dynamic, and past performance is not indicative of future results.

YESBANK: Riding the Bullish WaveYes Bank has exhibited a notable breakout above the resistance level established in December 2024. This breakout is accompanied by a classic flag pattern formation, which has resolved to the upside—typically interpreted by technical analysts as a continuation signal within an existing trend.
A significant increase in trading volume during the breakout phase adds weight to the move, suggesting heightened market participation. Furthermore, the 20-day EMA has crossed above the 200-day EMA, a crossover often referred to as a "Golden Cross" , which is generally viewed as a bullish signal indicating potential for continued upward momentum.
The RSI is currently positioned above 60, reflecting sustained buying interest without yet entering overbought territory.
From a structural perspective:
Immediate resistance may be encountered near the 24.75 level.
A secondary resistance zone appears around 28.54.
On the downside, the stock seems to have established a support base near 19.54, which could act as a cushion in the event of a pullback.
Disclaimer:
This analysis is intended solely for informational and educational purposes. It does not constitute investment advice, a recommendation, or an offer to buy or sell any securities. Market conditions can change rapidly, and all trading involves risk. Individuals should conduct their own due diligence or consult with a qualified financial advisor before making any investment decisions.

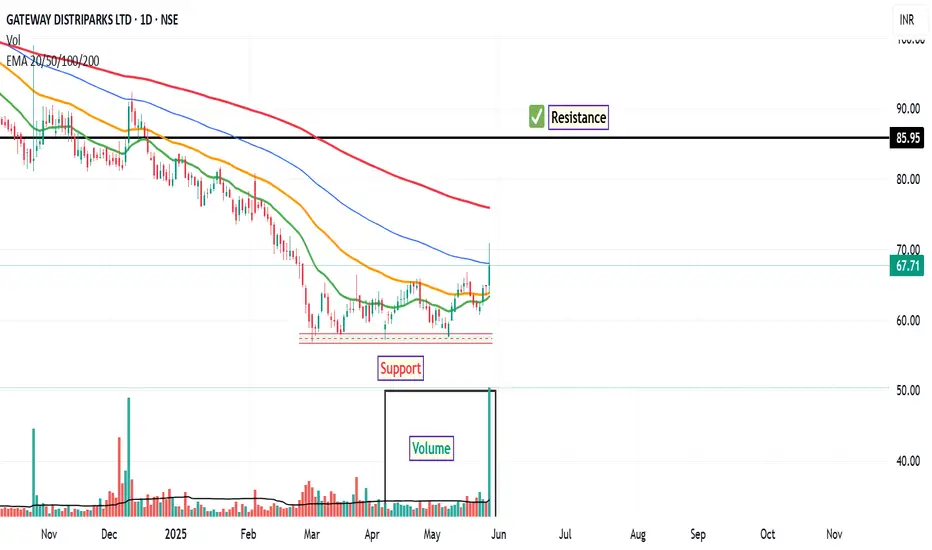
Gateway Distriparks Ltd: Technical CommentaryIn the latest trading session, Gateway Distriparks Ltd demonstrated notable technical strength. The stock successfully closed above both its 20D and 50D EMAs, indicating a potential shift in short- to medium-term momentum. Additionally, it managed to close above the 20-week EMA, which may suggest a broader trend alignment in favour of the bulls.
Volume analysis further supports this view, with a noticeable uptick in trading activity accompanying the price movement—often interpreted as a sign of institutional interest or increased market participation.
The RSI has crossed above the 65 level, a zone that is frequently associated with strong bullish momentum. This development may be interpreted by some market participants as a signal of continued buying interest.
From a price action perspective, the stock appears technically favorable in the range of ₹64, with a potential resistance zone near ₹85. A prudent risk management approach might involve monitoring for a close below ₹56, which could serve as a reference point for reevaluating the trade setup.
Disclaimer:
This analysis is intended solely for informational and educational purposes. It does not constitute investment advice or a recommendation to buy or sell any financial instrument. Market participants are strongly encouraged to conduct their own due diligence or consult with a certified financial advisor before making any investment decisions.
ITI on the Rise: Catch the BreakoutThe chart of ITI provides delineates critical price thresholds that signify breakout points, along with specific support levels that serve as indicators of where buying interest may manifest.
Additionally, the chart highlights regions likely to act as ceiling points for future price ascensions, allowing for informed decisions on entry and exit strategies.
Disclaimer: The information contained in this technical analysis report is intended solely for informational and educational purposes. It should not be interpreted as financial advice or a recommendation to buy or sell any security. Investors are strongly encouraged to conduct their own research and consult with a qualified financial advisor before making any investment decisions.

CHOLAFIN: Potential for 15-20% Upside AheadThe chart of CHOLAFIN provides delineates critical price thresholds that signify breakout points, along with specific support levels that serve as indicators of where buying interest may manifest.
Additionally, the chart highlights regions likely to act as ceiling points for future price ascensions, allowing for informed decisions on entry and exit strategies.
Disclaimer: The information contained in this technical analysis report is intended solely for informational and educational purposes. It should not be interpreted as financial advice or a recommendation to buy or sell any security. Investors are strongly encouraged to conduct their own research and consult with a qualified financial advisor before making any investment decisions.

VISHNU: Parallel Channel BreakoutThe chart of VISHNU provides delineates critical price thresholds that signify breakout points, along with specific support levels that serve as indicators of where buying interest may manifest.
Additionally, the chart highlights regions likely to act as ceiling points for future price ascensions, allowing for informed decisions on entry and exit strategies.
Disclaimer: The information contained in this technical analysis report is intended solely for informational and educational purposes. It should not be interpreted as financial advice or a recommendation to buy or sell any security. Investors are strongly encouraged to conduct their own research and consult with a qualified financial advisor before making any investment decisions.

TDPOWERSYS: Anticipated 20% upsideThe chart of TDPOWERSYS provides delineates critical price thresholds that signify breakout points, along with specific support levels that serve as indicators of where buying interest may manifest.
Additionally, the chart highlights regions likely to act as ceiling points for future price ascensions, allowing for informed decisions on entry and exit strategies.
Disclaimer: The information contained in this technical analysis report is intended solely for informational and educational purposes. It should not be interpreted as financial advice or a recommendation to buy or sell any security. Investors are strongly encouraged to conduct their own research and consult with a qualified financial advisor before making any investment decisions.

SYRMA: Potential for 15-20% GrowthThe chart provides delineates critical price thresholds that signify breakout points, along with specific support levels that serve as indicators of where buying interest may manifest.
Additionally, the chart highlights regions likely to act as ceiling points for future price ascensions, allowing for informed decisions on entry and exit strategies.
Disclaimer: The information contained in this technical analysis report is intended solely for informational and educational purposes. It should not be interpreted as financial advice or a recommendation to buy or sell any security. Investors are strongly encouraged to conduct their own research and consult with a qualified financial advisor before making any investment decisions.

CREDITACC: The breakout setup is in playThe chart of CREDITACC provides delineates critical price thresholds that signify breakout points, along with specific support levels that serve as indicators of where buying interest may manifest.
Additionally, the chart highlights regions likely to act as ceiling points for future price ascensions, allowing for informed decisions on entry and exit strategies.
Here is previous chart:
Disclaimer: The information contained in this technical analysis report is intended solely for informational and educational purposes. It should not be interpreted as financial advice or a recommendation to buy or sell any security. Investors are strongly encouraged to conduct their own research and consult with a qualified financial advisor before making any investment decisions.

CREDITACC: May Next Investment with 10-15% Upside PotentialThe chart provides delineates critical price thresholds that signify breakout points, along with specific support levels that serve as indicators of where buying interest may manifest.
Additionally, the chart highlights regions likely to act as ceiling points for future price ascensions, allowing for informed decisions on entry and exit strategies.
Disclaimer: The information contained in this technical analysis report is intended solely for informational and educational purposes. It should not be interpreted as financial advice or a recommendation to buy or sell any security. Investors are strongly encouraged to conduct their own research and consult with a qualified financial advisor before making any investment decisions.

Nifty - Jan 25"The bearish head and shoulders pattern played out perfectly. Nifty has dropped 12% from its peak. According to the chart, the downside might be nearing completion. Nifty could pause and recover to the first fib level.
****Covid support is still not broken****
However, BN has already broken the COVID Support and Sensex seems like playing with it.

VISAKAIN: Prepared for a 20% RallyThe chart of VISAKA provides delineates critical price thresholds that signify breakout point, along with specific support level that serve as indicators of where buying interest may manifest.
Additionally, the chart highlights regions likely to act as resistance point for future price ascension, allowing for informed decisions on entry and exit strategies.
Disclaimer: The information contained in this technical analysis report is intended solely for informational and educational purposes. It should not be interpreted as financial advice or a recommendation to buy or sell any security. Investors are strongly encouraged to conduct their own research and consult with a qualified financial advisor before making any investment decisions
