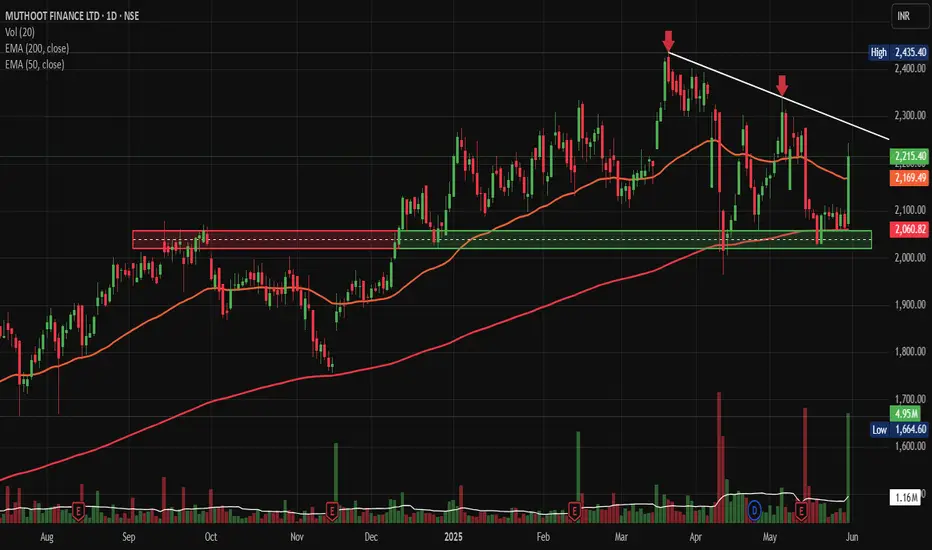
Muthoot Fin. bounce from Polarity LevelsNSE:MUTHOOTFIN made a good bounce from Polarity Levels with a huge candle again with high Volumes and closing above 50 DEMA, taking Support of 200 DEMA.
On the back news of the finance ministry seeking relaxation in the new rules on gold loans proposed by the central bank, they proposed that small ticket borrowers below 200,000 rupees should be excluded from the tighter rules to ensure speedy disbursements.
Price Action & Volume Analysis:
The stock has been consolidating in a well-defined range between ₹2,060-2,070 (support zone) and ₹2,400-2,435 (resistance zone) since April 2025. Today's strong move with above-average volume of 1.16M shares (compared to the 20-day average) suggests institutional participation and potential breakout momentum.
The price action shows a classic "coiling" pattern within the broader range, with decreasing volatility over the past few weeks, often a precursor to significant directional moves.
Key Technical Levels:
Support Zones:
- Immediate Support: ₹2,169-2,180 (50 EMA confluence)
- Strong Support: ₹2,060-2,070 (tested multiple times since April)
- Critical Support: ₹1,950-1,980 (October 2024 breakout level)
Resistance Zones:
- Immediate Resistance: ₹2,300-2,320
- Major Resistance: ₹2,400-2,435 (multiple rejections)
- Extension Target: ₹2,500-2,550
Base Formation & Pattern Recognition:
The stock has formed a robust Ascending Triangle pattern since the October 2024 lows. The horizontal resistance at ₹2,400-2,435, combined with rising support levels, creates a bullish continuation pattern. The triangle's apex is approaching, suggesting an imminent breakout.
Additionally, there's a clear Flag and Pole formation visible from the March-April rally, with the current consolidation representing the flag portion.
Moving Average Analysis:
- 50 EMA (Orange): Currently at ₹2,169, acting as dynamic support
- 200 EMA (Red): Located around ₹2,000, providing long-term trend support
- The stock is trading above both key EMAs, confirming the bullish trend structure
Trade Setup & Strategy:
Bullish Breakout Play:
Entry Strategy:
- Primary Entry: ₹2,320-2,330 (on volume breakout above resistance)
- Alternative Entry: ₹2,280-2,290 (pullback entry if direct breakout fails)
Target Levels:
- Target 1: ₹2,500 (measured move from triangle base)
- Target 2: ₹2,650 (extension target)
- Target 3: ₹2,800 (psychological resistance)
Risk Management:
- Stop Loss: ₹2,150 (below 50 EMA and swing low)
- Risk-Reward Ratio: 1:2.5 to 1:3.5
Position Sizing:
Risk should only be 1-2% of portfolio capital, given the stop loss distance.
Volume Confirmation:
Today's volume spike to 1.16M shares is encouraging, representing nearly 25% above the average. This volume expansion, coinciding with price advancement, suggests institutional accumulation. Watch for sustained volume above 1M shares for breakout confirmation.
Sectoral & Fundamental Backdrop:
NBFC Sector Dynamics:
The Non-Banking Financial Company (NBFC) sector has been gaining traction due to:
- Improving the credit growth environment
- RBI's supportive regulatory stance
- Rising rural credit demand
- Digital transformation initiatives
Muthoot Finance Fundamentals:
- Dominant player in gold financing with 5,000+ branches
- Strong asset quality with minimal NPAs
- Consistent dividend payout history
- Beneficiary of rising gold prices and rural credit demand
- Digital initiatives expanding customer base
Macro Tailwinds:
- Monsoon predictions favouring the rural economy
- Wedding season demand for gold loans
- Formalization of the gold loan market
- Potential interest rate stabilization
Risk Factors:
Technical Risks:
- Failure to sustain above ₹2,300 could lead to range continuation
- Broader market correction could impact individual stock performance
- Sector rotation away from financials
Fundamental Risks:
- Gold price volatility affecting loan demand
- Regulatory changes in the NBFC space
- Competition from banks in the gold loan segment
My Take:
NSE:MUTHOOTFIN presents an attractive risk-reward setup with its ascending triangle breakout potential. The combination of strong fundamentals, sector tailwinds, and technical setup creates a compelling investment thesis. However, strict adherence to stop losses and position sizing remains crucial given the inherent market volatility.
The stock appears poised for a significant move, with the technical pattern suggesting a higher probability of an upside breakout. Traders should wait for volume confirmation above ₹2,320 levels before initiating positions.
Keep in the Watchlist.
NO RECO. For Buy/Sell.
📌Thank you for exploring my idea! I hope you found it valuable.
🙏FOLLOW for more
👍BOOST if you found it useful.
✍️COMMENT below with your views.
Meanwhile, check out my other stock ideas on the right side until this trade is activated. I would love your feedback.
Disclaimer: "I am not SEBI REGISTERED RESEARCH ANALYST AND INVESTMENT ADVISER."
This analysis is intended solely for informational and educational purposes and should not be interpreted as financial advice. It is advisable to consult a qualified financial advisor or conduct thorough research before making investment decisions.
50dema
KIMS - Chart of the Week, Forming XABCD Pattern Near Base.NSE:KIMS made a beautiful Structure on the Daily timeframe to Qualify for my Chart of the Week idea, it saw Decent Volumes around the marked Key Levels from where it regained its 50 DEMA-making MACD Trending up.
It is Forming an XABCD Harmonic Pattern near its Base and the D point is the likely target crossing Previous Highs.
About:
NSE:KIMS was Incorporated in the year 1973 and is one of the largest corporate healthcare groups in Andhra Pradesh and Telangana in terms of patients treated and treatments offered. The company offers multidisciplinary healthcare services with primary, secondary, and tertiary care across 2-3 tier cities and an additional quaternary healthcare facility in tier-1 cities.
Trade Setup:
This could be a good Positional Trade with Point C (474-508) Being a Major Support Zone and Point D (730) as a Likely Target as Per XABCD Harmonic Pattern Theory.
📌Thank you for exploring my idea! I hope you found it valuable.
🙏FLLOW for more
👍BOOST if useful
✍️COMMENT Below your views.
Meanwhile, check out my other stock ideas on the right side until this trade is activated. I would love your feedback.
Disclaimer: "I am not SEBI REGISTERED RESEARCH ANALYST AND INVESTMENT ADVISER."
This analysis is intended solely for informational and educational purposes only and should not be interpreted as financial advice. It is advisable to consult a qualified financial advisor or conduct thorough research before making investment decisions.

Good News Just Doesn't Stop Coming Out of IndiaOver the past few days, there has been a steady fall in Indian yields, largely due to fall in US yields and falling crude oil prices. The rupee has been stable for over a year now; it is this kind of predictability in the economyu that makes India an attractive investment destination vis-a-vis its peers.
As we approach Mahurat Trading, we are crucial resistance levels but the fundamentals and technicals appear to be building up for a rally.
No one can pre empt the markets, hence the indicator script linked below is useful. Whenever the current candle makes a lower low than the previous candle, it gets trigerred and buys. That way we keep buying on lows and pulling the average cost down.


Concept of Supply/Demand Trendline - 20% opportunity in 3MINDIA👑 Terms used if you don't know :
✣ Contraction pattern: A pattern starting with a broadening high candlestick and low candlestick and converging to a fixed point, these highs and lows created in between them are bulls vs bears fight going on inside the pattern and if it comes to the lower part of it, surely bulls will take it to the topmost point and vice-versa until one of them wins
✣ Structure and trend: Two types of trends that exist in the market today are uptrends and downtrends. Each type of trend tells a different story and has its own impact on a trader's success in the market. While uptrends show a series of higher highs and higher lows, downtrends show lower highs and lower lows
✣Breakout: Breakouts are commonly associated with ranges or other chart patterns, including triangles( HERE WE WILL SEE THIS ONE ), flags, wedges, and head-and-shoulders. These patterns are formed when the price moves in a specific way which results in well-defined support and/or resistance levels. Traders then watch these levels for breakouts
✣ RSI DIVERGENCE: A bullish divergence occurs when the RSI creates an oversold reading followed by a higher low that matches correspondingly lower lows in the price. This indicates rising bullish momentum, and a break above oversold territory could be used to trigger a new long position.
✣ Supply/ Demand: In the supply zone, the prices are higher than the bid price, and in the demand zone, they are lower. The bid price is what a trader is willing to pay for a stock
👑 Important levels ( also most of it depends on your entry and mindset during trading hours )
✣ Risk of 4-5% at the entry-level of 21500 ( approx trade as per the breakout candle ) - entry possible on 1hr and 2hr charts
✣ Targets can be 20% from the buy point ( the top point of the triangle as the target )
👑 Comment your thoughts and queries regarding anything on this analysis of mine, feel free buddy :)
⌛ Motivational and psychological area ⌛
✣Trade only if you are in the right mindset, if you have been emotionally weak for some time, take your time and don't trade, trade with a happy and + mindset only.
✣If you want to make money, firstly be prepared to lose it, only that much which you can afford and that much by which you can make a mistake again, learn from them and grow
✣Don't lose hope and keep grinding
✣I have seen my friends on youtube streaming games with watching 10, constantly they streamed for a year or two and now they are buzzing with 1k to 2k watching daily.
✣Focus on the process, you are here to make money not stupid decisions and lose it all
✣No one will help you climb the mountain, few will tell the path, so follow good people, make good mentors and make good decisions and choices in the stock market.
✣Believe in yourself :)
🎓🎓 Some info about me :)
➼My name is Apoorv and I am a 2nd year Engineering student, I want to pursue trading as my career, and thus whatsoever setups or trades I potentially see on my charting platform, I post it here and share them with you all.
➼I hope you will love my simple analysis style.
➼Feel free to suggest your view on this as learning is earning here :)
➼I take my trades on my Zerodha account :)
➼I don't take all the trades I post
➼These charts are my and only my work, my thought process, just from an educational point of view and no calls.
☃☃☃☃ Thank You Have a Nice Trading Day ☃☃☃☃

SBIN - Perfect 50dema Support Structure 🔰 MY thought process :
⭐After a good breakout and reversal on the D chart now this beauty is on ATMs
⭐I see good Trendline support on 30mins and a possible good setup on 15mins :)
⭐A very decent trading setup would be activated when it breaks this small trendline on 15 min TF :)
⭐Trade type: swing
⭐Pattern: Ascending triangle on small TF with a bullish structure
⭐Buying on the breakout and selling on 1st fibo extension or 1 to 2 pivot points can be taken :)
⭐Risk will be minimal, SL below your entry candle, reward: Pivot points or the marked level
⭐When not to trade this pattern: if it gives a close below the 30 min supportive trendline or breaks the 50dema support on 15min don't trade leave the setup and trade :)
🔰Am I taking this trade now: No---Reason: Already in the trades of Naukri and PPL as posted last time :) also took a small position in Coal India today as posted guys :)
Also keeping an eye on JSW steel too seems bullish to me :), All the analysis already posted :)
🔰 {Some info}
➼My name is Apoorv and I am a 2nd year Engineering student, I want to pursue trading as my career, and thus whatsoever setups or trades I potentially see on my charting platform, I post it here and share them with you all.
➼I hope you will love my simple analysis style.
➼Feel free to suggest your view on this as learning is earning here :)
➼I take my trades on my Zerodha account :)
➼These charts are my and only my work, my thought process, just from an educational point of view and no calls.
<<<<<>>>>>

AUBANK - Contraction pattern below a very good support trendline🔰 MY thought process :
⭐Elliot waves for the uptrend ended while giving it an ATH now it has broken a serious trendline = downtrend but it's on its monthly support zones which were used to be resistance zones :)
⭐Also at 0.3 fibo so and making a good contraction pattern below the good uptrend line and 50dema, A buy would be initiated if it breaks the consolidation with power :)
⭐Risk will be: if it breaks the trendline for below = SL, Targets : at least ATM
🔰Am I taking this trade now: No---Reason: Already in the trades of Naukri and PPL as posted last time :) also took a small position in Coal India today as posted guys :)
Also keeping an eye on JSW steel too seems bullish to me :), All the analysis already posted :)
🔰 {Some info}
➼My name is Apoorv and I am a 2nd year Engineering student, I want to pursue trading as my career, and thus whatsoever setups or trades I potentially see on my charting platform, I post it here and share them with you all.
➼I hope you will love my simple analysis style.
➼Feel free to suggest your view on this as learning is earning here :)
➼I take my trades on my Zerodha account :)
➼These charts are my and only my work, my thought process, just from an educational point of view and no calls.
<<<<<>>>>>

SIYSIL Analysis | On demand of a follower :) ⭐A breakout on Month can be seen clearly if it sustains on these levels for Monday too :)
⭐Dynamic supports from 50 dema is been taken multiple times (once broken with a power candle = gap up next day above it )
⭐My calculated speculation is: a **close** above today's red candle with volume more than normal on 15min = a breakout from the pattern :), the risk gets minimal as u will exit the trade if it comes back to the triangle, then chances of manipulation increases and rewards = well if it sustains these lvls for the month than for upcoming days it might touch 362 lvls too, the time cant be predicated :)
⭐If someone takes the trade do see the Rsi too, if a close above the prev high takes place with RSI above 70 then trade will go smooth as a higher high on price with higher RSI will be made ( be careful with RSI divergence in such trades )
