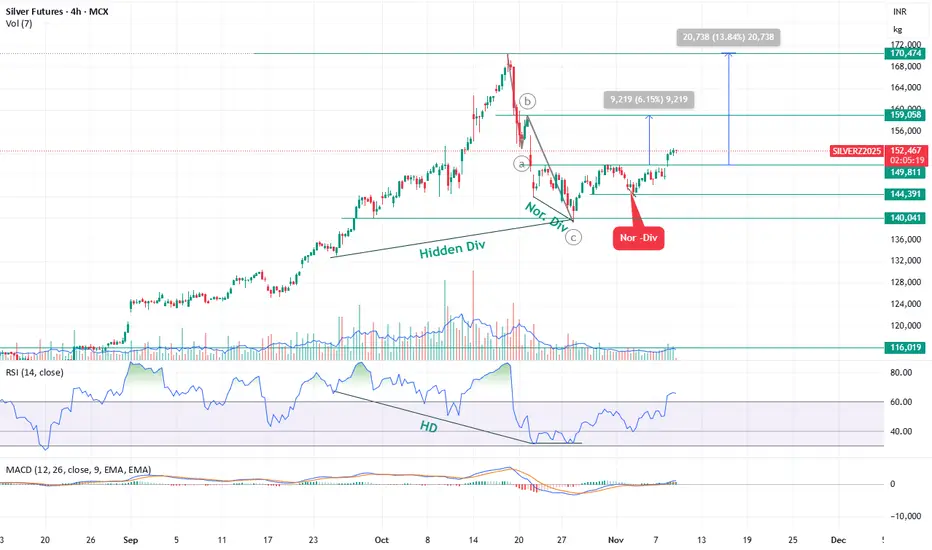
Bullish — Silver bounce expected toward ₹1,59,000 and ₹1,72,000 Silver Futures (SILVERZ2025 – 4H Chart) Technical Outlook
Elliott Wave Structure & Current Setup
Silver is currently trading in Wave 4, and the corrective phase appears to be complete.
Silver has completed its Wave 4 correction and has started a new impulsive leg (Wave 5).
A breakout above ₹1,50,000 has confirmed bullish momentum, supported by RSI and MACD signals.
📈 Upside Targets:
₹1,59,000 – first resistance / 6% upside
₹1,72,000 – extended target / 13.5% upside
⚙️ Supports:
₹1,49,000 – near breakout retest zone
₹1,44,000 – wave 4 base, invalidation below this level
5thwave
ETERNALHello & welcome to this analysis
A 3 years bull run could be coming to an end near 350-375 as it completes its 5 impulse waves.
This would be followed by wave 2 - ABC corrective retracement.
The view would be incorrect if it continues to rally beyond 400
All the best

INDHOTEL- 5th Wave Candidate heading for 360+++Attached: INDHOTEL Daily Live Market Chart as of 26th April 2023
An Ending Diagonal in Wave 4 marked as ABCDE and then Price has been moving Up since then, close to its All Time High
Look at Peer Hotel Stocks, they are also making New 52 Week Highs and Breaking Out so Indian Hotels too should follow the Hotel Sector in its journey up
Upside Target:
north of 360
and then take Reverse Fib Level of 4th Wave:
1.272
1.382
1.5
1.618

Short-Term Elliotical Approach to USDCAD Long.Hello Traders!
1. This analysis is based on the previously published longer-term analysis.
2. The count has been stated along with certain warnings and guidelines.
Do use proper risk management.
Happy Trading.
Profits,
Market's Mechanic.

Apollo tyresApollo tyres, is looking currently in good momentum upside, it has broken resistance trendline along with good intensity of volumes along with challenging upper Bollinger band, also trend indicator macd is supporting same trend right now.
As per Elliott wave projection it shows possibly we are in wave 3rd of wave 5th on daily time frame, which is a cautious sign to be ready for profit booking phase in near term and be very alert to book profits at near targets, also RK's mass psychological indicator is suggesting to go long, some highlights are shared below one can go through them to understand this study.
wave structure possibilities on daily chart
RK's mass psychological indicator signals positive
chart pattern breakout with good volumes
macd in daily positive crossover above zero line
macd running positive in weekly
rsi breakout in daily and its uptick above 60
price challenging upper bands on daily chart
dmi adx positive strenght
Most investors treat trading as a hobby because they have a full-time job doing something else.
However, If you treat trading like a business, it will pay you like a business. If you treat like a hobby, hobbies don't pay, they cost you...!
Disclaimer.
I am not sebi registered analyst.
My studies are for educational purpose only.
Please Consult your financial advisor before trading or investing.
I am not responsible for any kinds of your profits and your losses.

Asianpaint can go Down in Wave 5.Above is the view of #ASIANPAINT which can go downward from 3100-3120 range, of smaller blue Fibo 0.786 as one can see in above chart,
Also which can be the area to short the price & start of the 3rd mini wave of minute wave 5 .
Please take in consideration, If the high i.e. 3163 is broke then the counting is Invalid.
Note - View's provided are for Educational purposes only, please do your own Research.

HFCL Long Wave 5Hfcl going long in Wave 5 of Int wave. for short term buy there are two targets. if it brokes low of 63 it is invalid.
Note - View's provided are for Educational purposes only, please do your own Research.

Gland PharmaIt seems the stock might have completed its Wave 4 correction and now might be ready for Wave 5. Invalidation level is around 3310 and TGTS 4500+

DLF (Daily) - Bullish Flag DLF (Daily) - Bullish Flag
4th wave seems to be ending, making way for the 5th wave
Stochastic 14,3,3 is in positive crossover
+DI has just gone above the -DI in the Directional Movement Index (DMI) indicating the start of an uptrend
However before going long / buying, wait for the following to become a reality:
(1) Breakout of the resistance line (drawn in red)
(2) RSI to go over 60 and enter the overbought zone
(3) ADX to become uptick (though it is above 15 as of now)
Seems very likely that they will be achieved anytime soon.
Do not take anticipatory trade till you see them happening
Weekly tide is showing a morning star candlestick pattern formation

IEX (Daily) - Flag Breakout Indian Energy Exchange (IEX) - Daily
Flag breakout - 4th wave flag/triangle seems to have ended and it is the start of the 4th wave
MACD in the daily wave and weekly tide is uptick
RSI is well above 60 in the overbought zone
Stochastic 14,3,3 is in positive crossover
+DI is above -DI and the ADX is above 15 in the Directional Movement Index (DMI)
Seems to be a decent case for going long / buying

Canara Bank (Daily) - Flag Breakout Canara Bank (Daily) - Flag Breakout
Seems to have entered the 5th wave after the end of 4th wave flag / triangle
RSI is above 60
Stochastic 14,3,3 is in positive crossover
+DI is above the -DI in the Directional Movement Index (DMI)
It will be ideal to wait for the ADX to become uptick as well before going in in this though its value is above 15
On the weekly tide too, it is showing a buying signal
Target 270.45

Mindtree (Hourly) - Double Bottom Chart Pattern Mindtree (Hourly)- Double Bottom Chart Pattern
Current market price - 4653
Target - 4893
Bollinger band is challenged on the upper end
RSI is above 60
Stochastic 14,3,3 is in positive crossover
ADX is above 15 and +DI is above -DI in Directional Movement Index
On the daily tide, all indicators / oscillators are positive too
MACD of the daily tide is uptick
Elliott wave count
Price is in 3rd wave in hourly timeframe
Price is in 5th wave in daily timeframe

Bajaj Finance (Hourly) - Inverted Head & Shoulders Chart PatternBajaj Finance (Hourly) - Inverted Head & Shoulders
Current market price - 7360
Target - 7813.20 (depth of the head)
Price has done breakout of the inverted head & shoulders chart pattern neckline
Bollinger band is challenged on the upper end
RSI is above 60
ADX is above 15 and -DI is above +DI in the Directional Movement Index (DMI)
All indicators / oscillators on the daily tide look good too
In fact, on the daily timeframe, the price has entered the 5th wave

HDFC Bank (Hourly) - Inverted Head & Shoulders Chart Pattern HDFC Bank (Hourly)
Chart Pattern - Inverted Head & Shoulders
Target - 1610 (Depth of the head)
Seems to have retested the neckline after the breakout
Has entered the 3rd wave in hourly and 5th wave in daily
RSI is above 60 and the stochastic 14,3,3 is in positive crossover
Bollinger band is challenged on the upper end
+DI is above the -DI in Directional Movement Index (DMI) with ADX above 15
All indicators / oscillators are positive in hourly and daily time frame
On weekly timeframe, thought the MACD is downtick but we have an early buy signal of stochastic 5,3,3 being in positive crossover

GMR Infra - Trendline Breakout GMR Infra - Daily
Seems to have broken out for the 5th wave
Suggested buying is not immediate but after it retraces for 2nd of 5th and then gives bullish reversal for 3rd of 5th
You may be able to buy it cheaper then
Watch the hourly ripple for a suitable buy signal
Price action looks good in the weekly timeframe too

Zee Entertainment - Trendline Break Out Zee Entertainment - Daily
4th wave has broken into 5th wave
Currently it seems to be in the 3rd of 5th as per the Elliott wave count
Bollinger band is challenged on the upside
RSI is above 60 and ADX is above 15
According to the post triangle thrust (PTT), the target is around 408
Price action looks good on the weekly and monthly timeframes too

Indiabulls Housing Finance - Trendline Breakout Indiabulls Housing Finance (Daily) - Trendline Breakout
It seems to have entered the 5th wave after a long 4th wave
And currently it seems to be in the 3rd internal wave of the 5th main wave as per the Elliott wave count
This is the fifth attempt in which it has done a breakout of the long slanting trendline as shown in the image attached
RSI is above 60, Bollinger Band is challenged on the upper side and the ADX is well above 15
On the weekly tide, all indicators / oscillators are positive as well

Elliott Wave - Impulse with 5th wave extensionWhen ever if we see a 5th wave extending . We need to look at the following 1. Slope of wave 1 > wave 2 > wave 3 .
1.So trend channel will look like a megaphone pattern .
2. Wave 4 has to be deep becoz wave 4 will behave like wave 2 .
3. wave 5 may be 1:1 frm wave 1 to 3 extended from the end of wave 3 . (More on this later with a good example)
But most important
1. THE EXTENDED WAVE 5 SHOULD BE RETRACED BY AT LEAST .618% very fast and furious .
2. WAVE 5 SHOULD NOT BE COMPLETELY RETRACED IF THE IMPULSE HAS TO CONTINUE FURTHER .
So that way you will know stoploss . We will discuss trading edges later as I use 20/50 EMA and most top Ichimoku Kinko Hyo . I have sent a time cycle on this chart based on Ichimoku .
So price action tomorrow is extremely important .
Regards

BAJAJ FINANCEmoving to complete 5th wave
Stop loss will be pink line
3rd wave has retraced from 50%
you can also see bullish candlestick pattern at support double so we expect a good rally in Bajaj finance
>>>>>>>>>>>>>>
thanks....
>>>>>>>>>>>>>>

BSE Stock is getting ready for 5th Wave rally. Above 630 momentum may accelerate. Keep SL around 535 for the TGTs of 750-780

Bharti Airtel Trend Analysis !!TREND ANALYSIS & TRADE SETUP !
ELLIOTT WAVE ANALYSIS !!
Follow Chart Instruction.
Do not be Hurry for entry.
Wait for Proper Entry Setup.
Buy/Sell with Best Risk Reward.
Educational Chart Only.
Wait for ENTRY CONFIRMATION !
Reward is 8-10 times .

HDFC ---- entry in 5th waveONLY FOR RISKY TRADER .... BUY ONLY 5 shares(warning)
Nifty is also just to reach 14070-14050 as you can see my previous chart
and HDFC - 2370
it is a good chance to buy HDFC which is going to long with nifty...
short term target -- 3000

SBIN: Elliott Wave AnalysisIn this video I have discussed SBIN daily chart in details. Please check out and let me know your valuable feedback.
