BTC short term Semi Triangle Bearish Structure BTC keeps creating a bearish semi-triangle after recovery from 59.7k, suggesting bearish momentum is still in place. In order to create a bullish divergence btc needs to go down one more round, let's say around 57k, and print bullish RSI onthe daily, that will Create a chance for rellief Rally. Which might cover the CME gap around 80k.
1. Bias - Bearish
2. Price Target 59.8k - 57.8k
3. Current Structure - Semitriangle Formation
4. Probability - 60%
Community ideas

Gold (XAUUSD) – 1H Technical Analysis
Gold has broken a major ascending trendline, signaling a short-term shift from bullish structure to corrective/bearish.
🔎 Market Structure
Clear trendline breakdown after multiple higher lows. Strong bearish impulse from the 5080–5100 resistance zone. Price currently attempting a pullback after sharp rejection
📉 Key Resistance Levels
5000–5030 → Immediate selling zone
5040 (0.786 Fibonacci)
5100–5140 → Major supply zone
📈 Key Support Levels
4980 (0.5 Fibonacci)
4920
4880 → Major support base
📌 Outlook
Below 5000–5030, selling pressure may persist. Pullbacks into resistance zones could provide short-term selling setups. A sustained break and hold above 5030 would weaken the bearish bias.
⚠️ Momentum is corrective after a strong dump — expect volatility and structured pullbacks.
Trade with confirmation and proper risk management.

What Most Traders Still Don’t Understand About Market CyclesMarket Cycle Logic Most People Miss
1) Core Idea
The market follows a simple macro chain:
Income visibility ↓ → Confidence ↓ → Spending ↓ → Credit quality ↓ → Cyclical sectors weaken
This is not theory — this is how institutional macro models actually work.
In economic terms, this phase is called a demand-compression stage of the business cycle.
2) How the Effect Spreads Across Sectors
Banks — Early Signal Sector
When job security weakens, people delay EMIs.
When businesses slow down, working capital stress rises.
Result → credit costs rise and loan growth slows.
Banks usually underperform quietly first, before any big fall.
Autos — Confidence Indicator
Auto buying depends on confidence and credit.
Weak sentiment → people postpone purchases.
High rates → affordability drops.
Dealers cut inventory.
Auto stocks usually weaken before sales numbers fall.
Housing / Realty — Rate + Confidence Sensitive
Housing needs:
long-term confidence
stable income
reasonable interest rates
If uncertainty rises → buyers delay decisions → real estate slows.
Luxury & Travel — Sentiment Barometers
These are the first expenses people cut.
When uncertainty rises, spending shifts from:
Wants → Needs
So discretionary sectors weaken early.
Insurance — Often Misunderstood Sector
Insurance inflows depend on:
disposable income
savings surplus
agent productivity
When cash flow tightens → new policy buying slows.
3) The Missing Piece Most People Ignore
Professional investors track three macro forces:
Factor Why It Matters
Interest Rates Higher rates reduce liquidity
Liquidity Liquidity drives risk assets
Dollar Strength Controls global capital flow
When all three tighten together → risk-off environment
4) How Market Cycles Actually Work
Formal economic cycle:
Expansion → Peak → Contraction → Trough → Expansion
Trader version:
Liquidity → Euphoria → Tightening → Panic → Reset → Liquidity
Markets don’t move because of news.
They move because of liquidity cycles.
News is usually just a narrative built around the move.
5) Geopolitics Example
Events like discussions about countries shifting currency systems are not random headlines.
They signal:
global trade realignment
currency stability attempts
geopolitical repositioning
Markets interpret this as:
“Capital flows may change.”
And capital flow is what moves markets.
6) Important Rule Professionals Follow
Leading sectors weaken first. Lagging sectors later.
Typical slowdown order:
Tech → Financials → Cyclicals → Consumption → Defensives last
When defensive sectors also start falling, it often signals the cycle is near its bottom.
7) Final Takeaway
Market Truth Most People Ignore
When income visibility falls → confidence falls
When confidence falls → spending falls
When spending falls → credit stress rises
And when credit stress rises — cyclical sectors weaken first:
Banks, Autos, Realty, Luxury, Travel, Insurance
Markets don’t run on headlines.
They run on liquidity cycles.
Boom → Slowdown → Fear → Reset → Boom
Smart money doesn’t chase stories.
It tracks cycles.

Part 5 Option Trading Strategies Key Components of Option Trading
- Underlying Asset: The security (stock, index, commodity, etc.) the option is based on.
- Strike Price: Fixed price to buy/sell the asset.
- Expiry Date: Last day the option can be exercised.
- Premium: Price paid for the option contract.
- Lot Size: Number of shares/contracts per lot.
- Option Type: Call (buy) or Put (sell).

Part 1 Technical Analysis Vs. Institutional Option Trading BEST OPTION STRATEGIES TRADING
Intraday (same-day) strategies require:
Low time decay impact
High liquidity
Quick directional moves
Defined stop-loss rules

Sensex - Expiry day analysis Feb 11This week, the price moved in a narrow range daily and did not give good trading opportunities for option buyers. Yesterday and today, the movement happened within the range of 84000 to 84500. 84000 is acting as a strong support, and 84500 is acting as a strong resistance.
Buy above 84100 with the stop loss of 83960 for the targets 84220, 84360, 84480 and 84600.
Sell below 83800 with the stop loss of 83940 for the targets 83780, 83640, 83520, 83400 and 83260.
Expected expiry day range is 83600 to 84400.
Always do your analysis before taking any trade.

Gold Trading Strategy for 13th Feb 2026🟡 GOLD TRADING SETUP
📈 BUY SETUP (Bullish Breakout)
🔔 Condition:
Buy only if price breaks and closes above the High of the 1-Hour Candle and sustains above 5003
✅ Entry: Above 5003 after proper candle close
🎯 Targets:
• 🎯 T1 – 5015
• 🎯 T2 – 5028
• 🎯 T3 – 5045
🛡 Stop Loss: Below the breakout candle low (or based on your risk management strategy)
📌 Strategy Logic:
A strong 1-hour candle close above resistance indicates bullish momentum continuation. Volume confirmation strengthens the breakout reliability.
📉 SELL SETUP (Bearish Breakdown)
🔔 Condition:
Sell only if price breaks and closes below the Low of the 15-Minute Candle and sustains below 4945
✅ Entry: Below 4945 after proper candle close
🎯 Targets:
• 🎯 T1 – 4930
• 🎯 T2 – 4915
• 🎯 T3 – 4899
🛡 Stop Loss: Above the breakdown candle high (or as per your risk management)
📌 Strategy Logic:
A confirmed 15-minute breakdown below support suggests short-term bearish pressure and potential continuation move downward.
⚠️ RISK MANAGEMENT RULES
💰 Risk only 1–2% of capital per trade
📊 Avoid trading during major high-impact news
⏳ Wait for proper candle close confirmation
📉 Trail stop loss once first target hits

Part 2 Intraday Institutional Trading Strategies Basic Strategies
- Long Call: Buying a call option, bet on price ↑.
- Long Put: Buying a put option, bet on price ↓.
- Covered Call: Selling a call on stock you own, generate income.
- Protective Put: Buying a put on stock you own, hedge downside risk.
Advanced Strategies
- Straddle: Buying a call and put at the same strike, profit from big moves.
- Strangle: Buying a call and put at different strikes, profit from big moves.
- Iron Condor: Selling a call and put, buying further OTM call and put, profit from low volatility.
- Butterfly Spread: Buying and selling calls/puts at different strikes, profit from price staying within range.

Part 1 Intraday Institutional Trading Strategies Types of Options Trading
Options trading involves various strategies and types, catering to different market views and risk appetites. Here's a comprehensive overview:
1. Call Option- Right to Buy: Gives the buyer the right to buy the underlying asset at the strike price.
- Use Case: Bullish on the market, expecting the price to rise.
- Profit: If the underlying price > strike price + premium paid.
2. Put Option- Right to Sell: Gives the buyer the right to sell the underlying asset at the strike price.
- Use Case: Bearish on the market, expecting the price to fall.
- Profit: If the underlying price < strike price - premium paid.

Part 2 Technical Analysis Vs. Institutional Option TradingDirectional Intraday Strategy: ATM/ITM Option Buying
Best when:
✔ Strong momentum
✔ Trend day
✔ Breakout or breakdown
How it works
Identify trend using 5-min chart
Use VWAP + 20 EMA confirmation
Enter ATM or ITM option
Keep tight SL based on premium
Why it works
ITM/ATM options have better delta (0.5–0.7), giving faster premium movement.
Risk
Time decay hurts if market stays flat.

Groww - Approaching Confluence ResistanceGroww :
Looking Good for a Triangle Breakout
185 -189 is the region of confluence resistance, Breaking is crucial for upmove towards 200+ zone

Part 3 Technical Analysis Vs. Institutional Option TradingBreakout Strategy (Options Buying)
Perfect during:
✔ High volatility
✔ News-driven moves
✔ Index breakout/breakdown
Setup
Mark key levels: yesterday high/low, intraday range
Wait for high-volume breakout
Buy ATM call for upside, ATM put for downside
Benefits
Best RR ratio. Trend moves explode premiums quickly.

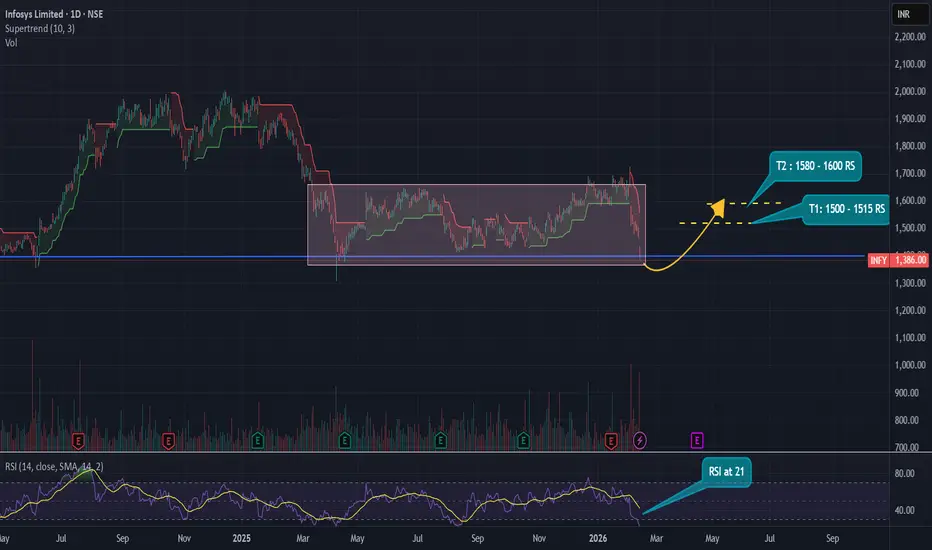
Infosys LimitedInfosys Technical Outlook :
Infosys has been consolidating within the ₹1400–₹1700 range over the past year. Currently, the stock is in the oversold zone, with the RSI at 21, and is testing a strong support level around ₹1400.
From a mid-term perspective, the setup looks attractive:
- Target 1: ₹1500–₹1515
- Target 2: ₹1580–₹1600
This implies a potential return of 9–12% from current levels, provided the support holds.
Disclaimer : The Above shared Content is for information and education purposes only and should not be treated as investment or trading advice. Im not SEBI registered, Contact your financial advisor before any investment.
Trendline breakout with high volumeA long trendline breakout at very low levels could reverse the market structure from lower lows to higher highs
According to your risk , 3 targets are locked with strict stoploss

BHARAT FORGE @1726Not a SEBI registered, just sharing idea. Investment idea BF@1726 on the brink of giving breakout from rounding bottom @1810. Target short term-2700, long term target-3550. Daily & weekly >70 & monthly RSI @67. Entered bull trend.

NIFTY: detailed Trading levels and Plan for 13-Feb-2026📅 Nifty 50 Trading Plan: 13-Feb-2026
Current Context: Nifty closed at 25,796.15 on Feb 12. The index is currently testing a "make-or-break" support zone between 25,700 and 25,782.
🟢 Scenario 1: Gap Up Opening (Above 25,900)
A Gap Up of 100+ points would place Nifty above the crucial 25,900 mark, which was Thursday's "open-equals-high" resistance.
🔸 Plan Action:
Wait for Confirmation: Do not jump into longs immediately. Wait for the first 15-minute candle to sustain above 25,907.
Bullish Case: If price holds above 25,900, the next target is 26,000, followed by 26,077 (Last Intraday Resistance).
Educational Logic: Reclaiming 25,900 signifies that bulls have neutralized the previous day's selling pressure. However, 26,000 has heavy call writing, making it a "profit-booking" zone rather than a "buy-and-hold" zone.
🟡 Scenario 2: Flat Opening (Range 25,750 - 25,850)
A flat opening suggests indecision and potential consolidation within the Opening Support/Resistance zones shown on your chart.
🔸 Plan Action:
Range Bound Play: Avoid big directional bets. Look for reversals at 25,750 (Support) or 25,880 (Resistance).
Breakout Strategy: A decisive move above 25,850 with volume could lead to a test of 25,953. Conversely, staying below 25,800 keeps the bias slightly bearish.
Educational Logic: Flat openings after a distribution day (like Feb 12) often result in "sideways to volatile" movement as the market digests the previous sell-off.
🔴 Scenario 3: Gap Down Opening (Below 25,700)
A Gap Down of 100+ points would push Nifty below the 25,700 support level, which is a major red flag.
🔸 Plan Action:
Bearish Case: If the market opens below 25,700 and fails to recover quickly, the next major support is the 20-day Moving Average at 25,479 or the Last Intraday Support at 25,602.
Panic Selling: Watch for high volume. If the 25,700 zone is broken, "Put Unwinding" could accelerate the decline.
Educational Logic: Opening below a confluence of supports (50-DMA and previous gap areas) typically triggers a "Sell-on-Rise" sentiment. Traders should look for resistance at the Gap Fill area (25,750-25,780) to initiate shorts.
🛡️ Risk Management Tips for Options Trading
🔹 Capital Protection: Never risk more than 2-5% of your total trading capital on a single option trade.
🔹 The 9:30 AM Rule: Avoid trading in the first 15 minutes. Let the "opening volatility" settle to identify the true trend.
🔹 Avoid Naked Options: In high volatility, use Spreads (like Bull Call or Bear Put) to cap your maximum loss.
🔹 Stop Loss is Non-Negotiable: For Nifty options, keep a strict SL based on index levels. If Nifty breaks your support/resistance level, exit the option immediately regardless of the premium price.
🔹 Mind the IV: High Implied Volatility (IV) inflates premiums. Buying options when IV is peaking can lead to losses even if the direction is right.
📝 Summary & Conclusion
The Nifty 50 is currently at a critical junction. The 25,700 - 25,782 zone is the "Lakshman Rekha" for bulls. A sustained move above 25,907 is required to revive bullish momentum. Until then, the market structure remains "Sell on Rise" due to the lower-high, lower-low formation on the daily chart. Stay disciplined and prioritize capital preservation over high-risk profits.
⚠️ Disclaimer: I am not a SEBI registered analyst. This post is for educational purposes only. Trading in equities and derivatives involves high risk. Please consult a certified financial advisor before making any investment decisions.

XAUUSD (H1) – Structural Breakdown ActiveXAUUSD (H1) – Structural Breakdown Still Active | Medium-Term Sell Continuation Into Weekend
Gold is attempting to stabilize after a sharp downside expansion, but the H1 structure still points to sell-side control. The latest bounce is corrective and is currently rotating back into former support that has flipped into supply. Until price reclaims that supply with clear acceptance, the higher-probability path remains a continuation lower into liquidity.
Market Structure
After topping out, price delivered a decisive bearish impulse, breaking prior intraday support and printing a deep displacement leg. That move typically leaves two things behind:
Unfilled supply / imbalance above (where sellers first stepped in)
Sell-side liquidity magnets below (where the market tends to rebalance)
The current rebound looks like a standard retest phase, not a confirmed reversal. H1 is now vulnerable to printing lower highs unless price can regain the broken structure.
Key Zones To Watch (from the chart)
1) Primary Sell Zone (support flip + Fibonacci 0.382)
5,020 – 5,060
This is the most important area for bearish continuation. It combines a support-to-resistance flip and the 0.382 retracement zone. If price revisits this range and shows rejection (weak closes / long upper wicks / failure to hold above), it favors the next leg down.
2) Retest / Reaction Band
4,960 – 4,980
This is a lower supply pocket where price can stall intraday. Acceptance below this band strengthens the bearish path and keeps the market “heavy”.
3) First Downside Magnet (liquidity buy scalping zone)
4,830 – 4,860
This is the nearest liquidity pool below. If the sell setup triggers from supply, this zone is the first logical objective for the market to test and clear.
4) Medium-Term “Reset” Zone (deeper liquidity)
4,720 – 4,750
If 4,830–4,860 fails to hold or gets swept clean, the structure allows for a deeper slide into this zone. This is where a more meaningful reaction can occur, but only after liquidity is collected.
Medium-Term Bias (Into Weekend)
The chart is currently pricing a bearish sequence: impulse down → corrective bounce → continuation risk. For the bearish idea to remain valid, price must stay capped below 5,060. If that cap holds, the market can continue rotating lower to clear sell-side liquidity into the weekend.
Bullish invalidation condition: A clean H1 reclaim and acceptance above 5,060 would weaken the bearish continuation thesis and open room for a broader recovery.
Execution Notes
Avoid buying in the middle of the retracement. The market is still inside supply territory.
The cleanest read is at the levels: wait for rejection at 5,020–5,060 or confirmation of acceptance above it.
Into weekend sessions, liquidity sweeps are common. Let price hit the zone first, then react.
Bottom Line
As long as gold trades below 5,020–5,060, the move up is still corrective and the market remains positioned for another downside rotation toward 4,860, potentially 4,750 if liquidity opens.
Follow structure. Trade levels. Ignore noise.

XAUUSD (Gold) | BEST TRADING SETUP | 13th Feb'2026Gold is trading near 4957 with short-term bearish pressure, while the higher timeframe trend remains bullish.
Lower timeframes show selling momentum, indicating a possible correction. However, the overall structure on Daily & Weekly charts still supports buying on dips.
Key Levels
Resistance: 4975 | 5000–5015
Support: 4930 | 4917 | 4889
Scenarios
🔼 Bullish: Break & sustain above 5000 → 5035+
🔻 Bearish: Breakdown below 4930 → 4917 → 4889
Volatility remains high — trade with proper risk management.
⚠️ Disclaimer:
This analysis is for educational purposes only and not financial advice. Trading in Forex/Commodities involves high risk. Please consult your financial advisor before taking any trade.

A-Book vs B-Book: What Every Retail Trader Needs to KnowMost retail CFD traders have never even heard the terms “A-Book” and “B-Book,” yet almost all of them are directly affected by how these models work. Your broker’s choice between the two can change the prices you see, how your orders are filled, and even whether your stop loss gets hit. Let’s break it down so you know exactly what’s going on behind the scenes.
█ What is A-Book?
An A-Book broker routes your orders straight to external liquidity providers, such as banks, market makers, or directly to an exchange in the case of futures or spot markets. Your broker is essentially the middleman, passing your trade along and matching it with a real counterparty.
⚪ How they make money:
Spreads (the difference between the bid and ask prices).
Commissions on each trade.
Occasionally a small markup on the feed.
Because they don’t profit when you lose, an A-Book broker’s ideal client is a trader who trades frequently and consistently, your activity is their revenue stream.
█ What is B-Book?
A B-Book broker keeps your trades “in-house,” meaning they take the other side of your position. If you buy, they sell; if you sell, they buy, but all within their own system. Your trades don’t reach the real market at all.
⚪ How they make money:
Your losses are their profits.
They may still earn on spreads and commissions, but the main income is the net loss of their client base.

AUDJPY – Bullish Reversal From Trendline SupportAUDJPY is reacting strongly from a major ascending trendline support on the 1H timeframe. Price swept liquidity below the structure, tapped into the demand zone, and immediately rejected — signaling buyer strength.
we entered long around 108.180, which aligns perfectly with the technicals.
📈 Why This Is a Bullish Setup
Price tapped the HTF trendline and respected it
Multiple liquidity sweeps beneath the zone, trapping sellers
Formation of a bullish rejection wick right at support
Price is still inside a discount area, ideal for longs
Recent bearish attempts failde to close below the trendline
Strong probability of a bullish push toward 109.20 – 109.50 liquidity zones
This is a classic trendline + demand + liquidity sweep confluence setup.
📋 Trade Parameters
Entry: 108.180 (executed)
Stop-Loss: ~55 pips (below liquidity sweep + structure low)
Take-Profit: ~110 pips (towards upper liquidity & imbalance zones)
Risk-to-Reward: ~1:2

XAUUSD – Trendline Break and RetestXAUUSD – Trendline Break & Retest: Bearish Signals Emerging | Lana ✨
Gold is showing early signs of structural weakness after breaking below the ascending trendline. The recent rebound appears corrective rather than impulsive, with price now retesting a key sell-side FVG zone near the former trendline support.
This shift suggests short-term momentum is tilting bearish unless buyers quickly reclaim higher ground.
📌 Technical Overview
Trendline breakdown: The rising structure has been invalidated, shifting short-term bias toward corrective-bearish conditions.
FVG sell retest: Price is reacting around the imbalance zone aligned with the broken trendline — a classic supply confirmation area.
Liquidity below: Sell-side liquidity remains uncollected beneath current levels, increasing the probability of a downside sweep before any sustainable recovery.
🔍 Key Levels to Watch
5,000 – 5,020: Immediate sell zone and retest area. Rejection here reinforces bearish continuation.
4,870 – 4,900: First liquidity objective and potential reaction zone.
4,790 – 4,793: Deeper FVG buy zone. A key demand area if selling accelerates.
4,600 – 4,620: Major liquidity pool and stronger higher-timeframe support.
📉 Scenario Outlook
Scenario A – Bearish Continuation (Preferred)
If price rejects the 5,000–5,020 zone, downside expansion toward liquidity levels remains the higher-probability path.
Targets: 4,900 → 4,870 → 4,793 → 4,620.
Scenario B – Corrective Bounce
If price sweeps liquidity around 4,790 and shows strong bullish reaction, a recovery toward 4,900–5,000 is possible. However, this would remain corrective unless 5,020 is decisively reclaimed.
🧠 Market Perspective
A break of trendline structure often leads to a retest before continuation. Unless gold regains the 5,020 area with strength, current consolidation looks like preparation for a liquidity-driven move lower.
✨ Stay patient, respect structure, and let price confirm direction before committing risk.

gold spot or silver update at the time of cpi datagold spot overview-- usa cpi data today at 7 pm at that time eyes on level----- gold spot hurdle 4986--91$ if market sustain above after cpi data than expect to up side 5035--5060--5080$ again hurdle 5110$ till no sustain above or close market revert--------- where support 4900-4890$ if market sustain blow than down side move 496-4930 expect---------- silver spot eyes on 77.86$ if market sustain above up side 79--80$+++ or if hold blow market soon 74--72$--70$ cmp 76.60$---- if market come up77.20--77.50 near can make short side with hurdle sl 77.86$-- yes its chance to short position or only risky player or mini trader can make @ market entry with sl

Commodities and Alternative Assets1. Commodities
Definition
Commodities are raw materials or primary agricultural products that can be bought and sold. They are standardized and interchangeable, meaning one unit is essentially the same as another unit of the same grade. For example, one barrel of crude oil is equivalent to another barrel of the same type and quality.
Commodities are typically traded on exchanges such as the Chicago Mercantile Exchange (CME) or the London Metal Exchange (LME).
Types of Commodities
1. Energy Commodities
Crude oil
Natural gas
Coal
Gasoline
Energy commodities are highly sensitive to geopolitical events, supply disruptions, and global demand cycles.
2. Precious Metals
Gold
Silver
Platinum
Palladium
Gold is often viewed as a “safe haven” asset during economic uncertainty or inflationary periods.
3. Industrial Metals
Copper
Aluminum
Nickel
Zinc
These are closely tied to industrial production and infrastructure development.
4. Agricultural Commodities
Wheat
Corn
Soybeans
Coffee
Sugar
Cotton
Prices are affected by weather patterns, seasonal cycles, and global consumption trends.
Ways to Invest in Commodities
Physical Ownership
Buying physical gold, silver, or other tangible goods.
Futures Contracts
Agreements to buy or sell a commodity at a future date at a predetermined price. Futures are highly leveraged and commonly used by traders and hedgers.
Exchange-Traded Funds (ETFs)
Commodity-based ETFs track the price of a specific commodity or a basket of commodities.
Commodity Stocks
Investing in companies that produce commodities (e.g., oil companies, mining firms).
Mutual Funds and Index Funds
Provide diversified exposure to commodity markets.
Characteristics of Commodities
Inflation Hedge: Commodities often rise in price when inflation increases.
Low Correlation with Stocks/Bonds: They can reduce portfolio volatility.
High Volatility: Prices fluctuate due to global supply-demand imbalances.
Cyclical Nature: Prices move in long-term cycles tied to economic expansion and contraction.
Advantages of Commodities
Portfolio diversification
Protection against inflation
Opportunity for high returns during commodity booms
Hedge against currency depreciation
Risks of Commodities
Price volatility
Geopolitical risk
Weather risk (agriculture)
Storage and transportation costs (for physical commodities)
Leverage risk in futures trading
2. Alternative Assets
Definition
Alternative assets are financial assets that do not fall into traditional categories like stocks, bonds, or cash. They often require specialized knowledge and may be less liquid than conventional investments.
Alternative investments are commonly used by institutional investors, hedge funds, and high-net-worth individuals.
Major Types of Alternative Assets
1. Real Estate
Includes residential, commercial, and industrial properties. Investors may earn income through rent and capital appreciation.
Direct property ownership
Real Estate Investment Trusts (REITs)
Real estate funds
2. Private Equity
Investment in private companies or buyouts of public companies. Investors aim to improve operations and sell at a profit.
Venture capital
Growth capital
Leveraged buyouts
3. Hedge Funds
Actively managed investment funds using complex strategies:
Long/short equity
Arbitrage
Global macro
Event-driven strategies
4. Infrastructure
Investments in public assets such as:
Airports
Toll roads
Utilities
Renewable energy projects
These provide stable, long-term cash flows.
5. Commodities (as Alternatives)
Though commodities are their own asset class, they are often categorized under alternative investments.
6. Collectibles and Tangible Assets
Art
Rare coins
Wine
Classic cars
Antiques
Value depends on rarity, condition, and demand.
7. Cryptocurrencies
Digital assets like Bitcoin and Ethereum. Highly volatile but increasingly considered an alternative investment class.
Characteristics of Alternative Assets
Low Liquidity: Harder to buy and sell quickly.
Higher Return Potential: Often target above-market returns.
Higher Risk: Complexity and lack of regulation in some areas.
Less Transparency: Valuations may not be daily or publicly available.
Advantages of Alternative Assets
Diversification
Lower correlation with traditional markets.
Inflation Protection
Real estate and infrastructure often adjust with inflation.
Higher Yield Potential
Private equity and hedge funds can outperform public markets.
Access to Unique Opportunities
Investment in emerging industries and innovation.
Risks of Alternative Assets
Illiquidity risk
High fees (management and performance fees)
Valuation risk
Regulatory risk
Complexity and limited transparency
Role in Portfolio Management
Modern portfolio theory suggests diversification reduces overall risk. Commodities and alternative assets improve diversification because they behave differently from traditional equities and bonds.
Institutional investors such as pension funds often allocate:
5–15% to commodities
10–30% to alternative investments
The actual allocation depends on:
Risk tolerance
Investment horizon
Liquidity needs
Economic outlook
Conclusion
Commodities and alternative assets have become increasingly important components of modern investment portfolios. Commodities provide exposure to tangible goods essential to the global economy and offer inflation protection and diversification benefits. However, they are subject to high volatility and global economic forces.
Alternative assets encompass a wide range of investments including real estate, private equity, hedge funds, infrastructure, collectibles, and digital assets. These investments often provide opportunities for enhanced returns and risk diversification but come with challenges such as illiquidity, complexity, and higher fees.
For investors seeking to move beyond traditional stocks and bonds, commodities and alternative assets can enhance portfolio resilience and return potential. However, careful analysis, risk assessment, and strategic allocation are essential to successfully integrate them into a long-term investment strategy.
