#JKTYRE - Cup & Handle / IHNS BO in DTFScript: JKTYRE
Key highlights: 💡⚡
📈 Cup & Handle / IHNS BO in DTF
📈 Volume spike seen during Breakout
📈 MACD Bounce
📈 RS Line making 52WH
✅Boost and follow to never miss a new idea! ✅
⚠️ Important: Always Exit the trade before any Event.
⚠️ Important: Always maintain your Risk:Reward Ratio as 1:2, with this RR, you only need a 33% win rate to Breakeven.
⚠️Disclaimer: I am not SEBI Registered Advisor. My posts are purely for training and educational purposes.
Eat🍜 Sleep😴 TradingView📈 Repeat 🔁
Community ideas

NIFTY -Short Term Resistance and Major Support LevelsNIFTY :
Trading below its short term Moving averages 10DEMA &20DEMA lying at around 25920-25950
Its 50 DEMA at around 25750 is acting as a major support.
TREND LINE RES LEVELS
R1:25950 R2:26050 R3 :26150
TRADING STRATEGY-BUY
Level 1 : Any rebound from 25750 levels based on atleast 15 Min candle confirmation shall bounce to 25800/25850/25900
25900-25950 No Trade zone
If the Breakout at 25950 where its 10 DEMA &20 DEMA lies there is a possibility for a breakout Trade towards 26050.
If 26050 sustains on a closing basis shall expect a move towards 21150-200 band
TRADING STRATEG -SELL
If 25900 -950 does not hold likely to fall back to 25800-850 band
Decisive fall below 25700 likely to trigger a steep fall even towards 25500

TVSMOTOR- FLAG PATTERN BOTVS Motor has formed a classic flag pattern after a strong upward move. The sharp rise shows momentum, and the current sideways-to-down consolidation is the market cooling off, not reversing.
This structure usually represents continuation, where price digests earlier gains before the next move. As long as price stays within the flag, there is no edge in taking random entries.

Gold view For London Session Gold to Take for Long for Liquidity Suppourt At downside and marekt strucutre is bullish on 5 min tf as well as at good fib level

Why Syngene International is a Long-Term Growth Play!Syngene International isn’t just another stock — it’s one of India’s leaders in integrated CRDMO (Contract Research, Development & Manufacturing) services, powering global pharma, biotech & biotech innovation. 💡
syngeneintl.com
📊 Bullish fundamentals ahead:
✔️ Earnings & revenue projected to grow ~14–18% per year — strong compound growth potential.
Simply Wall St
✔️ Analysts project a 12-month price target with upside potential, with high estimates near ₹840.
Investing.com India
✔️ Stock trading at a fair valuation with intrinsic value models suggesting room to run long-term.
Smart Investing
🚀 Strategic growth catalysts:
• Global outsourcing trend — Big Pharma is increasingly outsourcing R&D and manufacturing, boosting demand for players like Syngene.
AnytimeInvest
• Expansion of biologics and advanced product capabilities through facility upgrades.
syngeneintl.com
• Long track record of partnerships with global industry leaders.
Wikipedia
💡 What this means:
Syngene’s focus on scalable science services and future-oriented growth areas like biologics make it a compelling pick for investors with a 3–5 year horizon. Plan ahead, stay informed, and let innovation lead the way! 🔎💼
#Stocks #Investing #IndianMarkets #PharmaGrowth #LongTermWealth

KPIT Tech, Taking good support at these levels, SL is definedKPIT Tech Long, Target ATH. This is in longtime sideways distribution phase and It is a long trade for me

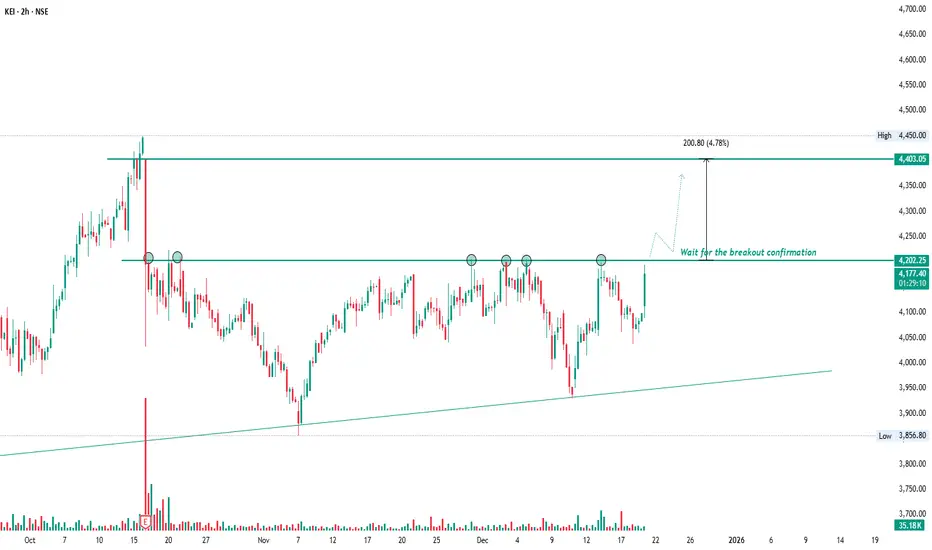
KEI | Repeated Rejection → Breakout Setup LoadingKEI has been respecting this clear range for weeks. Multiple rejections from the same zone tell one simple story — supply is active, but weakening.
I’m not interested in predicting tops or bottoms here. My focus is only on price behaviour at key levels.
A clean breakout and hold above the marked resistance opens the door for expansion toward the upper zone. Until then, patience is the trade.
Most losses happen when traders act inside the range. I prefer to act only when the market shows its hand.
Zoom Out: Bitcoin’s 14-Year Structural Expansion Explained!Hey Everyone, let's analyse long term structural view on Bitcoin as it is once again sitting inside the same structural expansion channel it has respected for more than 14 years.
Zooming out removes the noise, what looks random on lower timeframes reveals a very consistent long-term pattern.
Most traders focus on headlines. Long-term moves are built on structure.
Bitcoin has never moved randomly on higher timeframes. Every major cycle since 2011 has expanded inside a rising macro channel driven by demand, time, and liquidity.
Each cycle looks different on the surface, but the internal structure remains the same, higher lows forming on macro support, followed by exponential expansion phases.
Current price is still respecting the long-term rising structure, with buyers consistently stepping in near the lower boundary of the channel.
The upper zone shown is not a prediction. It represents the historical expansion boundary where previous cycles matured and volatility peaked.
As long as the macro structure remains intact, the probability continues to favor structural continuation rather than random collapse.
Key takeaway:
Markets don’t repeat perfectly, but they rhyme .
And Bitcoin has been speaking the same structural language for over a decade.
Conclusion:
This is not about catching tops or bottoms.
It’s about understanding where you are in the cycle , and acting accordingly.
If this structural perspective helped you, like, comment, and follow for more long term market studies.
Analysis By @TraderRahulPal | More analysis & educational content on my profile.
⚠️ DISCLAIMER: This analysis is for educational purposes only and reflects a long term structural view. It is not financial advice. Always manage risk and do your own research before making trading or investment decisions.

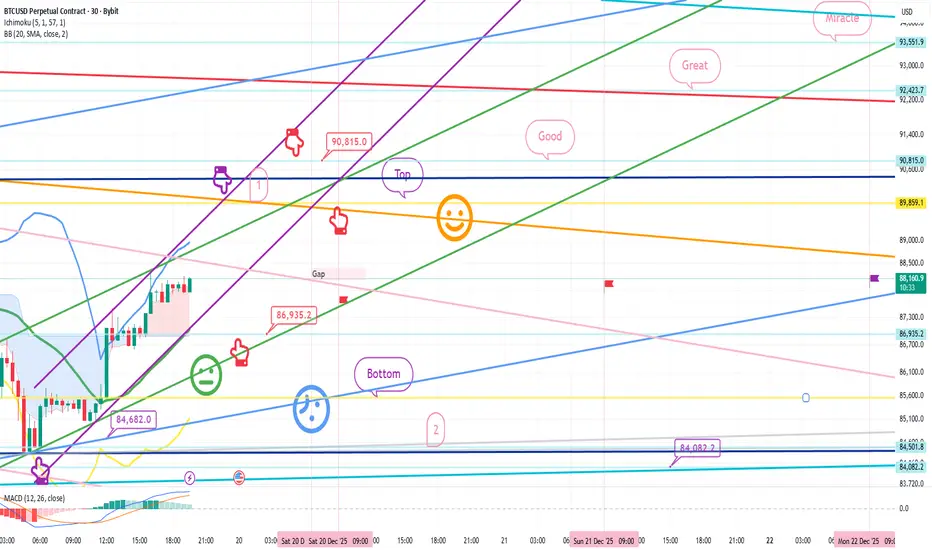
Bitcoin Bybit chart analysis December 19
Hello
It's a Bitcoin Guide.
If you "follow"
You can receive real-time movement paths and comment notifications on major sections.
If my analysis was helpful,
Please click the booster button at the bottom.
This is a Bitcoin 30-minute chart.
Shortly, at 10:30 AM and 12:00 PM, the Nasdaq indicators will be released.
At the bottom left, the purple finger indicates the strategy, which follows yesterday's final long position entry point of $84,682.
*If the red finger follows the path, it is a one-way long position strategy.
1. Touch the first point of the purple finger at the top, or even if it doesn't, the red finger indicates the long position entry point at $86,935.2. Stop-loss price if the green support line is broken.
2. $90,815 is the first target for the long position -> Target price is up to Miracle over the weekend.
If the strategy is successful, the top point can be used as a long position re-entry point.
The first point at the top is today's maximum resistance level.
If it touches this point after 9:00 AM tomorrow,
it can ignore the resistance line and continue to rise.
Conversely, if it touches the bottom immediately, a sharp correction could occur, so focus on the 86.9K long position entry point.
Today, it's best to avoid breaking below the light blue support line (bottom) to safely move upward.
Below that, the weekend's lowest support line (2nd) -> double bottom (84082.2 dollars) remains.
If it reaches the double bottom,
unless a very strong rebound occurs,
an additional downtrend could occur next week, so be careful.
(The gray uptrend line is marked in section 2.)
**It's been a while since I've made this fully public.
My daily analysis, which I diligently write, is divided into key support and resistance levels,
and can be utilized in real-time from entry to liquidation.
So, I think it's no different.
Thank you for your support, and I'll make more full public releases in the future.**
Please use my analysis to this extent for reference only.
I hope you'll operate safely, with a strict trading strategy and stop-loss orders.
Thank you for your hard work this week.
sell trade in niftyselling nifty with sl of 25 points for a target of bottom liquidity sweep .
Nifty taking rejection from liquidity sweep top . if price sustains we can see a good fall till liquidity sweep bottom . more bearish levels are not yet validated . we can see more fall till mid reversal .

Silver comex be ready for downmove heavy fall AI tool data Parameter Data
Asset Name 🟦 Silver Futures (COMEX / SI)
Price Movement 🟥 Minor Pullback (-1.91% Today / +130% YTD)
Current Trade 🟨 WAIT / BUY ON DIPS (Targeting $70.00+)
SMC Structure 🟩 Strong Bullish Order Flow (High-level consolidation)
Trap/Liquidity Zones 🟥 Bullish Trap: Above $67.50 / 🟩 Demand Zone: $63.70 - $64.80
Probability 🟩 72% Upside Continuation
Risk Reward 1 : 1.5
Confidence 🟩 High (Strong Industrial & Macro Backing)
Max Pain 🟨 $60.00 (Concentrated Put Support)
DEMA Levels 🟩 Bullish (Price well above 50 & 200 DEMA)
Supports 🟩 S1: 65.00 / S2: 63.72 / S3: 62.00
Resistances 🟥 R1: 67.18 / R2: 67.50 / R3: 70.00
ADX/RSI/DMI 🟩 ADX 32 (Strong Trend) / RSI 68 (Cooling from Overbought)
Market Depth 🟨 Moderate (Buy orders stacking near $64.50)
Volatility 🟥 Extreme (IV 45%+) / High Speculative Activity
Source Ledger COMEX, MCX, LBMA, LSEG Data
OI (Open Interest) 🟩 Rising (New long positions building on dips)
PCR (Options) 🟩 1.63 (Strong Bullish Bias / Put Writing)
VWAP 🟩 $66.08 (Price currently testing VWAP from above)
Turnover 🟩 Record High (Confirming institutional participation)
Harmonic Pattern 🟨 N/A (Impulse wave in progress)
IV / RV 🟥 IV > RV (Markets pricing in sharp moves)
Options Skew 🟩 Positive (Call premiums significantly higher)
Vanna / Charm 🟨 Neutral (Approaching month-end expiry)
Block Trades 🟩 Significant Institutional Inflows in Dec contracts
COT Positioning 🟩 Commercials Short / Managed Money Aggressive Long
Cross-Asset Corr. 🟩 Strong Inverse with DXY (98.30)
ETF Rotation 🟩 Strong Inflows (Global holdings at 3-year highs)
Sentiment Index 🟥 Greed/Euphoria (82/100)
OFI (Order Flow) 🟩 Strong Buy-side pressure on every $1 dip
Delta 🟩 Cumulative Delta: Strongly Positive
VWAP Bands 🟨 Upper Band Touch (Suggests short-term exhaustion)
Rotation Metrics 🟩 Outperforming Gold (Ratio at 69.7x)
Market Phase 🟩 Markup Phase (Parabolic Trend)

NIFTY : Trading levels and Plan for 19-Dec-2025📘 NIFTY Trading Plan for 19-Dec-2025
(Chart reference: 15-min | Gap criteria considered: 100+ points)
Important Levels from Chart
Opening Resistance: 25,848
Last Intraday Resistance: 25,923 – 25,951
Upper Target / Supply: 25,985
Opening Support (No-Trade Zone): 25,763 – 25,814
Last Intraday Support: 25,677 – 25,703
Extreme Support: 25,594
🟢 1. GAP-UP OPENING (100+ Points)
If NIFTY opens above 25,848, it directly enters the overhead resistance structure.
🎓 Educational Explanation:
A gap-up opening indicates overnight positive sentiment, but price often reacts near prior supply zones due to profit booking. Professional traders avoid chasing and instead wait for acceptance above resistance or a healthy retest.
Plan of Action:
Sustaining above 25,848 for 10–15 minutes can allow pullback-based long entries.
First upside hurdle is 25,923–25,951 (last intraday resistance zone).
Acceptance above 25,951 may extend the move toward 25,985.
Rejection or exhaustion near 25,923–25,951 can trigger a pullback toward 25,848.
Option buyers should prefer ATM/ITM Calls only after confirmation; avoid buying at the opening spike.
🟡 2. FLAT OPENING
A flat open near 25,800–25,830 places NIFTY inside the Opening Support / No-Trade Zone.
🎓 Educational Explanation:
Flat opens represent market indecision. During such phases, price tends to trap early buyers and sellers. Direction becomes clear only after a range breakout or breakdown, making patience crucial.
Plan of Action:
Break and sustain above 25,848 shifts momentum toward 25,923–25,951.
Failure to cross 25,848 keeps price vulnerable to a downside test.
Breakdown below 25,763 opens downside toward 25,703–25,677.
Watch for bullish reversal patterns near 25,763–25,814 for bounce trades.
🔴 3. GAP-DOWN OPENING (100+ Points)
If NIFTY opens below 25,763, selling pressure may dominate early.
🎓 Educational Explanation:
Gap-down openings are often driven by fear. However, strong historical demand zones usually attract buyers looking for value, leading to short-covering bounces. Selling blindly at support increases risk.
Plan of Action:
First demand zone to observe is 25,703–25,677; look for rejection or base formation.
A bounce from this zone can retrace toward 25,763–25,814.
Sustained breakdown below 25,677 exposes the 25,594 level.
Any pullback toward 25,763 after breakdown becomes a selling-on-rise opportunity.
⚙️ Risk Management Tips for Options Traders 🛡️
Avoid trading in the first 5–10 minutes during gap days.
Do not buy options near resistance or sell near support—wait for confirmation.
Use time-based stop-loss (15–20 minutes) if the premium fails to move.
Risk only 1–2% of total capital per trade.
Prefer ATM options or vertical spreads to manage theta decay.
Book partial profits near marked resistance/support zones.
🧾 Summary & Conclusion
Above 25,848: Bulls stay active with targets 25,951 → 25,985.
Between 25,763–25,848: Market remains range-bound; patience is key.
Below 25,763: Sellers gain control unless buyers defend 25,703–25,677.
Focus on price behaviour at levels, not prediction.
Consistency comes from discipline, not frequent trades.
⚠️ Disclaimer
I am not a SEBI-registered analyst. This trading plan is for educational purposes only and should not be considered financial or investment advice. Please consult your financial advisor before taking any trades.

Gold After Liquidity Grab: Short side intraday move, R you readyHello Everyone, let's analyse Gold as this once again tested a major resistance zone, but instead of giving a clean breakout, price briefly moved above the level and then quickly reversed. This move was not strength, it was a liquidity grab.
In simple words, smart money pushed price above resistance to trap breakout buyers, collect their stop-loss liquidity, and then bring price back into the range. This is why price failed to hold above the highs and started showing weakness soon after.
Right now, Gold is trading back below resistance, which keeps the short term bias cautious to bearish. If selling pressure continues, price may slowly rotate toward the lower support / demand zone, where buyers could appear again.
This chart is a good reminder that not every breakout is real. Waiting for confirmation always matters more than speed.
Disclaimer: This analysis is for educational purposes only and should not be taken as financial advice. Please do your own research or consult your financial advisor before investing.
Analysis By @TraderRahulPal | More analysis & educational content on my profile.
If this helped you understand price behavior better, like, follow, and share your view in comments.

StarThe price faced resistance at the 1020 zone, fall down and took support at the 850 zone. This created a narrow range which resulted in a symmetrical triangle pattern. The breakout can happen in any direction.
Buy above the 900 - 910 zone with the stop loss of 885 for the targets 925, 940, 954, 972, 996 and 1018.
Sell below 860 with the stop loss of 875 for the targets 844, 826, 808, and 790.
Always do your analysis before taking any trade.

Updated Nifty Analysis for Dec 19, 2025Wrap-up:
In wave 2 of Major wave 1, Nifty forming a wxy pattern. Wave w has been completed at 25318 and wave x at 26325 and wave y is in progress of which a is completed at 25891 and wave b is in progress.
In wave b, inner wxy pattern is formed and wave w is completed at 26098 and and wave x is in progress. In wave x, again wxy is formed in which w and x are completed and y is in progress.
In wave y, a is completed at 25904 and b is in progress which is expected to be completed in the range of 25908-26012. Thereafter, Nifty will head towards c.
What I’m Watching for Dec 19, 2025 🔍
Short nifty 25908-26012 sl 26058 for a target of 25565-25469.
Disclaimer: Sharing my personal market view — only for educational purpose not financial advice.

Natural gas still negative, AI tool report on description Parameter Data
Asset Name Natural Gas (NG) MCX Dec 2025 Futures
Price Movement 🟥 Strong Bearish Momentum (LTP: ₹353.50 | -0.76%)
Current Trade 🟥 SELL ON RISE (Resistance near ₹360-₹365)
SMC Structure 🟥 Bearish Break of Structure (BOS) on Daily TF
Trap/Liquidity Zones 🟥 Bullish Trap: ₹368.00 | 🟩 Liquidity Pool: ₹342.00
Probability 🟨 60% (Further drift toward S1 likely before consolidation)
Risk Reward 1 : 1.5
Confidence 🟨 Medium (High dependency on shifting NOAA weather maps)
Max Pain 🟨 ₹360 (Heavy Call writing observed at this strike)
DEMA Levels 🟥 Below 20 & 50-DEMA; Approaching 100-DEMA (₹342.20)
Supports 🟩 S1: ₹349.70, S2: ₹342.20, S3: ₹332.00
Resistances 🟥 R1: ₹360.00, R2: ₹367.40, R3: ₹381.30
ADX/RSI/DMI 🟥 RSI: 38 (Weak), ADX: 29 (Bearish trend gaining strength)
Market Depth 🟥 Sell Side Heavy (OFI showing aggressive ask hitting)
Volatility 🟥 High (Intraday swings of 3-5% common)
Source Ledger MCX Real-time / NYMEX Sync
OI 🟥 Long Unwinding (LTP down, OI down -17.43%)
PCR 🟥 0.43 (Extremely Bearish - Heavy Call writing)
VWAP 🟥 Price < VWAP (Intraday bearish control below ₹356)
Turnover 🟩 Very High (High participation during US session)
Harmonic Pattern 🟨 Potential Bat Pattern (Completing near S2 level)
IV/RV 🟥 IV: 74.52% (Extremely high; options are expensive)
Options Skew 🟥 Bearish Bias (Puts trading at discount relative to Calls)
Vanna/Charm 🟥 Negative (Dealer hedging adding to downward pressure)
Block Trades 🟨 Retail Exit seen at the ₹380 level earlier this week.
COT Positioning 🟨 Flipping to Neutral (Speculators reducing net longs)
Cross-Asset Correlation 🟨 Low Correlation (Moving purely on weather/inventory)
ETF Rotation 🟥 Outflows (Profit-taking in UNG/Boil equivalent funds)
Sentiment Index 🟥 Fear (Rapid cooling of early-December optimism)
OFI 🟥 -3,069 Contracts (Negative flow in last sessions)
Delta 🟥 Negative Cumulative Delta (Aggressive selling)
VWAP Bands 🟨 Lower Band: ₹348.50 | Upper Band: ₹364.20
Rotation Metrics 🟥 Lagging (Weakest performer in Energy sector)
Market Phase 🟥 Decline Phase / Markdown

Influx Healthtech LtdDate 19.12.2025
Influx Healthtech
Timeframe : Day Chart
Highlight : zero-debt small-cap company beating in valuation ratios to many large cap cos.
About
(1) Incorporated in September 2020
(2) Healthcare-focused company specialising in contract manufacturing
(3) Catering Business-to-Business (B2B)
(4) Clients in nutraceuticals, cosmetics, ayurvedic, veterinary and homecare
Business Segments & Product Portfolio
(1) Nutraceuticals (2874 products)
(2) Cosmetics (240 products)
(3) Ayurvedic (79 products)
(4) Veterinary (46 products)
(5) Homecare (30 products)
Revenue Bifurcation
(1) Nutraceuticals: 90.74%
(2) Cosmetics: 5.21%
(3) Ayurvedic: 2.92%
(4) Veterinary: 1.08%
(5) Homecare: 0.05%
Geographical Presence
Revenue From Domestic: 99.27%
Major states:
Maharashtra (61.29%)
Gujarat (19.72%)
Karnataka (6.79%)
Valuations
(1) Market Cap ₹ 513 Cr
(2) Stock Pe 29
(3) Roce 60 %
(4) Roe 45 %
(5) Book Value 5.5X
(6) Opm 21%
(7) Promoter 73%
(8) Profit Growth (TTM) 20%
(9) EV/Ebita 19
(10) PEG 0.66
Regards,
Ankur Singh

Bullish Setup on Laurus LabLaurus Lab Hourly Chart
F&O Segment stock
Bullish Pattern (ascending triangle) spotted on hourly chart.
There is a breakout on hourly RSI indicating momentum in the stock and there can be a breakout about resistance zone on price chart. Target comes around 1095
Laurus lab is a high beta stock it can reach its target within 2-3 days.
Being a high beta stock it can also move fast in either side protect your capital with logical stoploss.

XAUUSD | Awaiting Reaction at OB + Fibo to Confirm Next Move◆ Market Context (M30)
The price is maintaining an uptrend with a supporting trendline. After a strong push creating a short-term peak, the market enters a pullback to rebalance. The current decline has not broken the upward structure.
◆ SMC & Price Action
• The rapid decline creates an OB + Fibo Sell zone ~4,335 (retesting the premium area).
• The price has reacted at the trendline ~4,315, indicating that buying pressure still protects the structure.
• Liquidity above 4,367 – 4,372 remains → potential for liquidity draw if the trend continues.
◆ Key Levels
• OB + Fibo Sell: ~4,335
• Trendline / Support: ~4,315
• Liquidity (upper target): 4,367 → 4,372
• Invalid uptrend: clear break below trendline ~4,315
◆ Trading Scenarios
➤ Scenario A – Pullback BUY (priority)
• Await price reaction around the trendline ~4,315
• Condition: candles rejecting decline / maintaining higher lows
• Targets:
▪ 4,335
▪ 4,367 → 4,372 (Liquidity)
➤ Scenario B – Short-term Sell
• If the price retraces to OB + Fibo ~4,335 but does not break
• Observe rejection signals to SELL back to 4,315
• Only a scalp against the main trend
➤ Scenario C – Breakdown (defensive)
• If the trendline ~4,315 is decisively broken
• Stay out / wait for a new CHoCH before BUYing again
◆ Summary
• Context: pullback within an uptrend.
• Decision zones: 4,315 (trendline) and 4,335 (OB + Fibo).
• Upper target: 4,367 → 4,372.
• Avoid FOMO; prioritize BUYing pullbacks according to the structure.

BTST To Swing OpportunityWaaree Energies
Smart Move near closing time
CMP 4065
SL CLB 3090
Tgt 3240 & Beyond
⚠️ Note: Stick to levels, follow discipline & use TSL (Trailing Stop Loss) once target starts approaching.
Let’s stay hopeful that the move continues as per our expectations! 📈
💡 Liked the idea?
Then don’t forget to Boost 🚀 it!
For more insights & trade ideas,
📲 Visit my profile and hit Follow
Warm regards,
Naresh G
SEBI Registered Research Analyst
💬 Comment below if you want me to analyse any stock for you 🔍

Update BTC retest previous Ascending Chanel BTC is currently retesting the previous ascending channel around 88k after dump.
Probablity
1. Nutral Dump to 84k - Confirmation only after 5 min bearish Divergence - 55%
2. Invalidation close above 88k in 4 hours - 20%
Note: Please ignore the previous chart TA

Gold Analysis & Trading Strategy | December 18 – 19Gold Analysis & Trading Strategy | December 18 – 19
🎉 Congratulations to our Trading Signal Group members! 🎉
✅ Total profit today: 300 + 250 + 450 = 1,000+ PIPS
✅ 4-Hour Chart (H4) Trend Analysis
1️⃣ Overall Structure: High-Level Consolidation Turning Weaker, Still Range-Bound
After completing a major bullish move from 4180 → 4375, gold is currently trading in a broad high-level consolidation range.
The 4370–4380 area has seen multiple failed upside attempts, forming clear overhead selling pressure.
Recent candles are fluctuating around the key pivot zone of 4325–4330, with highs no longer moving higher.
➡️ This indicates that bullish momentum is fading, but no confirmed trend reversal has formed yet.
2️⃣ Moving Average Structure: Bullish Alignment Weakening, Decision Phase
MA5 and MA10 are flattening and crossing repeatedly
MA20 remains upward sloping, but with a noticeably reduced angle
Price is currently trading within the MA10–MA20 zone (approximately 4320–4335)
➡️ The H4 structure has shifted from strong bullish to high-level consolidation / mildly bearish range trading.
✅ 1-Hour Chart (H1) Trend Analysis
1️⃣ Short-Term Structure: Spike and Pullback, Bearish Bias Within Consolidation
Price spiked to 4374 and then pulled back sharply, leaving a clear upper wick.
The market has since retraced to 4325–4330, without a strong or rapid recovery.
Lower highs are forming, and the short-term rhythm has shifted from bullish to sideways.
➡️ This suggests that buy-the-breakout momentum has weakened, while sellers are beginning to engage.
2️⃣ Moving Average Condition: Short-Term Weakness Emerging
MA5 has crossed below MA10, signaling short-term bearish bias
Price is repeatedly testing MA20 / MA60
A decisive break below 4310 would further confirm short-term weakness
🔴 Resistance Levels
4345–4355 / 4370–4380
🟢 Support Levels
4310–4320 / 4285–4270
📌 Trading Strategy Reference
🔰 1️⃣ Short at Higher Levels
📍 Look for light short positions near 4338–4350 upon clear rejection
🎯 Targets: 4310 / 4285
⛔ Stop-loss: Above 4370
🔰 2️⃣ Buy on Pullbacks
📍 After stabilization in the 4275–4285 zone, consider light long positions
🎯 Targets: 4315 / 4335
⛔ Stop-loss: Below 4260
✅ Trend Summary
H4: High-level consolidation, bearish bias but no breakdown
H1: Spike-and-pullback structure, short-term sellers in control
👉 Current market conditions favor selling near resistance and cautious buying near strong support, with strict risk control and light position sizing.

VEDL - Multi year breakoutThis a 3M time frame chart. Simple, clean and elegant. Please note this a very broad time frame chart so this cannot be a swing trade or short term trade, the minimum time of investment should be 6M.
We can target a return in the range of 60%-100%
