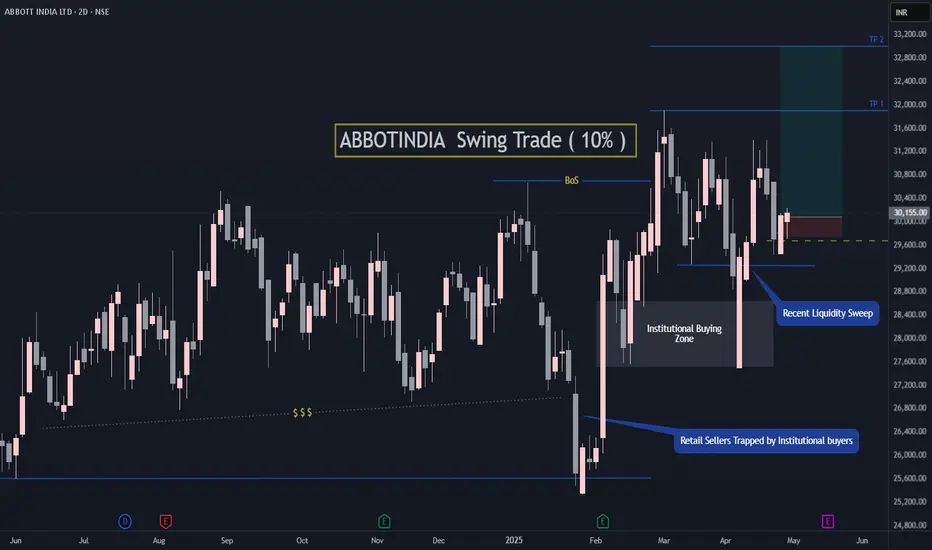
ABBOTINDIA Swing Trade ( 10% upside potential) Abbott India is near to the previous Institutional Buying zone and has upside potential of 10%.
Simple Demand Zone buying setup.
Don't keep hard stop loss. Manage positions as per situation.
Follow for more such setups.
I have been very busy lately because of renovation at home. Will be sharing more setups soon. Thanks.
ABBOTINDIA
Abbott India Swing TradeOn weekly time frame, sellers are trapped badly in Abbott India which can fuel a good potential up move. Also it has recently grabbed liquidity from previous week low so if Nifty holds above 23000 then there are high chances of Abbott to reach T1 and T2 which will be a 1:5 RR trade.

Abbott India - Possible end of bullishnessStock reaching daily supply zone
Stock also reaching hourly supply zone also
Hourly zone between 29780 - 29860
Daily zone between 29900 - 30650
As overall market structure is bearish, it is a high
possibility stock may try to reverse from either hourly or daily supply zone
Possible downside expected 28650 / 27500

ABB downtrend Movement Target expected 4600SYmbol ABB
TImeframe 15 minutes
ANalysis Breakout from the parallel channel
Target Expected 4600

Pharma Sector Shines Amidst Market WeaknessOn December 19, 2024, the pharmaceutical sector in India experienced a notable uptrend, with the Nifty Pharma index rising over 1.8%, making it the only sector to gain in an otherwise weak market.
The significant surge in delivery volume indicates a substantial influx of foreign capital into the sector.
◉ Several factors contributed to this positive movement:
1. Defensive Nature of the Sector: Amidst economic uncertainties, investors often turn to defensive sectors like pharma, which offer relatively lower risk compared to cyclical sectors.
2. Positive Market Sentiment: The overall sentiment for the pharma sector was buoyed by expectations of strong growth in the Indian pharmaceutical market, projected to reach $130 billion by 2030 and $450 billion by 2047.
3. Resilient to US Tariffs: India is a major supplier of generic drugs to the US, which could help shield this sector from tariffs due to its critical role in healthcare and the ongoing demand for affordable medications.
◉ Specific Stock Performances:
1. Ipca Laboratories NSE:IPCALAB : Up 5.4%
➖ The stock has formed a Bullish Pole & Flag pattern, and following a breakout, it is set to continue its upward movement.
2. Dr. Reddy's Laboratories NSE:DRREDDY : Up 4.3%
➖ The price has broken out of a falling trendline, signalling strong bullish momentum.
➖ This breakout, supported by a significant rise in trading volume, indicates growing investor interest.
3. Abbott India NSE:ABBOTINDIA : Up 3.4%
➖ The stock is currently in a consolidation phase within a parallel channel.
➖ After rebounding from the lower boundary, the price is now on an upward trend.
◉ Conclusion
The Pharma sector's strong performance is driven by key players' impressive gains, contrasting with the broader market's decline. This divergence makes the sector an attractive investment opportunity. With a promising outlook and strong fundamentals, the Pharma sector is well-positioned for continued growth.

07 Insightful approaches to learning cup & handle pattern ⭕ Price Action chart pattern similarity !!!⭕
Ranges candles shows the phase of accumulation or distribution It helps trader to track bearishness and bullishness of the chart, in this phase accumulation can be seen because of bull Bo.
There is so many ways to approach chart patterns, everyone has different approaches and different insights.
Some Examples of Cup & Handle pattern we have seen:-
1)
2)
3)
4)
5)
6)
POST Your Findings in comment section any other stocks with some pattern you observed we can discuss as a community there !!! Happy To Learn here in TRADINGVIEW with charts
#ThankU For Checking Out Our IDEA , We Hope U Liked IT 📌
🙏FOLLOW for more !
👍LIKE if useful !
✍️COMMENT Below your view !

ABBOTINDIA Premium Stock Ready to FlyHey Family, there is a one more stock Which is showing a great opportunity.
Key Points:-
* Formation of Ascending Triangle Pattern in Daily TF.
* From Feb 2024 to Aug 2024 its in 2,000 Points range.
* From Feb 2024 to Aug 2024 Tested & Moving Near Resistance Many times.
* It's Near resistance Zone and trying to Break Resistance Zone with good volume.
* Volume Accumulation (Volume is Rising).
What is your view please comment it down and also boost the idea this help to motivate us. We are Certified. All views shared on this channel are my personal opinion and is shared for educational purpose and should not be considered advise of any nature.

ABBOTINDIA - Short term trade based on tightness in priceThe analysis is done on Daily TF hence price may take few weeks to few months in order to reach the targets.
Trade setup is explained in image itself.
One should also look at its peers in Pharma sector for more opportunities -
check below charts -
#CIPLA
#STAR
#SANOFI
The above analysis is purely for educational purpose. Traders must do their own study & follow risk management before entering into any trade
Checkout my other ideas to understand how one can earn from stock markets with simple trade setups. Feel Free to comment below this or connect with me for any query or suggestion regarding this stock or Price Action Analysis.

Breakout StockFew days we shared the analysis of Abbot India, to remind here, we Gonna share the levels....
About to breakout either side and also prediction line drawn for idea....

AbbotindiaHere, is the chart of Abbot India has been attached with the predication sign either side.
What's your view? Bullish or Bearish ?

AbbotIndia - CASHLooks like the formation of cup and handle pattern in AbbotIndia chart.
Will create a long position once we have breakout and the target will be determined by measuring the distance between the bottom of the cup and the pattern’s breakout level.

ABBOTINDIA : CUP & HANDLE PATTERNAs I mentioned earlier, Don't Miss to catch this fish. The stock is currently moving up , after completing CUP n HANDLE Patter and taking support @ 22345.00 . Those who missed this stock earlier, the stock is providing a good opportunity to them again. The stock is at support , and at CMP i.e. 22733 is right time to enter the trade. for primary target of 24717.00 and we may see a new high thereafter.
Currently this stock is with Low risk and high Reward and best stock to invest for the time being, with 20 EMA crossing over 50 EMA.
This post is only for education purpose. Kindly trade at your own risk.
Good Luck !!!

Abbott India Limited : DONT MISS TO CATCH THIS FISH !!!Abbott India Limited is an India-based company that is engaged in pharmaceuticals business , seems to be out of retracement phase now. It is retesting the Support line and may break the Triangle Pattern formed by Support and Retracement lines. The Chart is supported by two EMAs and RSI is also only 38.85 . Break out will give you targets of 21340.85 , 22395.65 and 23736.35 . Stop Loss is 19931.20.
Bingo !!! Hope we see breakout on 25.02.2023
Boost my analysis if you like this idea.

Abbott India LimitedABBOTINDIA:- Stock has given breakout by forming cup and handle pattern, keep on eye.
Hello traders,
As always, simple and neat charts so everyone can understand and not make it too complicated.
rest details mentioned in the chart.
will be posting more such ideas like this. Until that, like share and follow :)
check my other ideas to get to know about all the successful trades based on price action.
Thanks,
Ajay.
keep learning and keep earning.

Long ABBOTINDIAThree is traingle breakout in longer time frame and breakout from dow pattern as well.


#StockMarket #StockIdeas #StocktoWatch #StockToBuy #positionalABBOTT India Ltd
Stock corrected from its recent high and took multiple times support from old trendline.
And now at its old ATH resistance levels. And at good levels if breakout happens to enter.
Buy positionally above 18400 levels for min targets of 19100 in short term.
Also Abbott india is portfolio stock to hold for long term also.
----
Note:
Above levels are for education purposes only
Do your own analysis before taking any trade
Use a strict trailing stop loss.
Please Like & Follow

Abbott India Chart Analysis !!📈 ABBOTT 📉
My Findings :-
1. Higher High and Higher Low Formation.
2. Breakout from a Swing High and Support Turned Resistance.
3. Close Above March 2022 High.
Bias- Long
Target- 19513, 20613, 22028 and 23201
SL- 16024
RR- 1: 2.5
All Important Supports and Resistances are drawn in chart. All levels are on closing basis.
Please have a look and revert back if you need some more study on it.
Disclaimer : Consult Your Financial Advisor Before Taking Any Decision On This Analysis.

Abbotindia bullish above 18470Abbotindia has seen a good healthy correction in last few days.
Took support on 61.8% fib, looks good moving up from here
RSI above 44 I consider it as bullish
MACD above the signal line.
Just above the 200 MA cluster
Buy above - 18470
Targets mentioned in the chart above.
SL below 200 ma, near 17700.
Please LIKE, COMMENT and SHARE to motivate and support me. I'll keep on posting new ideas on Indices & Stocks. Be sure to follow so that you don't miss any good trades that might have been rewarding.
Any comments and critiques will be appreciated even if it's of opposite view as a trader can also be right so many times.

ABBOTINDIA - On a strong supportOn a good support on daily chart.
Can be on a watchlist for next move on either sides.
Disclaimer: All charts are for educational purpose. Please consult your financial advisor before investing.

ABBOTT INDIA- FLAG AND POLE AND ROUNDING BOTTOM BREAKOUTabbott india- rounding bottom & flag and pole breakout on monthly charts. cmp 20000.
immediate (1-3 mth) tgt of 23500 for rounding bottom pattern.
positional tgt 30000 for f&p pattern
keeps sl of 10% from ur buying levels as stop loss on daily closing basis.
stock good buy and hold purpose. avoid trading

ABBOTT INDIA, A Break-Out worth riskingDetails of setup shown on chart.
*This is a compounder, so targets could practically not be limited to the levels mentioned

