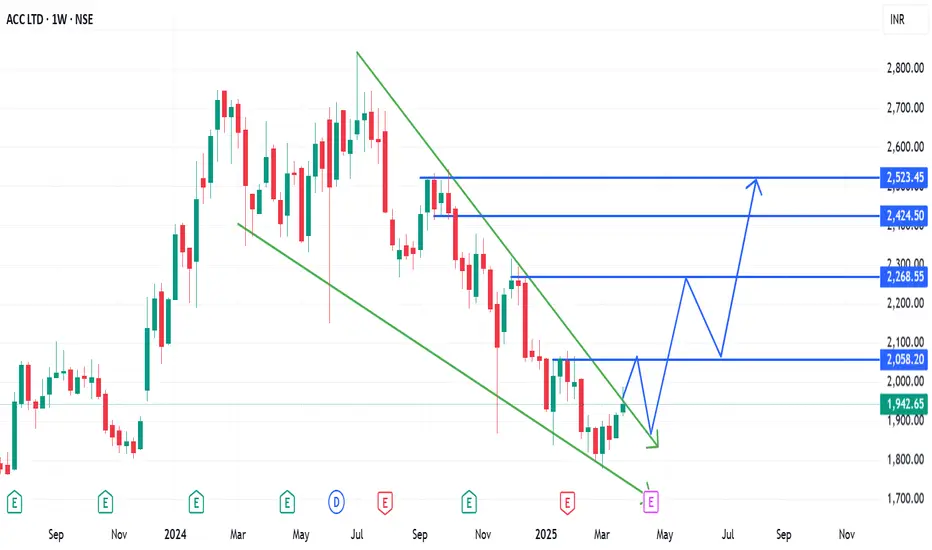
A possible trend reversal in ACC. (01/04/2025)ACC Ltd is trading in a narrow range and is in a downtrend. There are chance of a trend reversal as the indicators are predicting and the price action too seems to follow with them.
The channel break out in the stock can confirm the trend reversal. If the stock give a break out and retest, stock can be bought in cash or in F&O segment too.
Good targets can be captured in the stock as the break out after a year will be there.
Stop loss and Targets should be as per the risk to reward appetite.
Wait for the price action and trade accordingly. Patience will help in capturing the most profitable trades, otherwise losses will be eating away the capital.
Accltd
ACC at Breakout Level Weekly AnalysisACC already follow a uptrend .
Resistance Zone : 2720.40 - 2785.10
After breakout of this range we can see a good move of 2900.
Support 1: 2628
Support 2: 2559.75
Don't take any position on short side for now.
Scenario will be happen:
price maybe side base near 2720-2559 and after the take a breakout.


ACCIt's a combination of technical and fundamental views of this stock price move.
2005 and 2200 are key levels to decide to which side stock is moving.

ACC Looks good above 2290/-ACC Looks good above 2290/- with SL of 2205/- for higher targets of minimum 2460/-

BULLISH on ACCNSE:ACC
The price has given breakout from the ascending triangle pattern. Other parameters are described on the chart.

ACC going to Blast !! A channel Breakout happened in ACC. This stock will be a multi-bagger for sure !! Don't regret for not buying this

Acc - BearishCurrent Trend Sideways/Distribution
Below 2260 Stock turns Bearish
Also breaks the trend line
Can Sell below 2260 with Sl above 2285
For upcoming Targets of 2050

Acc - Preparing for big moveBullish Only if it closes and sustains above - 2190
Bearish only if it closes and sustains below 2140
Both are also SL for each other

ACC Limited - 24.06.2022ACC Limited - 24.06.2022
The stock is trading @ 2098 levels
There is a SUPPORT Zone @ 2090 levels
There is a MACD Bullish Divergence in Daily Chart
The prices are at EMA
There is a DOJI in Daily Chart
RSI is 45 in Weekly Chart
One can initiate a BUY position around 2087-2089 levels, with Support @ 2055
Watch out for the price action

ACC - Possible Breakout ACC - Trading in consolidation range from past few weeks - clear signs of breaking out
Trading above Weekly Pivot, Weekly VWAP, 20-SMA
Also moving away from a strong support line.
If the trend line crossed -- next immediate target 2286 and then 2396.
Add to watch list and spend time on own analysis.

ACC Limited - 03.06.2022ACC Limited - 03.06.2022
The stock is trading @ 2133 levels
The prices are at SUPPORT
The prices are at EMA
There is a MACD Bullish Divergence in Daily Chart
The prices are within a CHANNEL RANGE
The prices are near FIB RETRACEMENT LEVELS
Let the prices go above 2202
Watch out for the price action

ACC Chart Analysis !!📈 ACC 📉
My Findings :-
1. Breakout of Downtrending Trendline Zone.
2. Breakout from a swing high.
3. Close above March high.
4. Higher High and Higher Low formation.
Bias- Long
Target- 2380 and 2572
SL- 2023
RR- 1: 1
All Important Supports and Resistances are drawn in chart.
All levels are of Spot and on closing basis.
Disclaimer : Consult Your Financial Advisor Before Taking Any Decision On This Analysis.

ACC - Trend AnalysisACC looks bearish on Weekly TF due to significant drop in delivery%. Uptrend to continue for 1 - 2 weeks and possible reversal.
The Target & SL has been updated on the chart.
This is solely my view and for educational purpose only.
let me know your thoughts in the comments section

ACC - Channel BreakoutACC is strong Above 2170
RSI should cross 60 for more strength
Relative Strength should come above 0 line
A good volume + breakout will confirm the Entry

ACC LTD Swing Trade setup with ichimoku & FibonacciWelcome , in this Video i will discuss on ACC LTD Swing Trade setup with ichimoku & Fibonacci .. thanks

ACC LTDChart is self explanatory looking for short term buys and long term sells in ACC ltd, Look for proper Lower time frame break of structure before taking any trades

Swing Trade Idea Broken previous swing high, formed a candle & closed above the trendline. Targets and entry as per below.
Entry: CMP
t1: 2426
t2: 2504
t3: 2593
SL: 2343

Long ACC...High Probability SetupACC
Cmp - 2284
Stop - 2200
Expectation -
T1 - 2350
T2 - 2500, Review at 2500
Expected Holding Period - 3 months or earlier for T1, 5 months or earlier for T2
View:- Swing/Investment

ACC : Reversal from support trendlineAcc is trying to reverse from the support trendline.
One can add this up with a SL below 2200 on DCB for a target of upper channel trendline.
TF can be medium term over here.
DISC: For educational purposes only. Please consult your advisor before making any investment.

ACC SHORT-TERM SWING TRADE Hi everyone, Acc short-term swing trade, consider buying above 2,305 target 2,380 stoploss 2,280.
LOGIC BEHIND TRADE : Stock recently given correction & formed W pattern which is sign of reversal if breaks it`s dynamic trendline resistance & static resistance 2,305 trend will changed & it`s good oppourtinity to buy stock for short-term swing trade.

ACCNSE: ACC 2374
-Possible Double Bottom Breakout Level
-Now if stock break the 2350 level we can see some more consolidation between a range
-If stock break the 2200 level and sustain below this we can see some fall in the price

📊 ACC On support buy need conformationNSE:ACC
As one can see stock at harmonic support but here we need some conformation as we can see gap there it can fill that gap as well, and it might take reversal from dame candle as well so trade accordingly. Just wait for perfect reversal, then only go for long.
******whatever charts or levels sharing here are just for educational purpose only, not a recommendation. Please do your own analysis before taking any trade on them. We are not SEBI registered.
