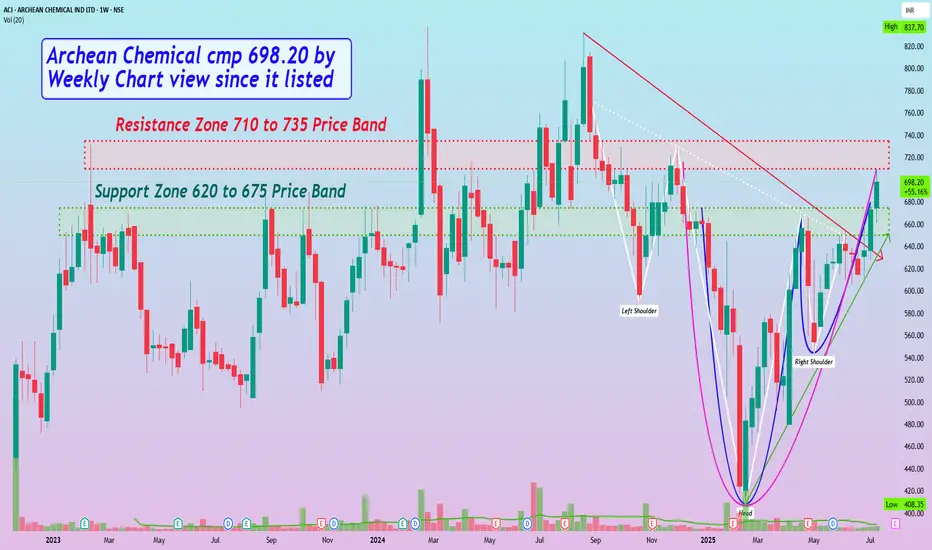
Archean Chemical cmp 698.20 by Weekly Chart view since it listedArchean Chemical cmp 698.20 by Weekly Chart view since it listed
- Support Zone 620 to 675 Price Band
- Resistance Zone 710 to 735 Price Band
- Volumes flattish, need to increase for Resistance Zone Breakout
- Bullish Rounding Bottom inclusive of Cup & Handle pattern completed
- A logically considerate slanting Bullish Head & Shoulder pattern too, has completed
- Falling Resistance Trendline Breakout sustained and Rising Support Trendline respected
ACI
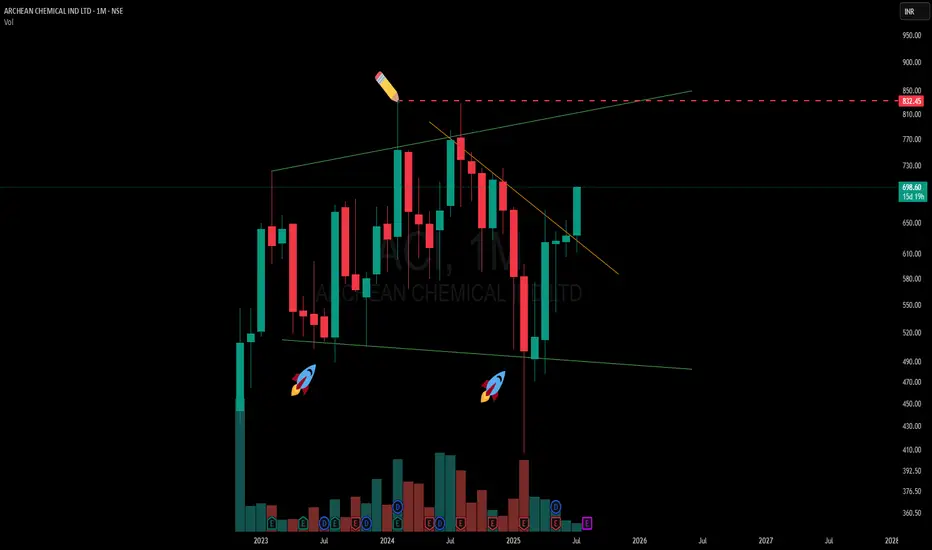
Archean Chemical – Broadening pattern and the CT ? 🟢A classic case of a broadening formation playing out on the higher timeframe (MTF). The green lines represent the broadening range, with price recently respecting the lower boundary — evident from the two support touches marked with 🚀 icons, each forming slightly lower lows before rebounding.
🟢 The current candle is testing a counter-trend (CT) descending trendline breakout, visible clearly after a prolonged series of lower highs. While the candle is still in progress and hasn’t closed, the structure is showing signs of compression toward the mid-zone of the broadening pattern.
📌 Upper and lower spaces remain open, highlighting the broad-range volatility typical of this setup.
No forecast — just structure. 📊
ACI - Double Bottom (Bullish)Archean chemical industries is a leading specialty marine chemical manufacturer in India focused on producing and exporting bromine, industrial salt, and sulphate of potash across the world. Archean is the largest exporter of bromine and industrial salt in India and has amongst the lowest cost of production globally in both bromine and industrial salt.
Fundamentally sound company with PEG 0.79, ROE, ROCE, ROIC > 15%.
Technicals: Price is above 200MA. Double bottom formation after bearish Head & Shoulder. Trendline is about to breakout. Volumes have been steady in daily chart over the last 5D. Both DII, FII institutions have been increasing the stakes steadily in every quarter. 161.8% fib level would be long term target of 1069 which is also pivot R3 in weekly timeframe. Pivot targets are shown on chart.
Disclaimer: Educational purpose.

ACI gives brake out on daily chartNSE:ACI
ACI gives brake out on daily chart.
I am buying this stock
Near 760
And follow sl on 640
My target will be 930
My risk reward ratio is 1:1.60
Return on capital 20%

ACI given breakout on weekly timeframeACI seems good on weekly timeframe. Result today. Upside potential

ACI - Breaking out H&S bearish patternHead and Shoulder is a bearing pattern. ACI seems to be negating H&S pattern by breaking the trendline in chart & RSI in daily chart with volume. Trendline between head & right shoulder top yet to be broken. Closing above 690 (Right shoulder) would confirm that bearish pattern is negated

Archean Chemicals fundamentally strongCompany producing bromine and industrial salt with great fundamentals and cashflows. Chemical industry is still struggling. In recent concall, Management said global inventories are over and could expect the demand soon. They've increased the capacity as well. Management further said domestic demand is picking up. 1st target 700, 2nd target 815. Could be held for long term as well.
Disclosure: Holding

Archean Chemical Industries LimitedACI:- Stock has formed head and shoulders pattern wait for breakout till then keep an eye
Hello traders,
As always, simple and neat charts so everyone can understand and not make it too complicated.
rest details mentioned in the chart.
will be posting more such ideas like this. Until that, like share and follow :)
check my other ideas to get to know about all the successful trades based on price action.
Thanks,
Ajay.
keep learning and keep earning.
