ADANIENSOL Weekly Bullish Flag BO | Multiple Targets to 1,262.45ADANIENSOL (Adani Energy Solutions Limited) – Weekly Analysis
━━━━━━━━━━━━━━━━━━━━━━━━━━━━━━━━━━━━━━━━━━━
📊 TECHNICAL SETUP
Current Price: 1,057.90 (+4.20%)
Timeframe: Weekly (1W)
Symbol: ADANIENSOL (Adani Energy Solutions Limited)
Exchange: NSE
Category: Stock / Energy & Infrastructure Sector
━━━━━━━━━━━━━━━━━━━━━━━━━━━━━━━━━━━━━━━━━━━
🎯 PATTERN ANALYSIS
ADANIENSOL demonstrates a STRONG WEEKLY BULLISH FLAG BREAKOUT pattern:
✅ Flag Structure: Clear flagpole followed by tight consolidation in the 1,020–1,050 range
✅ Breakout Confirmation: Price decisively breaking above upper flag boundary on strong weekly candles with increasing momentum
✅ Support Levels: Strong support identified at 1,039.40 with SL at 963.00 for risk management
✅ Volume Profile: Visible volume participation on the breakout confirming institutional interest
✅ Momentum: Sustained bullish momentum with stock now trading above consolidation levels (+4.20% already)
✅ Risk/Reward: Well-defined multi-target setup with excellent risk-reward ratio and extended upside potential
The stock shows textbook uptrend characteristics with proper support/resistance relationships, confirming the bullish flag breakout is a continuation pattern with multiple profit-taking opportunities.
━━━━━━━━━━━━━━━━━━━━━━━━━━━━━━━━━━━━━━━━━━━
📈 PRICE TARGETS (Progressive Levels)
1st Target: 1,113.75 (+5.3% from current)
2nd Target: 1,150.90 (+8.8% from current)
3rd Target: 1,188.10 (+12.3% from current)
4th Target: 1,225.25 (+15.8% from current)
5th Target: 1,262.45 (+19.3% from current)
6th Target: 1,300+ (Extended target zone - additional upside beyond 5th target)
These progressive targets represent key resistance zones and profit-taking levels along the uptrend trajectory. Each target should be treated as a potential decision point for scaling profits while maintaining exposure to further upside. The extended target structure suggests strong upside potential with multiple stepping stones for systematic profit realization across the energy and infrastructure rally.
━━━━━━━━━━━━━━━━━━━━━━━━━━━━━━━━━━━━━━━━━━━
🛡️ RISK MANAGEMENT
Entry Zone: 1,039.40 (Breakout confirmation point - primary entry level after flag breakout)
Stoploss: 963.00 (Weekly support - critical invalidation level marked as "SL on WCB")
Risk/Reward Ratio:
Risk (1,039.40 to 963.00) = 76.40 points
Reward (1,039.40 to 1,262.45) = 223.05 points
R:R Ratio = 1:2.92 (Excellent)
Position Sizing: Risk only 1-2% of capital per trade
Stoploss is placed BELOW major weekly support level to ensure proper risk containment.
Consider scaling in on dips toward the 1,039.40 entry zone for better average entries.
━━━━━━━━━━━━━━━━━━━━━━━━━━━━━━━━━━━━━━━━━━━
📍 KEY SUPPORT & RESISTANCE
Immediate Support: 1,039.40 (Breakout/Buy zone - initial entry opportunity)
Secondary Support: 963.00 (Stoploss / Major weekly support - invalidation zone)
Resistance 1: 1,113.75 (1st Target)
Resistance 2: 1,188.10 (3rd Target - mid-term resistance)
Resistance 3: 1,225.25 (4th Target)
Major Resistance: 1,262.45+ (5th Target / Extended upside potential)
Intermediate Levels: Multiple targets provide stepping stones for profit realization at each resistance level, allowing systematic position management and partial profit booking throughout the uptrend.
━━━━━━━━━━━━━━━━━━━━━━━━━━━━━━━━━━━━━━━━━━━
🔍 FUNDAMENTAL BACKDROP – ENERGY & INFRASTRUCTURE STRENGTH
ADANIENSOL benefits from strong macro tailwinds in energy and infrastructure sectors:
✅ Renewable Energy Growth: India's accelerated renewable energy adoption and net-zero targets driving demand
✅ Transmission Expansion: Power transmission infrastructure expansion creating growth opportunities
✅ Government Policy: Government support for clean energy and infrastructure development initiatives
✅ Asset Monetization: Strategic asset monetization opportunities supporting valuation expansion
✅ Infrastructure Capex: India's robust infrastructure capex spending cycle supporting energy demand
✅ Margin Profile: Improving operational efficiency and margin profile in energy transmission business
✅ Growth Visibility: Multi-year visibility on revenue and earnings growth from infrastructure expansion
This macro backdrop combined with strong technical structure reinforces bullish conviction for trend-following strategies on dips.
━━━━━━━━━━━━━━━━━━━━━━━━━━━━━━━━━━━━━━━━━━━
🎉 TECHNICAL OBSERVATIONS
Weekly uptrend remains intact with clear higher highs and higher lows forming
Flag breakout on volume confirms institutional participation and buying strength
Stock breaking above consolidation levels — a classic sign of strength in energy infrastructure play
Breakout from a tight consolidation pattern shows disciplined buying entering the stock
Multiple targets (5-6 levels) suggest strong extended upside with multiple resistance zones ahead
Proper risk/reward of 1:2.92 offers excellent entry/exit structure for positional traders
Support at 963.00 provides good risk management anchor with well-defined stop placement
Stock positions itself well for continued upside exploration across multiple target levels
Volume profile supports the breakout move on the technical structure
Current price action already showing +4.20% gain, confirming momentum initiation
━━━━━━━━━━━━━━━━━━━━━━━━━━━━━━━━━━━━━━━━━━━
💡 TRADING STRATEGY NOTES
✓ Wait for weekly close above 1,039.40 before committing to fresh positions (confirmation is key)
✓ Consider scaling entries — don't go all-in at once; build position gradually on any dips
✓ Trail stoploss after each target level is achieved and confirmed on weekly basis
✓ Take partial profits at each resistance level — especially at 1st, 3rd, and 5th targets
✓ Preserve capital: Use strict position sizing and risk management (1-2% risk per trade)
✓ Monitor weekly closes carefully — price action at week-end is crucial for momentum confirmation
✓ Watch for gaps and opening levels — sudden reversals or news-driven moves can invalidate pattern
✓ ADANIENSOL is an infrastructure growth play — suitable for positional traders and growth-oriented investors
✓ The extended target range suggests patience may be rewarded with multi-week uptrend potential
━━━━━━━━━━━━━━━━━━━━━━━━━━━━━━━━━━━━━━━━━━━
⚠️ CRITICAL DISCLAIMER
🔴 THIS IS TECHNICAL ANALYSIS FOR EDUCATIONAL PURPOSES ONLY
🔴 THIS IS NOT FINANCIAL ADVICE OR AN INVESTMENT RECOMMENDATION
This analysis:
Is based on historical price patterns and technical indicators
Does NOT constitute investment advice or a buy/sell recommendation
Is a personal observation and technical analysis only
Should NOT be the sole basis for any investment decision
Stock performance depends on multiple macroeconomic factors and energy sector dynamics
━━━━━━━━━━━━━━━━━━━━━━━━━━━━━━━━━━━━━━━━━━━
⚠️ IMPORTANT RISKS TO UNDERSTAND
✓ Past performance does NOT guarantee future results
✓ Technical patterns can FAIL and trends can reverse suddenly
✓ Market conditions can change rapidly without warning
✓ This analysis is based on historical data only
✓ Stock investments carry significant risk of loss
✓ You may lose your ENTIRE investment amount
✓ This is a technical observation, NOT a guaranteed strategy
✓ Consult a qualified financial advisor before trading
✓ Do your own independent research (DYOR) before investing
✓ Use strict position sizing and risk management always
✓ Energy sector cyclicality can impact valuations and growth
✓ Regulatory changes affecting renewable energy incentives can impact business
✓ Market liquidity and volatility can impact execution and slippage
✓ Economic indicators and quarterly earnings can invalidate technical patterns
✓ Infrastructure project delays can affect revenue recognition and growth
━━━━━━━━━━━━━━━━━━━━━━━━━━━━━━━━━━━━━━━━━━━
🔴 FINAL RISK ACKNOWLEDGMENT
TRADING AND INVESTING IN STOCKS INVOLVES SUBSTANTIAL RISK OF LOSS.
I am NOT a financial advisor, fund manager, or investment professional. This analysis is provided for educational purposes and personal trading observation only. Past patterns do not guarantee future performance.
BEFORE MAKING ANY INVESTMENT DECISION:
✓ Conduct your own thorough research and due diligence
✓ Understand macroeconomic factors affecting energy and infrastructure sectors
✓ Check government policy trends and renewable energy incentive schemes
✓ Review latest quarterly earnings and project execution metrics
✓ Verify your risk appetite and capital availability
✓ Consult with a qualified, SEBI-registered financial advisor
✓ Only invest capital you can afford to lose completely
✓ Never follow this as a guaranteed strategy or signal
✓ Understand leverage implications if using derivatives or F&O
✓ Extended target ranges require patient capital and disciplined risk management
Your investment decisions are YOUR responsibility. Use proper risk management, stop losses, and position sizing always. Only risk capital you can afford to lose.
━━━━━━━━━━━━━━━━━━━━━━━━━━━━━━━━━━━━━━━━━━━
Trade responsibly. Risk management is paramount.
ADANIENT

Understanding the Adani Ports & Special Economic Zone Ltd (ADANIThis TradingView chart provides a long-term technical analysis of ADANIPORTS stock price from 2008 to late 2025, using a logarithmic scale to highlight exponential growth phases. It emphasizes key technical levels like All-Time Highs (ATHs), demand zones (support areas where buying pressure historically emerges), and breakouts/retests, which are classic patterns in technical analysis. The annotations mark historical bull runs (uptrends driven by momentum and volume), bearish runs (downtrends from corrections or external shocks), and pivotal events like failed ATH breaks or successful retests of previous highs/lows.
The "chart idea" revolves around trend continuation and historical pattern repetition: The stock has shown a multi-year uptrend with periodic consolidations and pullbacks to demand zones (e.g., yellow/orange horizontal lines around ₹200–₹400 and ₹800–₹1,000). Bull runs often follow breaks above ATHs (e.g., cyan arrows), leading to new demand zones higher up. Bearish runs occur on failed breaks (e.g., red circles) or external shocks, but the stock tends to retest and hold supports, resuming uptrends. Recent action (2024–2025) shows a potential "bull run start" on the D-break (daily timeframe) near ₹1,400, with demand zones at ₹1,000–₹1,200 acting as buffers. Overall, it suggests bullish bias if it holds above the 2023–2024 demand zone, targeting new ATHs beyond ₹1,500, but with risks on failed retests of the March 2025 ATH.
Key visual elements:
ATH Labels (A–E): Sequential highs (e.g., ATH A: Jun-14 ~₹300; ATH E: Jul-24 ~₹1,500), showing progressive higher highs.
Demand Zones: Horizontal bands (green/orange) where price bounced multiple times, indicating strong buyer interest.
Break/Retest Arrows: Green for successful bull breaks/retests; red for failures leading to pullbacks.
Trend: From 2009 low (~₹50), the stock has delivered ~30x returns, with bull phases accelerating post-2020.
Most Important Events Driving These Periods
Based on historical data, these events (sourced from company reports, earnings, and market news) align with the chart's bull/bear phases. They often triggered volume spikes, earnings beats, or external catalysts like expansions (bullish) vs. market crashes or corrections (bearish). I've summarized the top event per period in the table on chart, focusing on impact to stock price/momentum.
These events underscore how operational milestones (e.g., cargo records, expansions) fuel bull runs, while macro shocks (e.g., COVID, Hindenburg) trigger bears. The chart's demand zones have held ~80% of pullbacks, supporting a long-term bullish structure. For current trading (Dec 2025), watch ₹1,200 support— a hold could target ₹1,800+ in 2026. Always combine with fundamentals; past performance isn't indicative of future results.
NSE:ADANIPORTS

#ADANIENT – Massive Head & Shoulders Breakdown Loading?ADANIENT is completing a major weekly H&S pattern 👤, with price sliding toward the neckline.
It’s now sitting on the critical support zone: 1966–2078 ⚠️
A WCB below this zone can trigger a 50%+ fall, potentially revisiting the previous lows below 1000 📉 💣
Trend stays weak unless it reclaims 2614 on WCB. Stay alert! 👀
#ADANIENT #HeadnShouldersPattern #ChartPattern #PriceAction
📌 #Disclaimer: This analysis is shared for educational purposes only. It is not a buy/sell recommendation. Please do your own research before making any trading decisions.

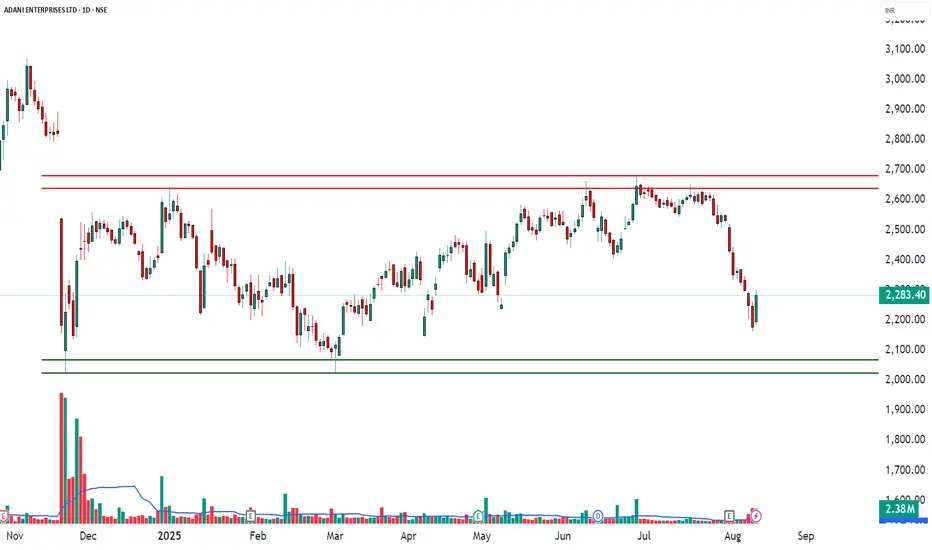
ADANIENT - Range Support Retest near 2280💹 Adani Enterprises Ltd (NSE: ADANIENT)
Sector: Conglomerate | CMP: 2280.00 | View: Range Support Retest near 2280
ADANIENT spent the day moving weakly, and the price behaviour was fairly simple to understand. The stock opened soft, tried to move up for a short while, but sellers stepped in around 2320–2340 and pushed it back down. After that, the price slowly fell and ended close to 2280 again. This shows that sellers were stronger throughout the day. The volumes also increased on the down-moves, which means the selling was genuine, not panic.
On bigger charts, the stock has been moving inside a wide range between 2240 at the bottom and 2600 at the top. Every time it tries to go up near 2320–2360 or even higher toward 2540–2600, it gets rejected. Since it is now close to the lower part of this range again, the stock is still sideways — not in a strong uptrend. For a beginner, the simple takeaway is: sellers are active above 2320, buyers support the stock near 2240–2280, and until one side breaks these levels, the stock will continue to move inside this range.
Today’s option activity shows that traders were expecting ADANIENT to stay within a range rather than make a big breakout. Call options (especially the 2300 CE) saw buying earlier in the day, which usually signals that some traders were hoping for an upward move if the stock stayed above support. However, not all call strikes were useful — some were too deep in the money or too far out of the money, making them less effective for quick intraday moves.
On the put side, a lot of traders were selling puts at 2280 and 2300. When traders sell puts, it usually means they believe the stock will stay above those levels. This also keeps put premiums lower, because sellers expect stability rather than a big fall. Since the price stayed near support, the put sellers had the advantage — they earned from slow premium decay.
Volatility (IV) remained moderate, meaning the market wasn’t expecting a huge jump or crash. The overall setup shows a tug-of-war: call buyers are holding on for a bounce, while put sellers are confident that 2280–2300 will act as a support zone.
In simple terms:
• If ADANIENT stays above 2280, call options may gain.
• If ADANIENT breaks below 2280, the fall may continue — but usually only after a retest confirms the breakdown.
This structure fits a typical range-bound market where both sides are active but support levels still matter.
For next session, the most important level on the chart is 2280. If the stock stays above this area, it can bounce toward 2320–2340. If it slips below 2280 and fails to get back above it, the next support lies around 2240–2250. For a bounce setup, the cleaner option is the 2300 CE — only take it if the stock holds 2280 and then climbs back above 2292–2295 on a 5 or 15-minute chart. Exit if the option premium drops around 20–25% or if the stock closes below 2275. For a breakdown setup, the safer choice is the 2260 PE, but only after the stock breaks 2280, retests it from below, and stays under 2275. Exit if the premium falls about 25–30% or if the spot goes back above 2285.
Avoid trading in the tight 2280–2298 band — price gets choppy there and option premiums decay quickly. Keep your position sizes reasonable and use strict stop-losses based on option premium, not just spot price. Watch how open interest and volumes behave — sudden changes often reveal the next move early. Overall, 2280–2300 is the fight zone. Holding it means a possible bounce; losing it opens the door to a deeper dip. Monday may be volatile in the first hour, so follow levels, watch volume, and react only after confirmation.
⚠️ STWP Legal Disclaimer
This document is strictly for educational and informational purposes. All examples, charts, levels, and option structures discussed are illustrative and are not intended as buy, sell, or hold recommendations. STWP does not provide investment advice, trading tips, signals, or personalized financial guidance of any kind, nor is it a SEBI-registered intermediary or research analyst. The analyses, illustrations, and risk–reward structures included here are generic in nature and based on publicly available data and observed market behaviour, which may change without notice. Financial markets involve significant risk; derivatives in particular carry the potential for substantial losses. Option premiums, implied volatility, open interest, delta, and other market variables can fluctuate rapidly and unpredictably.
Readers are solely responsible for their trading decisions, capital management, and risk assessment. Before making any investment or trading decision, please consult a SEBI-registered investment advisor. STWP, its representatives, and affiliates shall not be liable for any direct or indirect loss arising from the use of this material. Historical patterns or past market behaviour do not guarantee future outcomes, nor should any part of this document be interpreted as a promise of performance, accuracy, or returns.
Position Status: No active position in this instrument at the time of analysis.
Data Source: TradingView & NSE India.
💬 Found this useful?
🔼 Boost this post to support structured learning
✍️ Share your thoughts or questions in the comments
🔁 Forward this to traders who value clean technical studies
👉 Follow for disciplined, structured, STWP-style analysis
🚀 Stay Calm. Stay Clean. Trade With Patience.
Trade Smart | Learn Zones | Be Self-Reliant 📊

Adanient - Strong Bullish Momentum!!!Adanient showing Strong Bullish momentum
- Rounding bottom
-Inverted head and shoulders pattern
-Expanding channel pattern(shown as white dashed line)
-making higher highs and lower lows consistently
Target and Sl mentioned @ chart
not a tip nor advice...just sharing my view!!!!!
Thank you !!!

F&O Watchlist – Stocks with Action👋 Hello Traders!
Welcome to the Daily Options Trade Setup & Watchlist – 12th Sept 2025 🚀
The market is showing strong activity today with fresh long build-ups, surging volumes, and supportive OI data across key F&O names. Volatility remains balanced, creating opportunities for traders to ride the momentum while keeping risks in check.
This watchlist highlights stocks where data and trend are aligning, giving us a clearer picture of market sentiment and possible trading setups.
Let’s explore today’s opportunities 👇
ADANIENT | 11th Sept 2025
Overall Bias: Bullish
Spot Price: ₹2,446.50
Trend: Uptrend
Volatility: Moderate (IV ~24–25%)
Ideal Strategy Mix: Directional Bullish + OTM Convexity + Hedge via PE
________________________________________
✅ Bullish Trade (Naked options as per trend)
ADANIENT 2450 CE LTP @ ₹34.45
Why:
Long Build-up at 2450 CE → OI ↑ 173% with Price ↑ 118% (strong confirmation).
Volume surge 986% → heavy participation.
Delta 0.46 → balance of ITM probability & convexity.
Rising IV (5.9%) → supports premium expansion.
________________________________________
⚠️ Contrarian Trade (Naked options against trend)
ADANIENT 2300 PE LTP @ ₹21.50
Why:
Acts as a downside hedge in case of reversal.
IV 28.7% with IV ↑ 26.8% → room for premium spike.
Delta -0.33 → controlled risk hedge.
Suitable for protection if momentum stalls.
________________________________________
🎯 Strategy Trade (As per trend + OI data)
Bull Call Spread → 2450 CE LTP @ ₹34.45 & 2550 CE LTP @ ₹10.75
Why:
• Aligns with strong bullish OI build-up (2400–2600 CE cluster).
• Captures upside momentum with defined risk.
• Excellent R:R (1:3+) → low cost, high potential reward.
• Short CE hedge (2550) cuts theta decay and risk.
________________________________________
________________________________________
ADANIPORTS | 11th Sept 2025
Overall Bias: Bullish
Spot Price: ~₹1,438 (near 1440 zone)
Trend: Uptrend
Volatility: Moderate (IV ~23–26%)
Ideal Strategy Mix: Directional Bullish + OTM Convexity + Hedge via PE
________________________________________
✅ Bullish Trade (Naked options as per trend)
ADANIPORTS 1440 CE LTP @ ₹13.90
Why:
Long Build-up at 1440 CE → OI ↑ 100.6% with Price ↑ 50.3% (classic long-side confirmation).
Volume surge 524.5% → strong participation.
Delta 0.39 → sweet spot between ITM probability & convexity.
IV rising 20.7% → supportive of premium expansion.
________________________________________
⚠️ Contrarian Trade (Naked options against trend)
ADANIPORTS 1400 CE LTP @ ₹27.90 (used here as hedge/play on exhaustion)
Why:
Higher ITM CE with Delta 0.51 → limited convexity, may underperform if momentum slows.
OI ↑ only 12.3% → weaker build-up compared to mid-OTM strikes.
IV 23.0% (low side) → less premium expansion potential.
Can act as a contrarian hedge if market consolidates below 1440.
________________________________________
🎯 Strategy Trade (As per trend + OI data)
Bull Call Spread → ADANIPORTS 1440 CE LTP @ ₹13.90 & 1500 CE LTP @ ₹4.95
Why:
• Strong long build-ups across 1420–1460 strikes → confirms directional bias.
• Captures upside momentum with defined risk using OTM convexity (1500 CE).
• Excellent R:R (≈ 1:2+) → low debit, higher potential payoff.
• Short OTM CE (1500) reduces theta decay and caps risk.
________________________________________
________________________________________
AUROPHARMA | 11th Sept 2025
Overall Bias: Bullish
Spot Price: ~₹1,118 (near 1120 zone)
Trend: Uptrend
Volatility: Rich (IV ~30–32%)
Ideal Strategy Mix: Bullish Directional + Debit Spreads (IV hedging) + Convexity via OTM Calls
________________________________________
✅ Bullish Trade (Naked options as per trend)
AUROPHARMA 1140 CE LTP @ ₹18.95
Why:
Long Build-up → Price ↑ 351% with OI ↑ 280% (strong long confirmation).
Volume surge 1792% → very active participation.
Delta 0.40 → sweet convexity with good ITM odds.
IV rising 6.2% → supports premium expansion.
________________________________________
⚠️ Contrarian Trade (Naked options against trend)
AUROPHARMA 1060 CE LTP @ ₹64.25 (deep ITM hedge / slowdown risk)
Why:
Short covering at 1060 CE (OI ↓ 15.8%) → weaker continuation if fresh longs don’t add.
Higher ITM delta (0.74) → less convexity, less reward-to-risk.
IV rich (31.6%) → premiums already expensive.
Could underperform if price momentum cools off near resistance zones.
________________________________________
🎯 Strategy Trade (As per trend + OI data)
Bull Call Spread → AUROPHARMA 1120 CE LTP @ ₹26.65 & 1160 CE LTP @ ₹13.10
Why:
• Strong long build-ups between 1120–1160 strike cluster confirm bullish continuation.
• Captures upside momentum with limited debit exposure.
• IV ~30+ → spreads preferred over naked calls (reduces risk of IV crush).
• Good convexity → balance of ITM probability and upside leverage.
________________________________________
________________________________________
HAL | 11th Sept 2025
Overall Bias: Bullish
Spot Price: ~₹4,650 (near 4600–4700 zone)
Trend: Uptrend
Volatility: Moderate (IV ~25–28%)
Ideal Strategy Mix: Directional Bullish + OTM Convexity + Debit Spreads for IV balance
________________________________________
✅ Bullish Trade (Naked options as per trend)
HAL 4800 CE LTP @ ₹36.10
Why:
Long Build-up → Price ↑ 16.8% with OI ↑ 7% (fresh long confirmation).
Volume surge 72.5% → active participation.
Delta 0.34 → balance of convexity & ITM probability.
IV 25.7% → stable with upside potential.
________________________________________
⚠️ Contrarian Trade (Naked options against trend)
HAL 4500 CE LTP @ ₹158.55 (short covering driven, contrarian hedge)
Why:
Short covering at 4500 CE → OI ↓ 13.7% while Price ↑ 12.8%.
Delta 0.61 → deeper ITM, lower convexity.
Volume dropped 56% → thinner liquidity, size should be reduced.
Better suited as hedge / risk balancer in case momentum stalls.
________________________________________
🎯 Strategy Trade (As per trend + OI data)
Bull Call Spread → HAL 4800 CE LTP @ ₹36.10 & 4900 CE LTP @ ₹21.00
Why:
• OI build-up across 4700–4900 CE cluster confirms bullish continuation.
• Debit spread reduces IV risk (IV ~25–27%) and limits loss.
• Defined-risk setup with convexity at 4900 CE.
• Cleaner R:R profile compared to naked long calls.
________________________________________
________________________________________
TCS | 11th Sept 2025
Overall Bias: Bullish
Spot Price: ~₹3,135 (near 3140 zone)
Trend: Uptrend
Volatility: Moderate (IV ~17–19%)
Ideal Strategy Mix: Directional Bullish + OTM Convexity + Debit Spread to balance low IV
________________________________________
✅ Bullish Trade (Naked options as per trend)
TCS 3200 CE LTP @ ₹25.05
Why:
Long Build-up → Price ↑ 9.2% with OI ↑ 7.9% (long confirmation).
IV 17.9% → moderate, stable for option buying.
Delta 0.36 → sweet spot of convexity & ITM odds.
Fits directional bullish bias near resistance breakouts.
________________________________________
⚠️ Contrarian Trade (Naked options against trend)
TCS 3100 CE LTP @ ₹67.85 (short covering driven, weaker momentum trade)
Why:
Short covering at 3100 CE → OI ↓ 4% while Price ↑ 6.1%.
Volume dropped 72.5% → thin liquidity, size down.
IV 17.2% easing -5.3% → weaker premium expansion.
Higher ITM delta (0.59) → less convexity, limited upside gearing.
________________________________________
🎯 Strategy Trade (As per trend + OI data)
Bull Call Spread → TCS 3200 CE LTP @ ₹25.05 & 3300 CE LTP @ ₹8.25
Why:
• Strong long build-ups in 3140–3200 CE cluster confirm bullish continuation.
• Low IV environment (17–19%) → debit spreads attractive.
• Defined-risk setup with convexity via OTM CE (3300).
• Good balance of premium outlay vs reward with capped downside.
________________________________________
________________________________________
📘 My Trading Setup Rules
Avoid Gap Plays → Check pre-open price action to avoid trades influenced by gap-ups/gap-downs.
Breakout Entry Only → Enter trades only if price breaks previous day’s High (for bullish trades) or Low (for bearish trades).
Watch Volume for Confirmation → Monitor volume closely. No volume = No trade.
Enter on Strong Candle + Volume → Execute the trade only if a strong candle appears with increasing volume in the direction of the trade.
Defined Risk:Reward Only → Take trades only if R:R is favorable (ideally ≥ 1:2).
Premium Disclaimer → Option premiums shown are based on EOD prices — real-time premiums may vary during execution.
Time Frame Preference → Trade with your preferred time frame — this strategy works across intraday or positional setups.
⚠️ Disclaimer – Please Read Carefully
The information shared here is meant purely for learning and awareness. It is not a buy or sell recommendation and should not be taken as investment advice. I am not a SEBI-registered investment advisor, and all views expressed are based on personal study, chart patterns, and publicly available market data.
Trading — whether in stocks or options — carries risk. Markets can move unexpectedly, and losses can sometimes exceed the money you have invested. Past performance or past setups do not guarantee future results.
If you are a beginner, treat this as a guide to understand how the market works — practice on paper trades before risking real money. If you are experienced, always assess your own risk, position sizing, and strategy suitability before entering trades.
Consult a SEBI-registered financial advisor before making any real trading decision. By engaging with this content, you acknowledge full responsibility for your trades and investments.
💬 Found this useful?
🔼 Give this post a Boost to help more traders discover clean, structured learning.
✍️ Drop your thoughts, questions, or setups in the comments — let’s grow together!
🔁 Share with fellow traders and beginners to spread awareness.
👉 “If you liked this breakdown, follow for more clean, structured setups with discipline at the core.”
🚀 Stay Calm. Stay Clean. Trade With Patience.
Trade Smart | Learn Zones | Be Self-Reliant 📊
Watchlist Analysis – 12th Sept 2025📊 Watchlist Analysis – 12th Sept 2025
________________________________________
📌 ADANIENT (2398.80) – Rising Wedge
Momentum: Strong | Bullish | Risk: Low | Volume: High
Important Resistance Levels: 2499.68 / 2580.66 | Stop Loss: 2337.72
📊 Technical Indicators Explained
Adani Enterprises (ADANIENT) is flashing strong technical signals. A rising wedge structure 🔺 shows price tightening towards resistance, with today’s bullish breakout candle 🔥 backed by heavy volume surge 🚀. The RSI breakout ⚡ confirms strengthening momentum, while the BB Squeeze-Off release 📊 hints at a fresh volatility expansion. With support zones holding firm and price eyeing higher resistances, the stock is entering a decisive breakout zone.
Support & Resistance Zones
🟢 Support: 2353 | 2307 | 2275
🔴 Resistance: 2432 | 2464 | 2510
Investment Outlook & Conclusion
📈 Bullish Case – Strong momentum with volume support may push towards higher resistances.
📉 Bearish Case – A drop below SL can attract downside pressure.
⚡ Momentum Case – Aligned with momentum; good for short-term swings.
📅 Perspective – Short-term breakout play; long-term needs stability.
________________________________________
📌 AUROPHARMA (1109.20) – Double Bottom
Momentum: Strong | Bullish | Risk: High | Volume: High
Important Resistance Levels: 1175.93 / 1233.96 | Stop Loss: 1059.87
📊 Technical Indicators Explained
Aurobindo Pharma (AUROPHARMA) is flashing multiple bullish signals. A double bottom pattern 📉➡️📈 near ₹1016 confirms a strong reversal base, followed by a bullish breakout candle 🔥 backed by massive volume surge 🚀. The RSI breakout ⚡, Bollinger Band expansion 📊, and SuperTrend flip ✅ add conviction to the momentum. With supports holding firm and resistances ahead, the stock is entering a high-probability breakout zone.
Support & Resistance Zones
🟢 Support: 1074 | 1040 | 1018
🔴 Resistance: 1131 | 1153 | 1189
Investment Outlook & Conclusion
📈 Bullish Case – Heavy volume breakout supports upside continuation.
📉 Bearish Case – Failure to sustain above 1080 can bring weakness.
⚡ Momentum Case – Strong near-term upside; suitable for aggressive traders.
📅 Perspective – Short- to medium-term; long-term investors should watch risk levels.
________________________________________
📌 TATACHEM (968.25) - Symmetrical Triangle
Momentum: Strong | Bullish | Risk: Low | Volume: High
Resistance Levels: 1007.92 / 1039.84 | Stop Loss: 944.08
📊 Technical Indicators Explained
Tata Chemicals (TATACHEM) is showing strong bullish signals forming a Symmetrical Triangle. A bullish engulfing candle 🔥 near support highlights renewed buying interest, while an RSI breakout ⚡ confirms strengthening momentum. The Bollinger Band breakout 📊, along with VWAP support ✅, suggests rising participation. With a recent BB squeeze compression 🎯 now opening up, volatility expansion could fuel a decisive move. The stock is positioned in a potential breakout zone 🚀
Support & Resistance Zones
🟢 Support: 950 | 932 | 919
🔴 Resistance: 981 | 994 | 1012
Investment Outlook & Conclusion
📈 Bullish Case – Triangle consolidation may resolve higher on breakout.
📉 Bearish Case – Below SL, stock could revisit support levels.
⚡ Momentum Case – Neutral-to-positive; volume confirmation needed.
📅 Perspective – Short-term breakout opportunity; medium-term cautious stance.
________________________________________
📌 SHRIRAMFIN (620.05) – Downward Sloping Channel
Momentum: Strong | Bullish | Risk: Low | Volume: High
Resistance Levels: 643.69 / 664.48 | Stop Loss: 602.11
📊 Technical Indicators Explained
Shriram Finance (SHRIRAMFIN) has given a downward sloping channel breakout 📉➡️📈, signaling a shift from weakness to strength. An RSI breakout ⚡ confirms bullish momentum, while a BB Squeeze-Off setup 🎯 points to potential volatility expansion. The bullish price action 🔥 backed by rising volumes 🚀 suggests renewed buyer confidence. With resistances overhead, the stock now stands at a critical breakout zone, where follow-through buying could unlock further upside.
Support & Resistance Zones
🟢 Support: 608 | 595 | 588
🔴 Resistance: 628 | 635 | 648
Investment Outlook & Conclusion
📈 Bullish Case – Strong buying interest; scope for further upside.
📉 Bearish Case – Failure to hold above 602 may weaken momentum.
⚡ Momentum Case – Positive; traders may ride short-term moves.
📅 Perspective – Short-term play; long-term view requires caution.
________________________________________
⚠️ Disclaimer – Please Read Carefully
The information shared here is meant purely for learning and awareness. It is not a buy or sell recommendation and should not be taken as investment advice. I am not a SEBI-registered investment advisor, and all views expressed are based on personal study, chart patterns, and publicly available market data.
Trading — whether in stocks or options — carries risk. Markets can move unexpectedly, and losses can sometimes exceed the money you have invested. Past performance or past setups do not guarantee future results.
If you are a beginner, treat this as a guide to understand how the market works — practice on paper trades before risking real money. If you are experienced, always assess your own risk, position sizing, and strategy suitability before entering trades.
Consult a SEBI-registered financial advisor before making any real trading decision. By engaging with this content, you acknowledge full responsibility for your trades and investments.
💬 Found this useful?
🔼 Give this post a Boost to help more traders discover clean, structured learning.
✍️ Drop your thoughts, questions, or setups in the comments — let’s grow together!
🔁 Share with fellow traders and beginners to spread awareness.
👉 “If you liked this breakdown, follow for more clean, structured setups with discipline at the core.”
🚀 Stay Calm. Stay Clean. Trade With Patience.
Trade Smart | Learn Zones | Be Self-Reliant 📊
Options Watchlist — An Educational View of OI & Price Action________________________________________
📊 Options OI Trade Outlook — Bullish Setups Only
“This analysis is shared purely for educational purposes and market awareness — not a trading recommendation.”
(Educational Purpose | Not Financial Advice | SEBI Compliant)
Hello Traders 👋,
Here are 5 Bullish option setups based on today’s OI + Price Action + IV + Greeks study.
This is strictly for learning and educational purposes.
________________________________________
🟢 1. MARUTI 14800 CALL
LTP: 383.95
Sentiment: Bullish | Trend: Up | Strength: 5/5 (Strong)
IV: 20.5 | Delta: 0.53 | Theta: -8.64 | Vega: 17.6
Buildup: Long Build-up
Why?
This strike shows a Long Build-up with price rising 10.1% and OI up 38.2%, a textbook bullish confirmation.
Though volume dipped (-25.7%), IV rose 8.4% supporting premium expansion. Delta 0.53 signals strong ITM probability.
________________________________________
🟢 2. MARUTI 14700 CALL
LTP: 436.15
Sentiment: Bullish | Trend: Up | Strength: 5/5 (Strong)
IV: 20.5 | Delta: 0.56 | Theta: -8.66 | Vega: 17.4
Buildup: Long Build-up
Why?
14700 CE shows a Long Build-up with price up 9.8% and OI up 15.7%, confirming bullish sentiment.
Volume is lower (-33.5%), but IV rising 9.2% supports premiums. Delta 0.56 shows strong ITM odds.
________________________________________
🟢 3. ADANIENT 2300 CALL
LTP: 70.15
Sentiment: Bullish | Trend: Up | Strength: 5/5 (Strong)
IV: 27.6 | Delta: 0.52 | Theta: -2.35 | Vega: 2.7
Buildup: Long Build-up
Why?
2300 CE has a Long Build-up with price up 4.4% and OI soaring 81%, backed by a 219% volume surge.
IV rising 5.5% confirms premium expansion. Strong participation makes this a convincing bullish setup.
________________________________________
🟢 4. TITAN 3650 CALL
LTP: 77.4
Sentiment: Bullish | Trend: Up | Strength: 5/5 (Strong)
IV: 16.6 | Delta: 0.53 | Theta: -2.13 | Vega: 4.3
Buildup: Long Build-up
Why?
3650 CE shows a Long Build-up, with price rising 22.2% and OI up 46.2%, supported by strong volume (+89%).
IV is moderate at 16.6, and Delta at 0.53 signals strong ITM chances.
________________________________________
🟢 5. POLYCAB 7200 CALL
LTP: 184
Sentiment: Bullish | Trend: Up | Strength: 5/5 (Strong)
IV: 24.3 | Delta: 0.51 | Theta: -6.32 | Vega: 8.5
Buildup: Long Build-up
Why?
7200 CE has a powerful Long Build-up, with price up 5.8% and OI surging 364%, supported by a massive 1552% volume jump.
IV at 24.3 is stable but rising, confirming strength.
________________________________________
⚠️ Disclaimer – Please Read Carefully
The information shared here is meant purely for learning and awareness.
It is not a buy or sell recommendation and should not be taken as investment advice.
📌 I am not a SEBI-registered investment advisor.
📌 All views expressed are based on personal study, chart patterns, and publicly available data.
📌 Trading — whether in stocks or options — carries risk. Markets can move unexpectedly, and losses can exceed capital.
📌 Past setups do not guarantee future outcomes.
👉 Beginners: use this to learn market behavior, practice with paper trades before risking money.
👉 Experienced traders: apply your own risk management, sizing, and strategy filters.
👉 Always consult a SEBI-registered financial advisor before real trades.
By engaging with this content, you acknowledge full responsibility for your own trading and investments.
________________________________________
💬 Found this useful?
🔼 Boost this post to help more traders learn.
✍️ Share your thoughts/setups in comments — let’s grow together.
🔁 Share with fellow traders & learners.
👉 “Follow for more clean, structured breakdowns with discipline at the core.”
🚀 Stay Calm. Stay Clean. Trade With Patience.
Trade Smart | Learn Zones | Be Self-Reliant 📊
________________________________________
ADANIENT – Options Trade Snapshot📄 ADANIENT – Options Trade Snapshot (Educational Analysis)
Date: 12 Aug 2025
Spot Price: ₹2,283.40
Market View: Bullish bias based on option data & price structure
Overall Sentiment: Positive – multiple Call short coverings and fresh Put short build-ups
Volatility (IV): 34.5% – 51.4% (moderate–high, suggesting option premiums are relatively elevated)
Analysis Purpose: For market study & understanding of option chain signals
1️⃣ Observed Bullish Setup – 2300 Call Option
LTP: ₹64.05
Breakeven (for understanding): ₹2,364.05
Notable Data Points:
Volume spike: 22,099 contracts (166% higher than usual)
IV decreased while price increased → generally indicates aggressive buying
Delta ~0.5 → option price moves about ₹0.50 for every ₹1 in underlying
2️⃣ Observed Neutral-to-Bullish Setup – 2250 Put Option
LTP: ₹51.55
Breakeven (for understanding): ₹2,198.45
Notable Data Points:
Large open interest addition (+105,600 contracts / +47.5%)
Many traders appear to be expecting price to remain above 2250
Theta ~ -2.84/day → higher time decay benefits sellers in such positions
3️⃣ Observed Bullish Spread Structure – 2300 CE + 2400 CE
Leg 1: 2300 CE @ ₹64.05
Leg 2: 2400 CE @ ₹28.40 (short)
Net Cost (for study): ₹35.65
Maximum Risk: ₹6,238.75 (per lot)
Maximum Reward: ₹11,261.25 (per lot)
Breakeven Level: ₹2,335.65
Why:
Limits risk vs naked CE buy while keeping upside potential until 2400.
OI data supports bullish trend above 2300, resistance near 2400.
Lower IV on CE side helps spread entry.
Suitable for moderate upside with controlled risk.
📘 My Trading Setup Rules
Avoid Gap Plays
→ Check pre-open price action to avoid trades influenced by gap-ups/gap-downs.
Breakout Entry Only
→ Enter trades only if price breaks previous day’s High (for bullish trades) or Low (for bearish trades).
Watch Volume for Confirmation
→ Monitor volume closely. No volume = No trade.
Enter on Strong Candle + Volume
→ Execute the trade only if a strong candle appears with increasing volume in the direction of the trade.
Defined Risk:Reward Only
→ Take trades only if R:R is favorable (ideally ≥ 1:2).
Premium Disclaimer
→ Option premiums shown are based on EOD prices — real-time premiums may vary during execution.
Time Frame Preference
→ Trade with your preferred time frame — this strategy works across intraday or positional setups.
Disclaimer:
This analysis is for educational and informational purposes only and is not investment advice. The data presented is based on publicly available market information and represents a study of price action and option chain behaviour. Trading in securities/derivatives involves substantial risk, and past performance is not indicative of future results. Please consult your SEBI-registered investment advisor before making any investment or trading decisions.
Thinking big. Doing better - "Hum Karke Dikhate Hain"Adani Enterprises Ltd - CMP - 2636
About
Adani Enterprises Ltd has business interests in various economic areas such as mining, integrated resources management (IRM), infrastructure such as airports, roads, rail/ metro, water, data centres, solar manufacturing, agro and defence.
This is just to boost my confidence. No Suggestions for buying. I will keep checking and updating my mistake if last post gone wrong...
Disclosure: I am not SEBI registered. The information provided here is for educational purposes only. I will not be responsible for any of your profit/loss with these suggestions. Consult your financial Adviser before making any decisions.
$NSE:NIFTY - Analysis For Tomorrow!🚨 Nifty 50 Breakout Incoming? | Symmetrical Triangle on 15-min Chart.
NSE:NIFTY is consolidating within a symmetrical triangle pattern on the 15-minute chart — a classic setup that often leads to a strong breakout or breakdown.
📊 Chart Setup:
Pattern: Symmetrical Triangle (Neutral)
Price Action: Compressing between rising support & falling resistance
View : Price nearing the tip — breakout imminent
✅ Bullish Scenario:
Breakout above 24,541
Targets: 24,666 → 24,737
✅ Watch for volume confirmation and follow-through candles
❌ Bearish Scenario:
Breakdown below 24,383
Targets: 24,186 → 24,041
❗ Confirm with a breakdown candle + failed retest
🔑 Key Support & Resistance:
Resistance: 24,541 | 24,666 | 24,737
Support: 24,383 | 24,186 | 24,041
📌 Note: Symmetrical triangles are neutral patterns. Wait for a confirmed breakout/breakdown with strong volume before entering a trade.

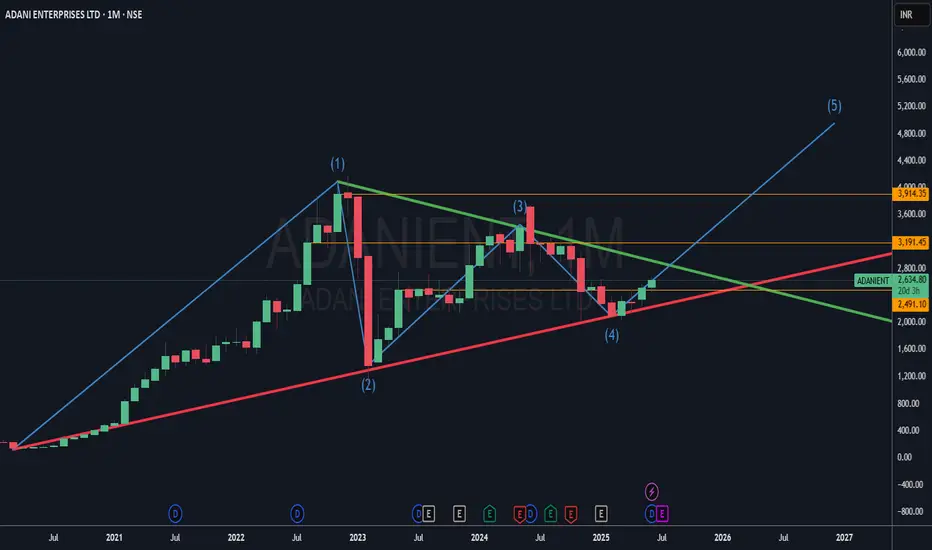
ADANIENT - Bulls getting ready to bump up ?????!!!Y essss!!! !
Chart patterns inculcating me the above titled opinion.
1. Monthly timeframe shows the symmetrical triangle pattern from 2020 till now, now the stock at support line(chart image shown below)
2. Weekly time frame shows us the INSIDE BAR candlestick pattern(mother baby pattern) with good volumes....with the low umtested till now.(made the low of 2025 on 22 nov 2024)
3. Daily time frame shows the Breakout attempt out of the 11 month old trendline.
4. Now, with the results on may 1, we can expect a volatile move.... .with the inverted h&s pattern around the corner.
Voluminous Entry can be made after the BREAKOUT WITH GOOD VOLUMES...
will update once the breakout happens.
Just add it to your watchlist and keep an eye on it.
THIS IS JUST MY OPINION..NOT A TIP NOR ADVICE.
Thank you .
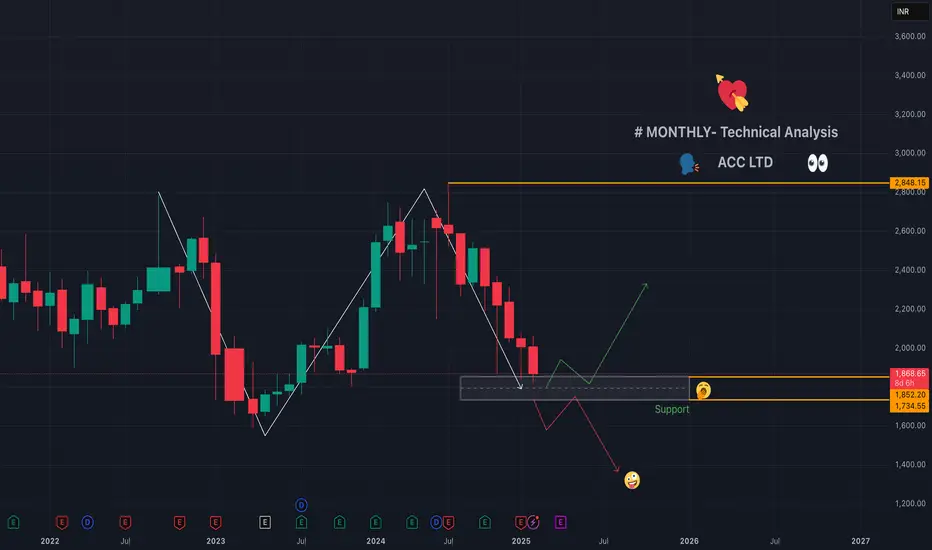
ACC LTD - Technical - Monthly Chart😍❣️#ACC Limited, founded in 1936 as Associated Cement Companies Limited, is one of India’s oldest and most prominent cement manufacturers. Headquartered in Mumbai, it became a subsidiary of the #AdaniGroup in September 2022 💕😍
📉Chart for your reference
Can a Corporate Titan Withstand the Tremors of Allegations?In the high-stakes arena of global business, few narratives captivate the imagination quite like the meteoric rise and sudden turbulence of an economic powerhouse. The Adani Group once celebrated as a paragon of Indian entrepreneurial success, now finds itself navigating treacherous waters of legal scrutiny and market skepticism. What began as a remarkable journey of a diamond trader turned infrastructure magnate has transformed into a complex tale of ambition, power, and potential corporate misconduct that challenges our understanding of success in the modern economic landscape.
The allegations against Gautam Adani—ranging from securities fraud to a purported massive bribery scheme—represent more than just a corporate challenge; they symbolize a pivotal moment of reckoning for corporate governance in emerging markets. With U.S. prosecutors indicting Adani and a damaging report by Hindenburg Research accusing the group of "the largest con in corporate history," the conglomerate has witnessed a staggering $68 billion evaporation of market value. This precipitous fall from grace serves as a stark reminder that even the most seemingly invincible corporate empires can be vulnerable to the harsh light of forensic scrutiny and legal investigation.
The unfolding saga transcends the individual narrative of Gautam Adani, touching upon broader themes of economic development, political connections, and the delicate balance between entrepreneurial ambition and ethical conduct. As the Adani Group confronts these unprecedented challenges, the world watches with bated breath, understanding that the outcome will not merely determine the fate of one business empire, but potentially reshape perceptions of India's economic credibility on the global stage. The resilience, transparency, and response of the Adani Group in the face of these allegations will serve as a critical case study in corporate accountability and the complex interplay between business, politics, and regulatory oversight.
Ultimately, this narrative invites us to reflect on the fundamental principles of corporate integrity and the thin line between visionary entrepreneurship and potential systemic manipulation. As investors, policymakers, and global observers, we are compelled to ask: Can reputation, built over decades, withstand the seismic tremors of serious allegations? The Adani Group's journey offers a compelling, real-time exploration of this profound question, challenging our assumptions about success, power, and the intricate mechanisms that govern global business ecosystems.

Adani Buy 2400 Call Sell 2600 Call : Buy Call SpreadAdani Buy 2400 at 164 Call Sell 2600 Call 88.
This is a defined profit defined loss trade, net debit trade, however see a good upside and can gan give good return.
TnC for options apply, these both can be zero and then also the net loss will be 88 aprox

Adani Enterprises: 100 pts long trade.First of all Happy Deepavali to Everyone. Wish everyone a happy trading year.
* Previous ICICI Bank trade worked out very well achieving all its targets. Still following the trend channel.
* Adani enterprise after taking A strong support from 2700 level on the way to retest its swing high 3100 - 3200.
* Presently trading on fib retracement zone of 0.5 to 0.6 at 2950 level.
*Trade levels for the trade
Target levels: 3100-3200 (if resistance breaks, can take more risk)
Stop loss: 2900
Risk/Reward ratio: 1:2

ADANIENT#ADANIENT AGAIN on MOMEMTUM
SELL ONLY BELOW 2650
STOP 2750
TARGET 2100 (600 POINTS)
TIME 15 DAYS
TRADE ONLY ON
If it break below 2650 then only trade II be active
Trade only in futures contract
Its an flag pattern breakout
#ADANIENT

Adanient bullish flagAdanient formed bullish flag on buy side in 15 mins. Expected to reach target tomorrow. Keep in mind 15 mins formation may not work and watch it for study purposes

BANKNIFTYT IMPORTANT LEVELS FOR TOMORROW, 14TH AUGUST NSE:BANKNIFTY ANALYSIS FOR TOMORROW 🔺
❇️ IMPORTANT LEVELS 🚀
❇️ Support: 49800-49720-49535-49220
❇️ Resistance : 49000-50020-50205-50400-50520
👉🏻 PURPLE LINE : 50018 is a key level, above buying, Below selling.
👉🏻 @thetradeforecast 🇮🇳

Adani ENterpriseHindenburg Research on August 10 released a new report alleging market watchdog Sebi chairperson Madhabi Buch. The report alleged that Madhabi and her husband Dhaval Buch were involved in Adani Group's offshore funds. The report said that these obscure financial systems were allegedly used in the “money siphoning scandal."
The Stock is already finding pressure to cross 3300 mark.
I personally feel if the sentiment worsons then its an opportunity to buy...
Below 3127 on closing basis it will find more pressure for profit booking...
Support levels are marked for entry
Now 3360-70 will act as strong resistance short term (couple of months)
Happy Trading.

ULTRATECH CEMENT AT CRUCIAL LEVEL, 12TH AUGUST NSE:ULTRACEMCO
❇️Ultratech cement at good support level.. recently tested 3 times, now again at same price level.
👉🏻And according to hindenbrugs new and reports.. we can see opportunities
🔗As you can see on chart;
❇️Purple lines are key levels
👉🏻Above one gives you good opportunity to long.
👉🏻And below one give you good opportunity to short.
❇️Other levels are not targets they are a good supply and demand zone were market/stock can reverse or rest (pause). It help you as trailing your SLs /targets
@thetradeforecast

BANKNIFTY IMPORTANT LEVELS FOR TOMORROW, 12TH AUGUST NSE:BANKNIFTY ANALYSIS FOR TOMORROW 🔺
❇️ IMPORTANT LEVELS 🚀
❇️ Support: 50350-50160-49860-49550-49231
❇️ Resistance : 50450-50750-51066-51380
👉🏻 PURPLE LINE is a key level, above buying, Below selling.
👉🏻 @thetradeforecast 🇮🇳

Adani Enterprises Levels For 12 August-14 AugustImportant support and Resistance Levels For Adani Enterprises.
When Market touches the level, the price action plays important roles.
For More Learning Reach out to us.
