ADANIENSOL Weekly Bullish Flag BO | Multiple Targets to 1,262.45ADANIENSOL (Adani Energy Solutions Limited) – Weekly Analysis
━━━━━━━━━━━━━━━━━━━━━━━━━━━━━━━━━━━━━━━━━━━
📊 TECHNICAL SETUP
Current Price: 1,057.90 (+4.20%)
Timeframe: Weekly (1W)
Symbol: ADANIENSOL (Adani Energy Solutions Limited)
Exchange: NSE
Category: Stock / Energy & Infrastructure Sector
━━━━━━━━━━━━━━━━━━━━━━━━━━━━━━━━━━━━━━━━━━━
🎯 PATTERN ANALYSIS
ADANIENSOL demonstrates a STRONG WEEKLY BULLISH FLAG BREAKOUT pattern:
✅ Flag Structure: Clear flagpole followed by tight consolidation in the 1,020–1,050 range
✅ Breakout Confirmation: Price decisively breaking above upper flag boundary on strong weekly candles with increasing momentum
✅ Support Levels: Strong support identified at 1,039.40 with SL at 963.00 for risk management
✅ Volume Profile: Visible volume participation on the breakout confirming institutional interest
✅ Momentum: Sustained bullish momentum with stock now trading above consolidation levels (+4.20% already)
✅ Risk/Reward: Well-defined multi-target setup with excellent risk-reward ratio and extended upside potential
The stock shows textbook uptrend characteristics with proper support/resistance relationships, confirming the bullish flag breakout is a continuation pattern with multiple profit-taking opportunities.
━━━━━━━━━━━━━━━━━━━━━━━━━━━━━━━━━━━━━━━━━━━
📈 PRICE TARGETS (Progressive Levels)
1st Target: 1,113.75 (+5.3% from current)
2nd Target: 1,150.90 (+8.8% from current)
3rd Target: 1,188.10 (+12.3% from current)
4th Target: 1,225.25 (+15.8% from current)
5th Target: 1,262.45 (+19.3% from current)
6th Target: 1,300+ (Extended target zone - additional upside beyond 5th target)
These progressive targets represent key resistance zones and profit-taking levels along the uptrend trajectory. Each target should be treated as a potential decision point for scaling profits while maintaining exposure to further upside. The extended target structure suggests strong upside potential with multiple stepping stones for systematic profit realization across the energy and infrastructure rally.
━━━━━━━━━━━━━━━━━━━━━━━━━━━━━━━━━━━━━━━━━━━
🛡️ RISK MANAGEMENT
Entry Zone: 1,039.40 (Breakout confirmation point - primary entry level after flag breakout)
Stoploss: 963.00 (Weekly support - critical invalidation level marked as "SL on WCB")
Risk/Reward Ratio:
Risk (1,039.40 to 963.00) = 76.40 points
Reward (1,039.40 to 1,262.45) = 223.05 points
R:R Ratio = 1:2.92 (Excellent)
Position Sizing: Risk only 1-2% of capital per trade
Stoploss is placed BELOW major weekly support level to ensure proper risk containment.
Consider scaling in on dips toward the 1,039.40 entry zone for better average entries.
━━━━━━━━━━━━━━━━━━━━━━━━━━━━━━━━━━━━━━━━━━━
📍 KEY SUPPORT & RESISTANCE
Immediate Support: 1,039.40 (Breakout/Buy zone - initial entry opportunity)
Secondary Support: 963.00 (Stoploss / Major weekly support - invalidation zone)
Resistance 1: 1,113.75 (1st Target)
Resistance 2: 1,188.10 (3rd Target - mid-term resistance)
Resistance 3: 1,225.25 (4th Target)
Major Resistance: 1,262.45+ (5th Target / Extended upside potential)
Intermediate Levels: Multiple targets provide stepping stones for profit realization at each resistance level, allowing systematic position management and partial profit booking throughout the uptrend.
━━━━━━━━━━━━━━━━━━━━━━━━━━━━━━━━━━━━━━━━━━━
🔍 FUNDAMENTAL BACKDROP – ENERGY & INFRASTRUCTURE STRENGTH
ADANIENSOL benefits from strong macro tailwinds in energy and infrastructure sectors:
✅ Renewable Energy Growth: India's accelerated renewable energy adoption and net-zero targets driving demand
✅ Transmission Expansion: Power transmission infrastructure expansion creating growth opportunities
✅ Government Policy: Government support for clean energy and infrastructure development initiatives
✅ Asset Monetization: Strategic asset monetization opportunities supporting valuation expansion
✅ Infrastructure Capex: India's robust infrastructure capex spending cycle supporting energy demand
✅ Margin Profile: Improving operational efficiency and margin profile in energy transmission business
✅ Growth Visibility: Multi-year visibility on revenue and earnings growth from infrastructure expansion
This macro backdrop combined with strong technical structure reinforces bullish conviction for trend-following strategies on dips.
━━━━━━━━━━━━━━━━━━━━━━━━━━━━━━━━━━━━━━━━━━━
🎉 TECHNICAL OBSERVATIONS
Weekly uptrend remains intact with clear higher highs and higher lows forming
Flag breakout on volume confirms institutional participation and buying strength
Stock breaking above consolidation levels — a classic sign of strength in energy infrastructure play
Breakout from a tight consolidation pattern shows disciplined buying entering the stock
Multiple targets (5-6 levels) suggest strong extended upside with multiple resistance zones ahead
Proper risk/reward of 1:2.92 offers excellent entry/exit structure for positional traders
Support at 963.00 provides good risk management anchor with well-defined stop placement
Stock positions itself well for continued upside exploration across multiple target levels
Volume profile supports the breakout move on the technical structure
Current price action already showing +4.20% gain, confirming momentum initiation
━━━━━━━━━━━━━━━━━━━━━━━━━━━━━━━━━━━━━━━━━━━
💡 TRADING STRATEGY NOTES
✓ Wait for weekly close above 1,039.40 before committing to fresh positions (confirmation is key)
✓ Consider scaling entries — don't go all-in at once; build position gradually on any dips
✓ Trail stoploss after each target level is achieved and confirmed on weekly basis
✓ Take partial profits at each resistance level — especially at 1st, 3rd, and 5th targets
✓ Preserve capital: Use strict position sizing and risk management (1-2% risk per trade)
✓ Monitor weekly closes carefully — price action at week-end is crucial for momentum confirmation
✓ Watch for gaps and opening levels — sudden reversals or news-driven moves can invalidate pattern
✓ ADANIENSOL is an infrastructure growth play — suitable for positional traders and growth-oriented investors
✓ The extended target range suggests patience may be rewarded with multi-week uptrend potential
━━━━━━━━━━━━━━━━━━━━━━━━━━━━━━━━━━━━━━━━━━━
⚠️ CRITICAL DISCLAIMER
🔴 THIS IS TECHNICAL ANALYSIS FOR EDUCATIONAL PURPOSES ONLY
🔴 THIS IS NOT FINANCIAL ADVICE OR AN INVESTMENT RECOMMENDATION
This analysis:
Is based on historical price patterns and technical indicators
Does NOT constitute investment advice or a buy/sell recommendation
Is a personal observation and technical analysis only
Should NOT be the sole basis for any investment decision
Stock performance depends on multiple macroeconomic factors and energy sector dynamics
━━━━━━━━━━━━━━━━━━━━━━━━━━━━━━━━━━━━━━━━━━━
⚠️ IMPORTANT RISKS TO UNDERSTAND
✓ Past performance does NOT guarantee future results
✓ Technical patterns can FAIL and trends can reverse suddenly
✓ Market conditions can change rapidly without warning
✓ This analysis is based on historical data only
✓ Stock investments carry significant risk of loss
✓ You may lose your ENTIRE investment amount
✓ This is a technical observation, NOT a guaranteed strategy
✓ Consult a qualified financial advisor before trading
✓ Do your own independent research (DYOR) before investing
✓ Use strict position sizing and risk management always
✓ Energy sector cyclicality can impact valuations and growth
✓ Regulatory changes affecting renewable energy incentives can impact business
✓ Market liquidity and volatility can impact execution and slippage
✓ Economic indicators and quarterly earnings can invalidate technical patterns
✓ Infrastructure project delays can affect revenue recognition and growth
━━━━━━━━━━━━━━━━━━━━━━━━━━━━━━━━━━━━━━━━━━━
🔴 FINAL RISK ACKNOWLEDGMENT
TRADING AND INVESTING IN STOCKS INVOLVES SUBSTANTIAL RISK OF LOSS.
I am NOT a financial advisor, fund manager, or investment professional. This analysis is provided for educational purposes and personal trading observation only. Past patterns do not guarantee future performance.
BEFORE MAKING ANY INVESTMENT DECISION:
✓ Conduct your own thorough research and due diligence
✓ Understand macroeconomic factors affecting energy and infrastructure sectors
✓ Check government policy trends and renewable energy incentive schemes
✓ Review latest quarterly earnings and project execution metrics
✓ Verify your risk appetite and capital availability
✓ Consult with a qualified, SEBI-registered financial advisor
✓ Only invest capital you can afford to lose completely
✓ Never follow this as a guaranteed strategy or signal
✓ Understand leverage implications if using derivatives or F&O
✓ Extended target ranges require patient capital and disciplined risk management
Your investment decisions are YOUR responsibility. Use proper risk management, stop losses, and position sizing always. Only risk capital you can afford to lose.
━━━━━━━━━━━━━━━━━━━━━━━━━━━━━━━━━━━━━━━━━━━
Trade responsibly. Risk management is paramount.
ADANIPORTS

Understanding the Adani Ports & Special Economic Zone Ltd (ADANIThis TradingView chart provides a long-term technical analysis of ADANIPORTS stock price from 2008 to late 2025, using a logarithmic scale to highlight exponential growth phases. It emphasizes key technical levels like All-Time Highs (ATHs), demand zones (support areas where buying pressure historically emerges), and breakouts/retests, which are classic patterns in technical analysis. The annotations mark historical bull runs (uptrends driven by momentum and volume), bearish runs (downtrends from corrections or external shocks), and pivotal events like failed ATH breaks or successful retests of previous highs/lows.
The "chart idea" revolves around trend continuation and historical pattern repetition: The stock has shown a multi-year uptrend with periodic consolidations and pullbacks to demand zones (e.g., yellow/orange horizontal lines around ₹200–₹400 and ₹800–₹1,000). Bull runs often follow breaks above ATHs (e.g., cyan arrows), leading to new demand zones higher up. Bearish runs occur on failed breaks (e.g., red circles) or external shocks, but the stock tends to retest and hold supports, resuming uptrends. Recent action (2024–2025) shows a potential "bull run start" on the D-break (daily timeframe) near ₹1,400, with demand zones at ₹1,000–₹1,200 acting as buffers. Overall, it suggests bullish bias if it holds above the 2023–2024 demand zone, targeting new ATHs beyond ₹1,500, but with risks on failed retests of the March 2025 ATH.
Key visual elements:
ATH Labels (A–E): Sequential highs (e.g., ATH A: Jun-14 ~₹300; ATH E: Jul-24 ~₹1,500), showing progressive higher highs.
Demand Zones: Horizontal bands (green/orange) where price bounced multiple times, indicating strong buyer interest.
Break/Retest Arrows: Green for successful bull breaks/retests; red for failures leading to pullbacks.
Trend: From 2009 low (~₹50), the stock has delivered ~30x returns, with bull phases accelerating post-2020.
Most Important Events Driving These Periods
Based on historical data, these events (sourced from company reports, earnings, and market news) align with the chart's bull/bear phases. They often triggered volume spikes, earnings beats, or external catalysts like expansions (bullish) vs. market crashes or corrections (bearish). I've summarized the top event per period in the table on chart, focusing on impact to stock price/momentum.
These events underscore how operational milestones (e.g., cargo records, expansions) fuel bull runs, while macro shocks (e.g., COVID, Hindenburg) trigger bears. The chart's demand zones have held ~80% of pullbacks, supporting a long-term bullish structure. For current trading (Dec 2025), watch ₹1,200 support— a hold could target ₹1,800+ in 2026. Always combine with fundamentals; past performance isn't indicative of future results.
NSE:ADANIPORTS

ADANIPORTS : Almost Cup and Handle Breakout Adaniports is near its cup and handle Breakout phase and also Near ATH as market... let's see how its perform from here..
All data is available in public domain..
CMP : 1516
SL : Below Daily 21 EMA
Stock's selection based on 5 Point Analysis:
1: Idea : Cup and Handle Breakout.
2: Support : Volume, Delivery .
3: Technical : 21/55/200-EMA, Super trend up, RS>0 RSI.
4: Fundamental : PE, PAT, Industry & peer PE and sector performance.
5: Timing : Entry Timing on Daily chart.
Disclaimer : It is my personal view as a trader and for educational purpose only. Equity market involves risk .
Please consult your financial adviser before taking any decision.
Disclosure : Holding

Adani Ports & Special Economic Zone LtdCurrent price shown: ₹1,450.50, up ₹7.40 (+0.51%).
The chart displays a strong uptrend from late August onward.
A rising trendline (blue, upward-sloping) supports the price from the lows of September through November.
Price has recently pulled back slightly but is still near the upper resistance zone.
Major resistance zone highlighted: around ₹1,515–₹1,530.
Support level marked near ₹1,467–₹1,480 (shaded lower red area).
The price is currently trading close to resistance.
Volume bars at the bottom show moderate trading activity, with occasional spikes.
No abnormal volume at the latest price area.

ADANI PORTS: Looking Lucrative Deal!1. Bounce from EMA.
2. Strong support levels.
3. Expecting it to change the structure to bullish on lowertime and then enter. Mostly a little lower rpice would be better around 1000 round level.
⚠️ Disclaimer: This is NOT a buy/sell recommendation. This post is meant for learning purposes only. Views are personal. Please, do your due diligence before investing.⚠️
💬 Drop your thoughts below in the comments section if you liked this analysis!✌️
🔥Happy trading!✅🚀

ADANI PORTS | Bullish Momentum + RSI Breakout - STWP________________________________________
📊 ADANI PORTS | Bullish Momentum + RSI Breakout 🚀
Ticker: NSE: ADANIPORTS | Sector: Port & Logistics
CMP: ₹1,437.80
Rating: ⭐⭐⭐⭐ (Bullish Momentum Breakout – For Educational Purposes Only)
Pattern Observed: 📈 Price Action Setup – Breakout from Consolidation Zone
Candlestick Pattern: Strong Bullish Momentum Candle
________________________________________
🟦 Chart Summary
Adani Ports has formed a strong bullish candle on high volume, breaking above a short-term consolidation resistance zone. The structure reflects renewed buying strength and momentum, suggesting a possible continuation toward higher resistance levels in the near term.
________________________________________
🟨 Technical Indicators Summary
The chart highlights Bullish Momentum supported by a Strong Bullish Candle, indicating renewed buying interest. A clear RSI breakout confirms strengthening momentum, while the Bollinger Band Squeeze-On Compression suggests that volatility is contracting — often a precursor to a sharp directional move. This combination of momentum, structure, and volume alignment signals a potential breakout zone, reflecting a powerful setup where multiple indicators converge to reinforce short-term bullish sentiment.
________________________________________
🟩 Supports: 1,408 / 1,379 / 1,362
🟥 Resistances: 1,454 / 1,471 / 1,500
________________________________________
🟩 Swing Trade Study (Educational Viewpoint)
From a technical study perspective, Adani Ports is showing signs of a bullish breakout above ₹1,441.90, which may signal momentum continuation. The reference support for this structure lies near ₹1,387.10, defining the chart-based risk zone of around ₹54.8. This observation is shared only for educational and analytical purposes to demonstrate structured swing analysis.
________________________________________
🟩 Intraday Observation (For Learning Purposes)
For intraday study, the potential bullish breakout zone lies between ₹1,437.80 and ₹1,442, with immediate support around ₹1,424. Any price reaction near ₹1,430–₹1,435 could serve as an educational case for identifying intraday re-entry zones when price retests breakout areas. Traders should always apply strict stop-loss and risk management if trading live.
Final Outlook: Momentum: Strong, Trend: Bullish, Risk: Low, Volume: High
💡 Learning Note:
This case study helps learners understand how volume confirmation, RSI breakout, and price structure alignment can signal early trend continuation opportunities — a key concept in technical market reading.
________________________________________
⚠️ Disclosure & Disclaimer (SEBI-Compliant)
This content is created solely for educational and informational purposes to help readers understand technical analysis and market structure.
It does not constitute investment advice, research recommendation, or a solicitation to buy or sell any security.
The author is not a SEBI-registered investment adviser or research analyst.
All charts, patterns, and levels are based on personal study and historical data available from public sources such as TradingView and NSE India.
Position Status: No active position in ADANIPORTS at the time of publication.
Trading and investing involve risk. Market movements can be unpredictable, and losses may exceed invested capital.
Readers are strongly advised to consult a SEBI-registered investment adviser before making any trading or investment decisions.
By engaging with this post, you acknowledge that you take full responsibility for your own trades, decisions, and outcomes.
________________________________________
💬 Found this useful?
🔼 Boost this post to support structured learning content.
✍️ Share your thoughts, questions, or observations — let’s grow together!
🔁 Share with learners and traders to promote responsible market education.
👉 “If you liked this breakdown, follow for more disciplined, educational trade setups.”
🚀 Stay Calm. Stay Clean. Trade With Patience.
Trade Smart | Learn Zones | Be Self-Reliant 📊
________________________________________

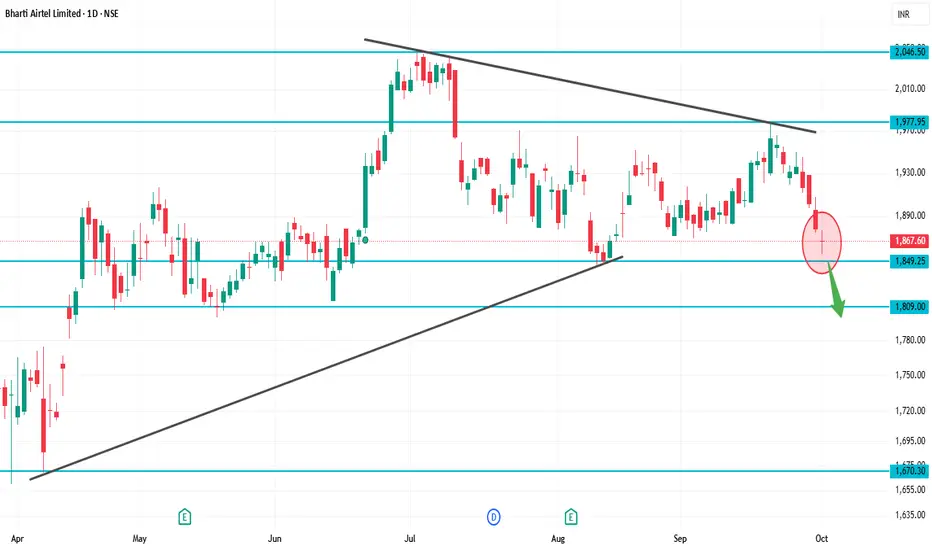
BHARTIARTL 1D Time frameCurrent Price: ~₹1,867
52-Week High: ~₹2,045
52-Week Low: ~₹1,511
Explanation
At ₹1,867, Airtel is just above immediate support (₹1,840–1,850).
If buyers hold this support, stock may bounce back toward ₹1,900+.
But if ₹1,840 breaks, then downside may open toward ₹1,800–1,750.
For bulls, a clean breakout above ₹1,920–2,000 is needed for fresh rally.
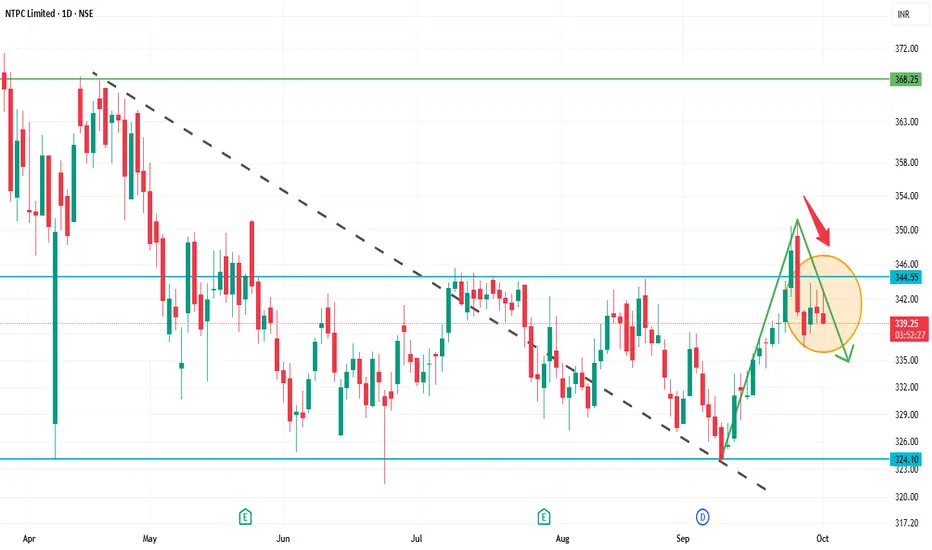
NTPC 1D Time frameOpening Price: ₹340.30
Closing Price: ₹340.25
Day Range: ₹339.45 – ₹343.05
📉 Trend Analysis
Short-Term Trend: Bearish — The stock is trading below key moving averages, confirming the bearish trend.
Medium-Term Trend: Neutral — The stock is in a consolidation phase, characterized by lower highs and lower lows.
Long-Term Trend: Neutral — No significant trend identified; the stock is trading within a range.
🔮 Conclusion
NTPC Ltd. is in a bearish trend with weak momentum.
Break below ₹335.00 could lead to further decline toward ₹330.00.
Break above ₹347.00 would indicate a potential trend reversal.
KOTAKBANK 1D Time frameCurrent Price Snapshot
Current Price: ₹1,991.60
Day’s Range: ₹1,990.50 – ₹2,015.00
52-Week Range: ₹1,679.05 – ₹2,301.90
Technical Indicators
RSI (14-day): 46.61 — indicates a neutral momentum.
MACD: -7.62 — suggests bearish momentum.
Moving Averages: Mixed signals — short-term averages are bearish, while long-term averages are bullish.
Technical Summary: Predominantly Sell signals across various indicators.
Summary
Above ₹2,015: Potential rise toward ₹2,050 – ₹2,100.
Below ₹1,990: Potential fall toward ₹1,950 – ₹1,900.
Between ₹1,950 – ₹2,010: Likely range-bound movement.

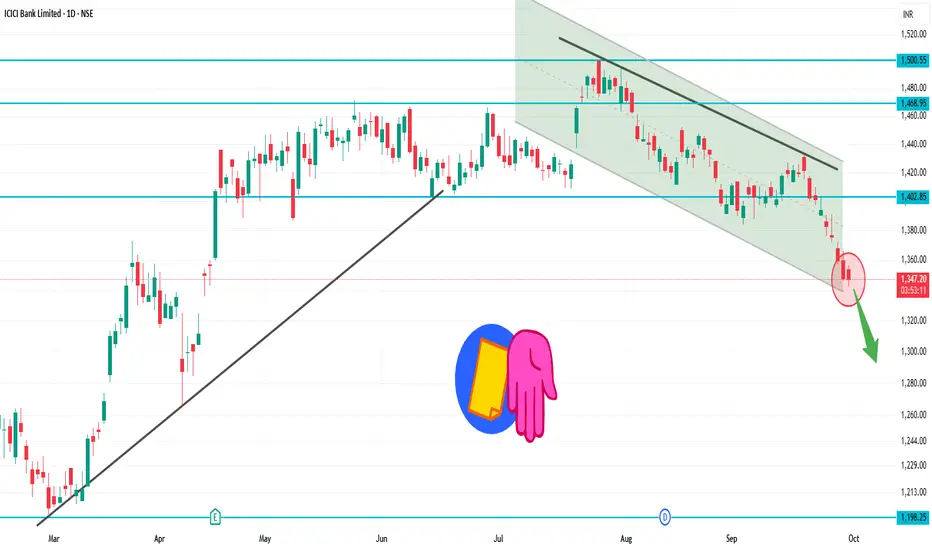
ICICIBANK 1D Time frame₹1,345.80 (NSE)
Day’s Range: ₹1,342.60 – ₹1,356.60
52-Week Range: ₹1,186.00 – ₹1,500.00
📉 Technical Overview
Trend: The stock is trading below its 200-day moving average, indicating a mildly bearish trend.
RSI: Currently at 26.6, suggesting the stock is in the oversold zone.
MACD: At -10.01, reinforcing the bearish momentum.
Moving Averages: A strong sell signal is indicated, with 0 buy signals and 12 sell signals across various timeframes.
🔼 Potential Upside (Rise)
Immediate Resistance: ₹1,355 – ₹1,365
Breakout Target: Above ₹1,365, the next resistance is around ₹1,380 – ₹1,390.
Bullish Confirmation: A close above ₹1,390 could signal a reversal or consolidation.
🔽 Potential Downside (Fall)
Immediate Support: ₹1,340 – ₹1,330
Breakdown Target: Below ₹1,330, the stock may test ₹1,310 – ₹1,300.
Bearish Confirmation: A close below ₹1,300 would strengthen the bearish outlook.
✅ Summary
Above ₹1,365: Potential rise toward ₹1,380 – ₹1,390.
Below ₹1,330: Potential fall toward ₹1,310 – ₹1,300.
Between ₹1,330 – ₹1,365: Likely range-bound movement.
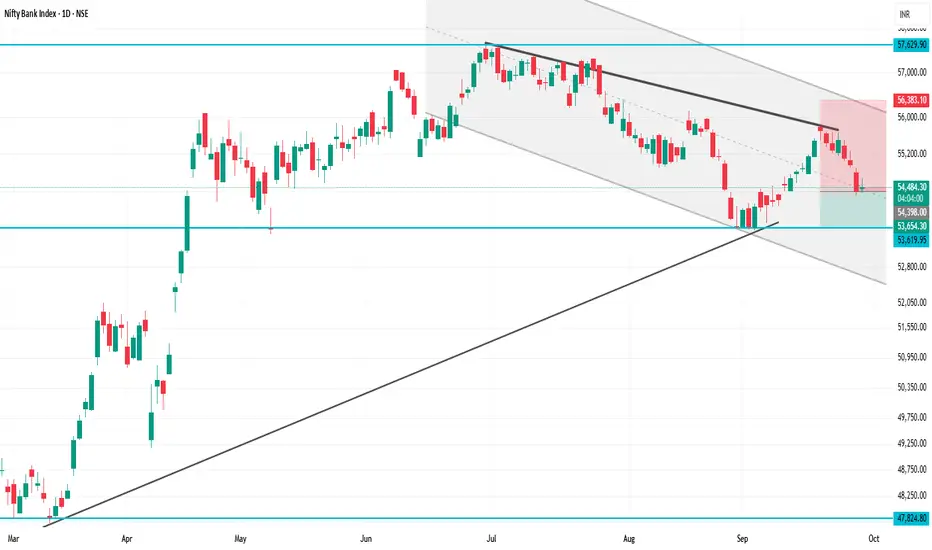
BANKNIFTY 1D Time frameCurrent Level: ₹54,651
Opening Level: ₹54,460
Day’s Range: ₹54,366 – ₹54,686
🔑 Key Support & Resistance
Immediate Support: ₹54,500
Immediate Resistance: ₹54,800
Pivot Point: ₹54,651
📈 Strategy (1D Timeframe)
1. Bullish Scenario
Entry: Above ₹54,800
Stop-Loss: ₹54,500
Target: ₹55,100 → ₹55,300
2. Bearish Scenario
Entry: Below ₹54,500
Stop-Loss: ₹54,800
Target: ₹54,300 → ₹54,100
⚠️ Risk Management
Limit risk to 1% of capital per trade.
Always use stop-loss to protect against unexpected market moves.
Watch sector news and broader market trends that can impact BANKNIFTY.
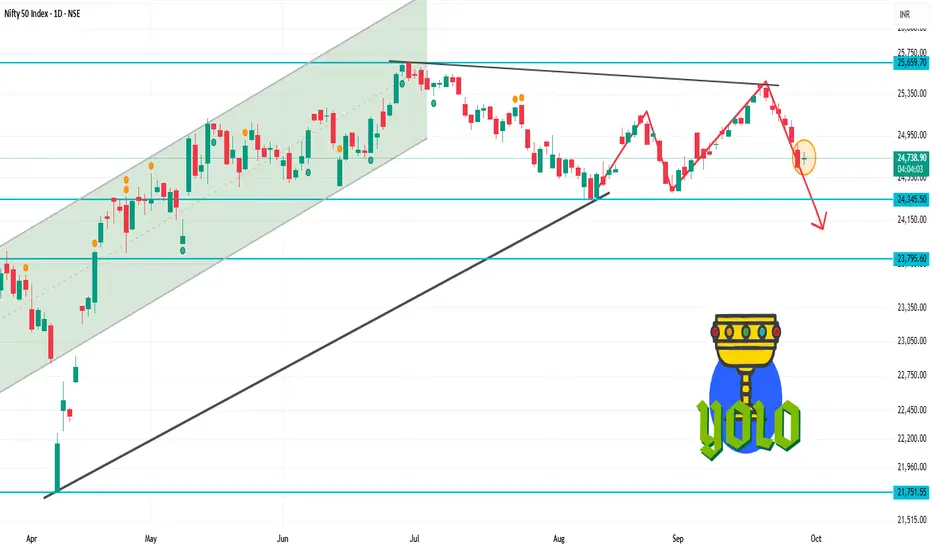
NIFTY 1D Time frameOpening Level: ₹24,691.10
Current Level: ₹24,765
Day's Range: ₹24,500 – ₹24,900 (approximate)
🔑 Key Support & Resistance Levels
Immediate Support: ₹24,500
Immediate Resistance: ₹24,900
Pivot Point: ₹24,765
📊 Market Sentiment
Trend: The NIFTY 50 has experienced a six-day losing streak, indicating bearish momentum.
NDTV Profit
Volume: Trading volume is higher than average, suggesting increased investor activity.
📈 Strategy (1D Timeframe)
1. Bullish Scenario
Entry: Above ₹24,900
Stop-Loss: ₹24,500
Target: ₹25,100 → ₹25,300
2. Bearish Scenario
Entry: Below ₹24,500
Stop-Loss: ₹24,900
Target: ₹24,300 → ₹24,100
⚠️ Risk Management
Limit risk to 1% of capital per trade.
Always use stop-loss to protect against unexpected market movements.
Monitor broader market trends and sector-specific news that may impact index performance.
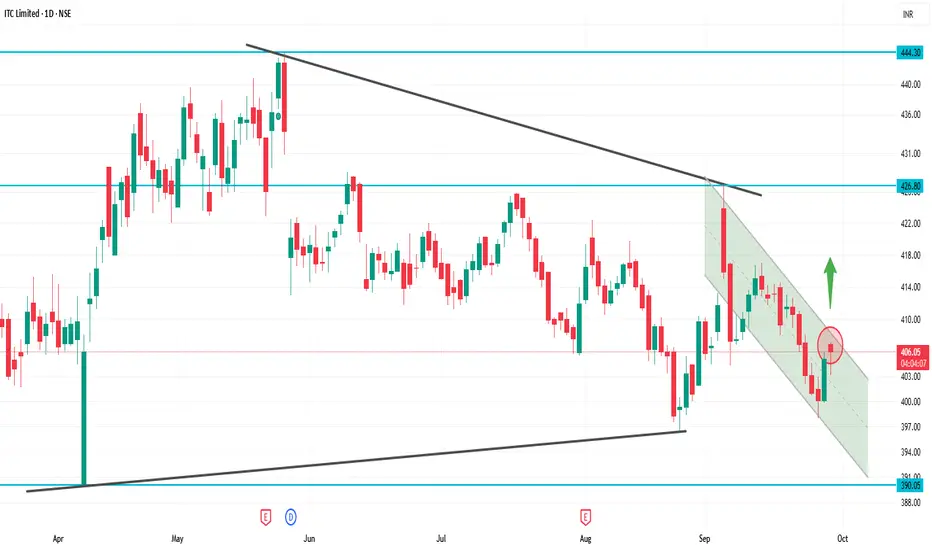
ITCITC Daily Snapshot
Current Price: ~₹405
Day’s Range: ~₹401 – ₹406
🔍 Key Levels
Support: Around ₹399 – ₹401 (near-term buying zone)
Resistance: Around ₹409 – ₹412 (supply zone)
📈 Technical Picture
Trend: Slightly bearish to sideways, but stabilizing above ₹405 gives some strength
RSI (Daily): Neutral zone, neither overbought nor oversold
Moving Averages: Price is close to short-term averages, so a decisive breakout above ₹409 is needed for bullish confirmation
VWAP: Trading near VWAP, showing balance between buyers and sellers
✅ Summary
At ₹405, ITC is near the middle of its range.
If it holds above ₹405 and breaks ₹409–₹412, bullish momentum can pick up.
If it falls below ₹401, it may retest support near ₹398.
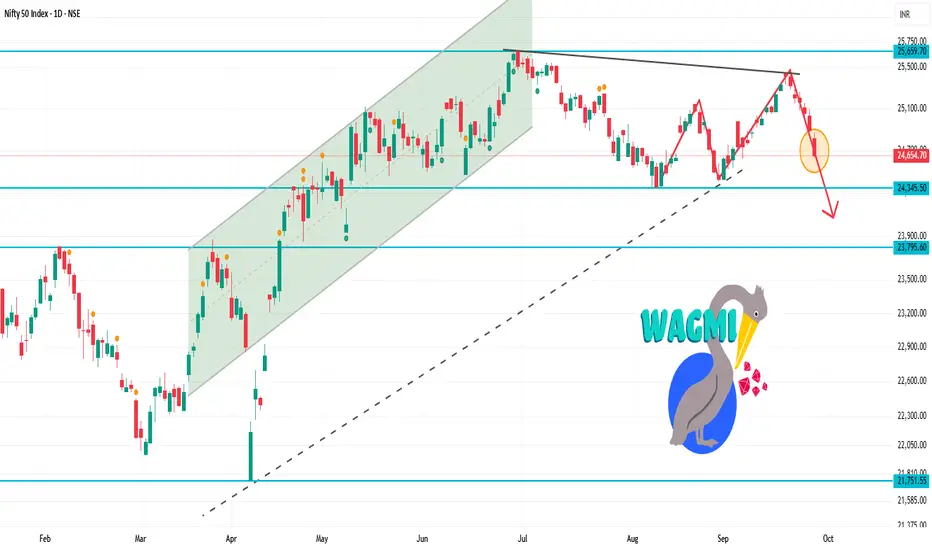
NIFTY 1D Time framePrevious Close: 24,889
Today Open: 24,819
Day’s High: 24,869
Day’s Low: 24,629
Current / Last Price: around 24,655
⚡ Strategy
Bullish Plan:
Buy near 24,550 – 24,600 with SL below 24,300.
Targets: 24,700 → 24,800 → 24,900.
Bearish Plan:
If price breaks below 24,300, expect weakness toward 24,100 – 24,000.
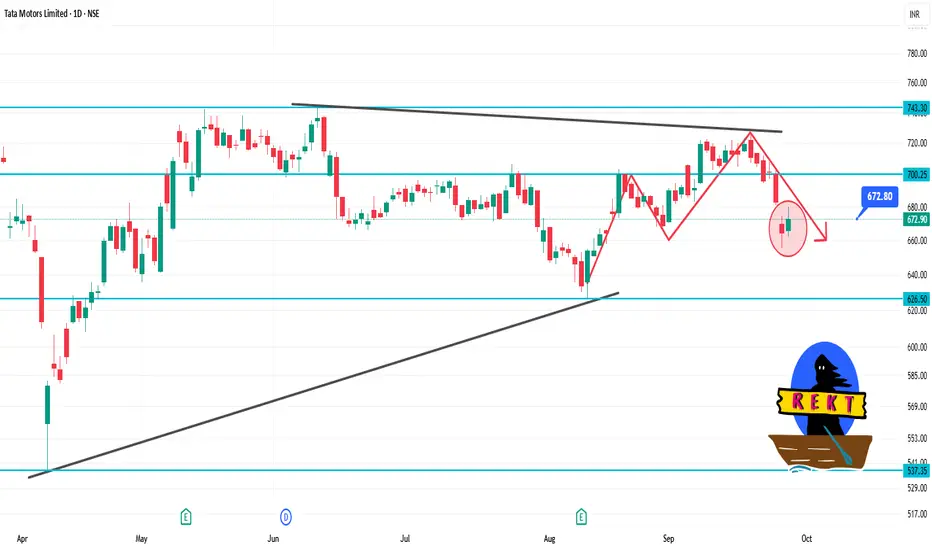
TATAMOTORS 1D Time frameCurrent Price: ₹673.00
Day's Range: ₹662.35 – ₹680.35
Previous Close: ₹664.30
Volume: 15,780,434 shares traded
Market Cap: ₹247,780 crore
52-Week High: ₹1,000.40
52-Week Low: ₹535.75
Face Value: ₹2.00
Beta: 1.30
🧾 Financial Highlights
P/E Ratio (TTM): 11.69
P/B Ratio: 0.00
EPS (TTM): ₹57.54
Dividend Yield: 0.89%
ROE: 28.1%
Book Value: ₹315
📈 Technical Insights
Trend: The stock has shown resilience with strong long-term performance over three years, despite recent challenges compared to the Sensex.
Support Levels: ₹662.35, ₹650.00
Resistance Levels: ₹680.35, ₹700.00
📌 Key Takeaways
Recent Performance: Tata Motors' shares rose over 2% today, snapping a two-day decline, following the announcement that Jaguar Land Rover (JLR) had commenced a phased restart of its operations after a cyberattack.
Analyst Sentiment: Despite recent volatility, Tata Motors remains a top pick among analysts for long-term investment.
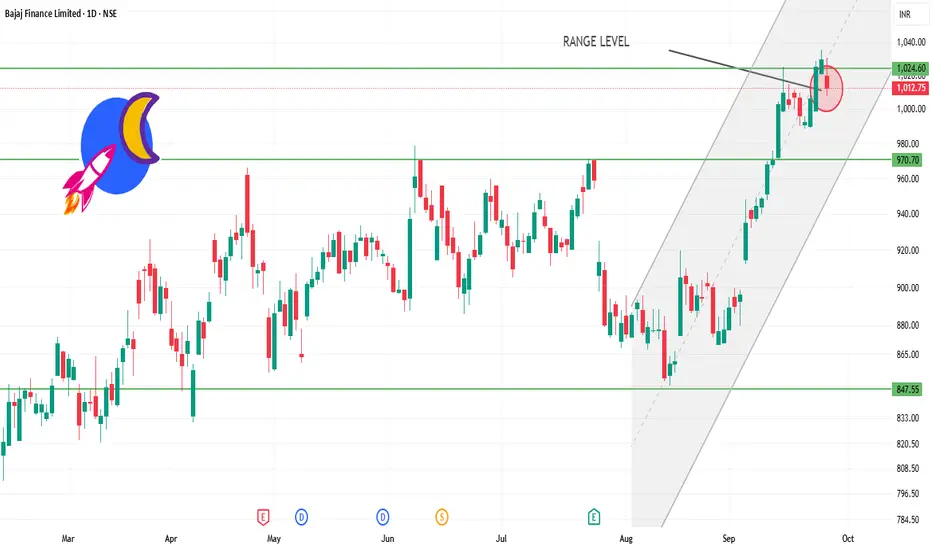
BAJFINANCE 1D time frame📊 Daily Snapshot
Closing Price: ₹1,012.75
Day’s Range: ₹1,008.00 – ₹1,031.10
Previous Close: ₹1,029.75
Change: Down –1.66%
52‑Week Range: ₹645.10 – ₹1,036.00
Market Cap: ₹6.31 lakh crore
P/E Ratio: 36.2
Dividend Yield: 2.76%
EPS (TTM): ₹28.04
Beta: 1.14 (indicating moderate volatility)
🔑 Key Technical Levels
Support Zone: ₹1,008.00 – ₹1,015.00
Resistance Zone: ₹1,031.00 – ₹1,036.00
All-Time High: ₹1,036.00
📈 Technical Indicators
RSI (14-day): 42.88 – approaching oversold territory, suggesting potential for a rebound.
MACD: Positive at 2.46, indicating bullish momentum.
Moving Averages: Trading above the 50-day and 200-day moving averages, indicating an overall uptrend.
📉 Market Sentiment
Recent Performance: Bajaj Finance experienced a decline of 1.66% on September 25, 2025, underperforming the broader market.
Volume: Trading volume was significantly higher than its 50-day average, indicating increased investor activity.
📈 Strategy (1D Timeframe)
1. Bullish Scenario
Entry: Above ₹1,031.00
Stop-Loss: ₹1,008.00
Target: ₹1,045.00 → ₹1,050.00
2. Bearish Scenario
Entry: Below ₹1,008.00
Stop-Loss: ₹1,015.00
Target: ₹995.00 → ₹990.00
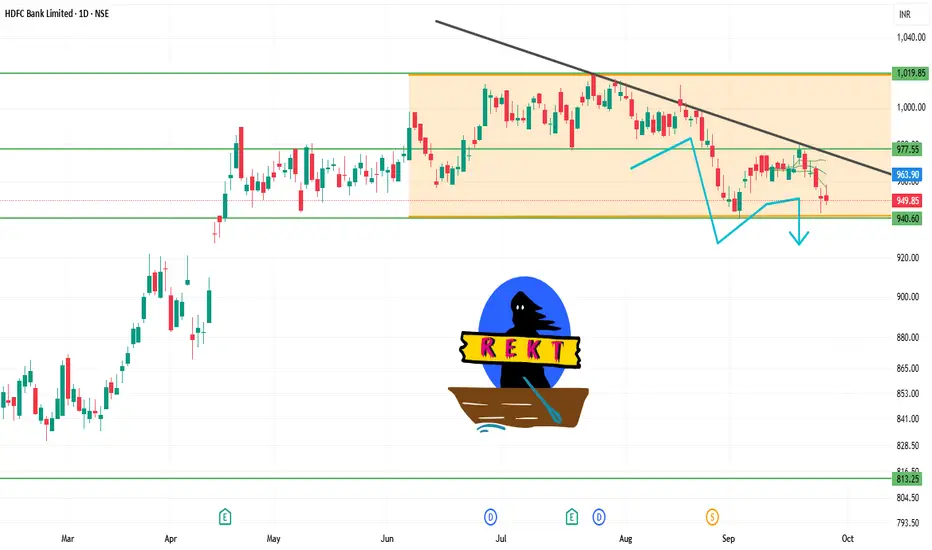
HDFCBANK 1D Time frame📊 Daily Snapshot
Closing Price: ₹949.20
Day’s Range: ₹947.40 – ₹958.00
Previous Close: ₹957.20
Change: Down –0.52%
52-Week Range: ₹806.50 – ₹1,018.85
Market Cap: ₹14.6 lakh crore
P/E Ratio: 20.66
Dividend Yield: 2.32%
EPS (TTM): ₹45.97
Beta: 0.92 (indicating lower volatility)
🔑 Key Technical Levels
Support Zone: ₹947.40 – ₹950.00
Resistance Zone: ₹957.20 – ₹960.00
All-Time High: ₹1,018.85
📈 Strategy (1D Timeframe)
1. Bullish Scenario
Entry: Above ₹957.20
Stop-Loss: ₹947.40
Target: ₹965.00 → ₹970.00
2. Bearish Scenario
Entry: Below ₹947.40
Stop-Loss: ₹957.20
Target: ₹940.00 → ₹935.00
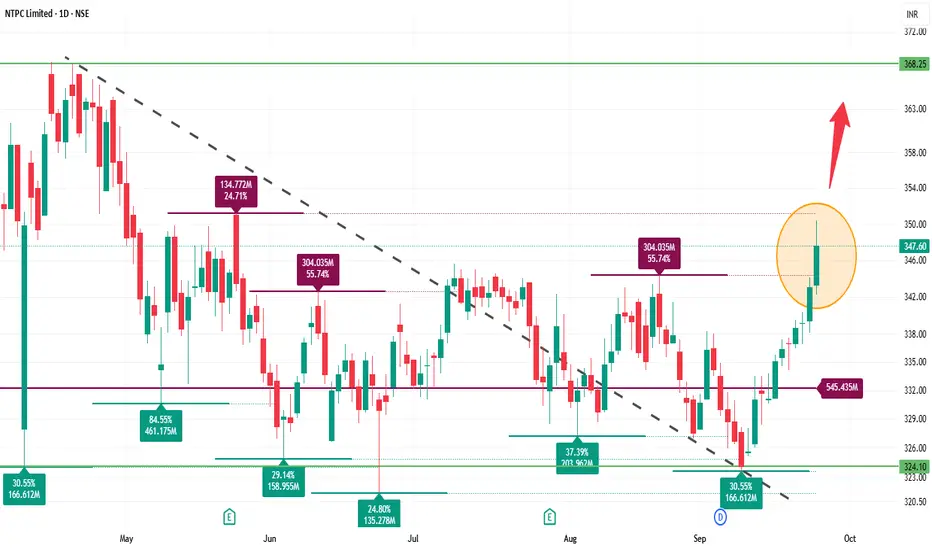
NTPC 1D Time frame📊 Today's Performance
Closing Price: ₹347.55
Day’s Range: ₹342.25 – ₹350.40
Previous Close: ₹343.00
Change: Up +1.33%
52‑Week Range: ₹292.80 – ₹448.45
Market Cap: ₹3.37 lakh crore
P/E Ratio: 14.07
Dividend Yield: 2.40%
EPS (TTM): ₹24.71
Beta: 1.06 (moderate volatility)
🔑 Key Technical Levels
Support Zone: ₹335.00 – ₹336.00
Resistance Zone: ₹350.00 – ₹355.00
All-Time High: ₹448.45
📈 Strategy (1D Timeframe)
1. Bullish Scenario
Entry: Above ₹350.00
Stop-Loss: ₹342.00
Target: ₹355.00 → ₹360.00
2. Bearish Scenario
Entry: Below ₹335.00
Stop-Loss: ₹342.00
Target: ₹325.00 → ₹320.00
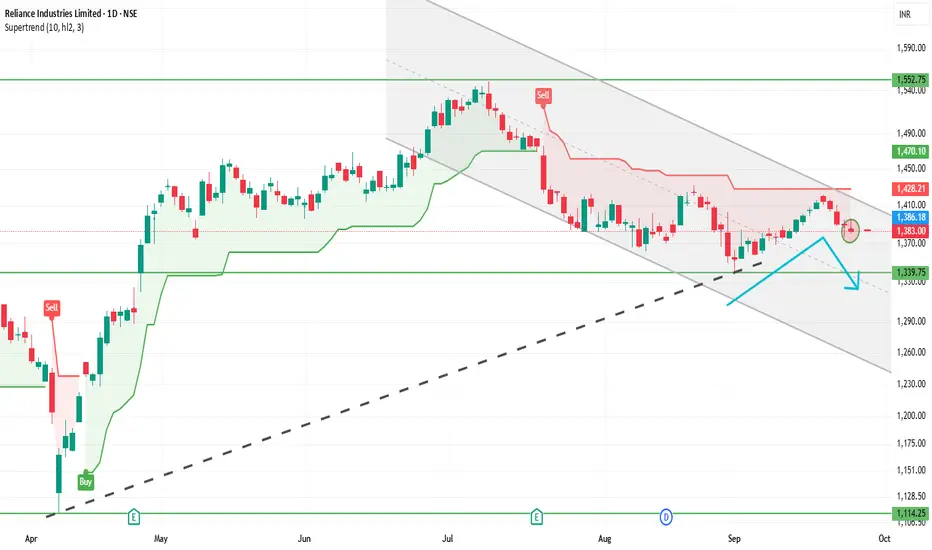
RELIANCE 1D Time frame📊 Reliance Daily (1D) Snapshot
Close: Around ₹1,382
Range of the Day: High near ₹1,396, Low near ₹1,380
Trend: Slight weakness on daily chart (mild red candle)
Stock is consolidating between support and resistance zones.
🎯 Key Daily Levels
Support Zone: ₹1,350 – ₹1,365
Strong Support: ₹1,330
Resistance Zone: ₹1,405 – ₹1,425
Strong Resistance: ₹1,430
📝 Strategy on 1D Chart
Bearish View
If price goes near ₹1,405 – ₹1,425 and fails to sustain, you can short.
Entry: ₹1,410 approx
Stop-loss: ₹1,430
Target: ₹1,365 → ₹1,350
Bullish View
If Reliance holds above ₹1,350 and shows reversal, you can buy.
Entry: ₹1,360 – ₹1,365 zone
Stop-loss: ₹1,330
Target: ₹1,405 → ₹1,425
Breakout Trade
If it closes above ₹1,430 with strong candle, expect momentum upside.
Target: ₹1,460+
Breakdown Trade
If it closes below ₹1,330, selling pressure can push it to ₹1,300 or lower.
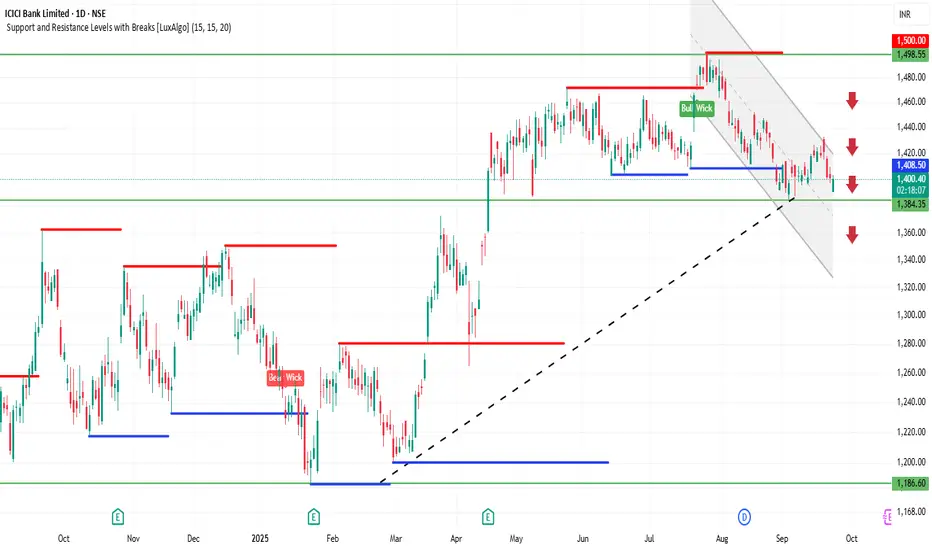
ICICIBANK 1D Time frame📍 Today’s Expected Range (Intraday Approximation)
Expected High: ₹1,403–₹1,410
Expected Low: ₹1,391–₹1,385
These are approximate intraday levels. Actual prices may fluctuate slightly due to market volatility.
🔍 Key Points
Current price: ₹1,400–₹1,401, close to resistance.
If price breaks above ₹1,410 with strong volume → bullish momentum likely.
If price drops below ₹1,385 → short-term correction or pullback possible.
📊 Suggested Trading Strategy
Bullish Scenario
If ICICI Bank breaks ₹1,403–₹1,410, you can buy, targeting ₹1,420–₹1,430.
Stop-loss: ₹1,395
Bearish Scenario
If ICICI Bank drops below ₹1,385, you can sell/short, targeting ₹1,375–₹1,370.
Stop-loss: ₹1,390
Range-Bound / Sideways
If price trades between ₹1,385–₹1,403, it’s better to wait and avoid trading until a clear breakout occurs.
💡 Summary
Resistance Zone: ₹1,403–₹1,410
Support Zone: ₹1,385–₹1,391
Strategy: Trade in the direction of the breakout, and always use stop-loss to manage risk.
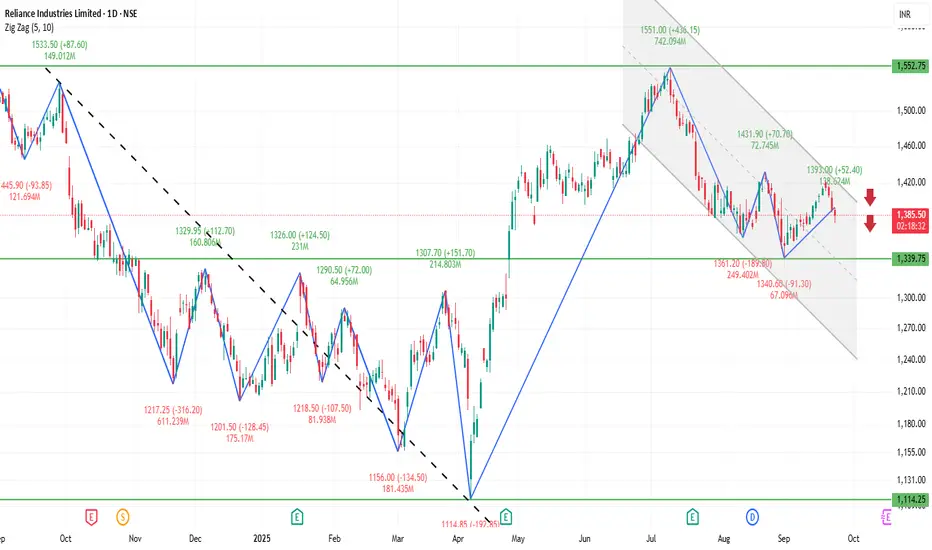
RELIANCE 1D Time frame📍 Current Price Context
Trading around ₹1,386
Price is near a resistance zone → important level to watch.
🔍 Key Levels
Immediate resistance: ₹1,380–₹1,390 (current zone)
Next resistance: ₹1,420–₹1,450 (if breakout happens)
Immediate support: ₹1,350–₹1,360
Stronger support: ₹1,320–₹1,330
📊 Indicators & Trend
Price is just below resistance, so breakout or rejection will decide the move.
RSI near neutral → neither overbought nor oversold.
Structure looks range-bound, but slightly bullish as long as it holds above ₹1,350.
🔮 Possible Scenarios
Bullish breakout → If Reliance sustains above ₹1,390–₹1,400 with volume, next upside target is ₹1,420–₹1,450.
Sideways move → May trade between ₹1,350–₹1,390 until momentum builds.
Bearish pullback → If it fails at resistance, price could slip toward ₹1,350, and if broken, then ₹1,320.
👉 At the current level (₹1,386), Reliance is at a decisive zone. Breakout above ₹1,390 will be bullish, while rejection could send it back to supports.
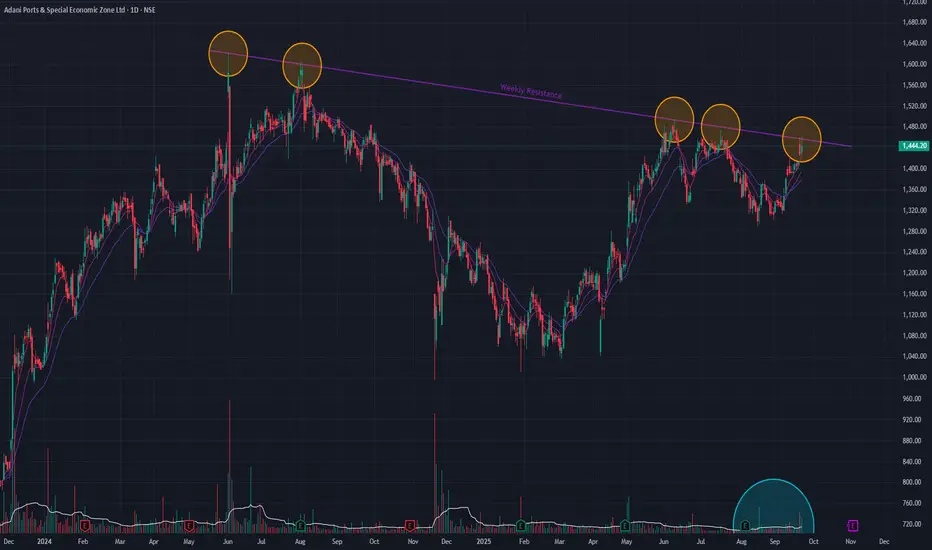
Adani Ports (Daily) - Coils for Potential BO at Critical ResAdani Ports is currently testing a significant long-term angular resistance trendline , a barrier that has persisted since the stock's All-Time High in June 2024. The stock has been in a sideways consolidation phase since March 2025, following a prolonged downtrend, and is now showing signs of building pressure against this key resistance.
Recent price action suggests a growing determination to break through, with breakout attempts becoming more frequent . Today's session saw a notable increase in trading volume, adding weight to this observation.
Broad-Based Bullish Signals 👍
The bullish case is strengthened by a confluence of indicators across multiple timeframes:
- Strong Momentum: On both the daily and weekly charts , short-term Exponential Moving Averages (EMAs) are in a bullish crossover state.
- Dual Confirmation: This is further corroborated by the Relative Strength Index (RSI) on both timeframes, which is also exhibiting a bullish crossover, confirming broad-based positive momentum.
Outlook: Awaiting Confirmation
The stock is at a critical inflection point. While multiple indicators are signaling a strong potential for an upward move, the long-term resistance remains a formidable obstacle. The price action in the coming days will be decisive. A confirmed breakout would signal the next major leg up, but until then, a cautious approach is warranted while waiting for the market to show its hand.
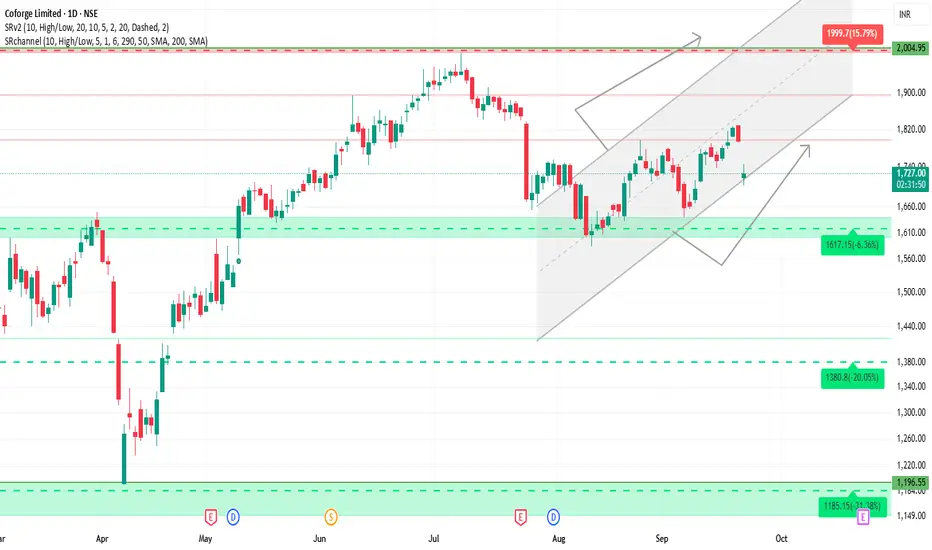
COFORGE 1D Time frame🔍 Current Price
Trading around ₹1,720 – ₹1,740
📊 Technical Indicators
Trend: Bearish — price trading below short and medium-term moving averages.
RSI (14): Around 26–27, showing oversold zone.
MACD: Negative, indicating bearish momentum.
ADX: Strong, meaning the downtrend has solid strength.
⚙️ Key Levels
Immediate Resistance 1: ₹1,780
Resistance 2: ₹1,820 – ₹1,840
Immediate Support 1: ₹1,700
Support 2: ₹1,650
Deeper Support: ₹1,620
🧮 Base Strategy
Long Setup:
Entry: Near ₹1,700 if reversal signals appear
Stop Loss: Below ₹1,650
Targets: ₹1,780 first, then ₹1,820+
Short Setup (Reversal):
If price fails near ₹1,780 zone
Targets: ₹1,700, then ₹1,650
Breakout Setup:
If price sustains above ₹1,820 – ₹1,840 with volume
Upside can extend toward higher levels