ADA/USDT – Triple Top Breakdown Play🔎 Setup Insight:
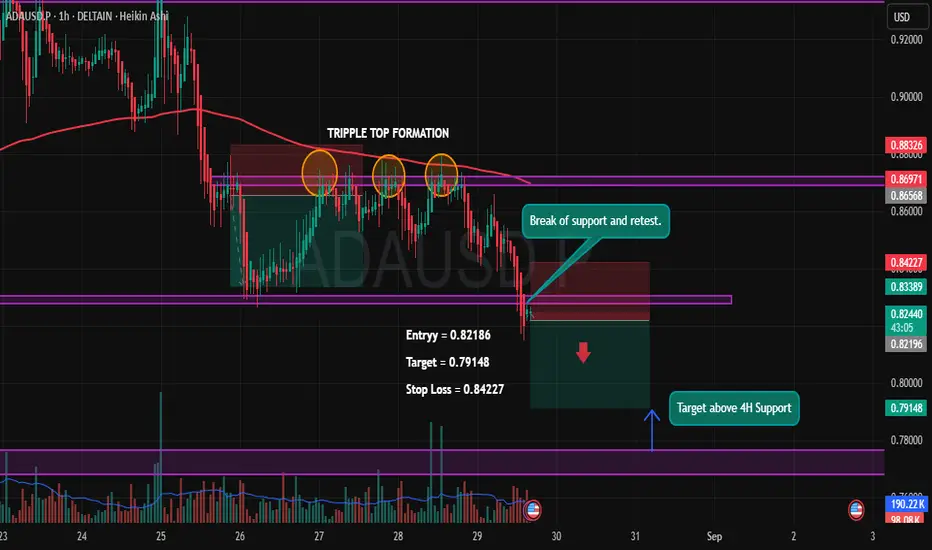
ADA has formed a Triple Top pattern near the 0.869 zone, confirming strong rejection from resistance. After multiple failed attempts to break higher, price finally broke down key support and is now retesting it, giving a clean short opportunity.
✨ Trade Plan:
Entry: 0.82186
Target: 0.79148 (Above 4H support zone)
Stop Loss: 0.84227
✅ Reasons for Short Bias:
Triple Top Formation ➝ Strong bearish reversal signal.
Break & Retest of Support ➝ Previous demand now acting as supply.
Confluence with 200 EMA rejection ➝ Trend remains bearish.
Volume Confirmation ➝ Selling volume stronger than buying.
🎯 Targeting the next major support on the 4H timeframe, with a favorable Risk-Reward setup.
⚠️ Disclaimer: This analysis is for educational purposes only and not financial advice. Always manage your risk before entering any trade.
Adausd
Bearish ADA/USD Trade Idea: Downtrend Continues1. Market Analysis:
The ADA/USD pair is currently in a strong downtrend. A downward-sloping resistance line is clearly visible, highlighting the continuing pressure on price. The pattern forming is a descending triangle, which is typically a bearish signal when the price breaks below the lower support level.
2. Entry Point:
Our entry point is at 0.8292. This is based on the price action within the triangle pattern, as the market is struggling to break the resistance and is testing the lower boundary multiple times. A breakdown below this level is anticipated, continuing the bearish momentum.
3. Stop Loss:
The stop loss is set at 0.88768. This level represents a recent swing high within the triangle pattern. If price moves back above this level, the trend reversal could be signaled, so it’s crucial to manage risk with this stop.
4. Target:
The target price is set at 0.74165. This is a key support area, previously tested, and the price action indicates that it could act as the next major level of demand. This aligns with our trade objective of riding the trend toward the next significant support.
5. Rationale:
The descending triangle is a bearish continuation pattern, and the breakout below the lower support confirms the downtrend.
Volume has been decreasing as the price approaches the triangle's apex, a common sign that the market is getting ready for a breakout.
The overall trend is bearish, and this setup aligns with the prevailing market sentiment.
6. Conclusion:
This trade idea is based on a well-formed technical pattern, with clear entry, stop loss, and target levels. By entering at 0.8292, setting a stop loss at 0.88768, and targeting 0.74165, we are positioning ourselves to profit from the continuation of the current downtrend in ADA/USD.
Make sure to monitor price action closely, as any deviation from the expected pattern might require adjustments to the trade.

ADA/ Cardano Swing Long Setup - I think ADA can show us another huge impulsive move post this consolidation
- Let this consolidation mature more and you can easily see this moving 50% more
- I think it's very important for the base to mature

ADA - next bullrun?🚀 Exciting Cardano BITFINEX:ADAUSD Update! 🌐📈
Hey Crypto Fam! 🌟
I've got some intriguing insights on Cardano's current chart dynamics. 📊✨ The price is about to complete an bullish contracting triangle. According to my primary analysis, I believe we might be in for a deeper C-wave, especially if the intraday low is breached and the price dips below $0.355. 📉
Why am I leaning towards the primary scenario? The same distance B extended above the starting point of the correction suggests that if C surpasses A, we could be looking at a 50% Fibonacci extension.
Alternatively, if (e) is already in play, breaking the $0.41 level could be a game-changer. 🎯
Happy trading! 🚀

ADAUSDT Trade IdeaADAUSDT Short Trade
Entry : $0.3875-$0.3820
ADAUSDT Heavy Resistance AT $0.3912. And 2nd Local Resistance At $0.3877.,
So You Can Short ADA And Make 30%-60% Profit With 10X.
Thanks, Follow For More Valuable Content.

Top 4 coins which have outperformed BTCBitcoin has increased by almost 48.97% in the year 2023. Let us have a look at the top 5 coins (based on market cap) which have outperformed BTC (we have not considered meme coins for our analysis).
1.Cardano (ADA)
YTD(%): 61.63
Price is currently moving within a range (0.385-0.421).
25% upside movement can be expected if price breaks above the range with 0.527 level acting as resistance.
Bearish RSI divergence has formed, thus, keep an eye on price movement.
2. Polygon (MATIC)
YTD(%): 86.26
Price moving within parallel channel.
21% upside movement is expected with resistance at 1.72.
If price breaks the channel, support can be found at 1.153.
3. Solana (SOL)
YTD(%): 150.57
Price is currently moving within a range (19.7-26.75). 56% upside movement can be expected if price breaks above the range with 38.95 level acting as resistance.
If price breaks below the range 14.9 level will act as support.
4. Polkadot (DOT)
YTD(%): 68.71
Price is currently trading near support (7.13 level). 10% upside movement can be expected with resistance at 8.06.
Bearish RSI divergence has formed. If price breaks 7.133 support with high volume, we can expect it to find support at 6.02.
Note: Studies are for educational purposes only.
We will not be responsible for any kind of your Profits & Losses.

adausdt cardano cardano broke the resistance in 4hr timeframe we can get a move here in upwards direction


💡Don't miss the great buy opportunity in ADAUSD @CardanoTrading suggestion:
". There is a possibility of temporary retracement to the suggested support line (0.469).
. if so, traders can set orders based on Price Action and expect to reach short-term targets."
Technical analysis:
. ADAUSDT is in a range bound, and the beginning of an uptrend is expected.
. The price is above the 21-Day WEMA, which acts as a dynamic support.
. The RSI is at 56.
Take Profits:
TP1= @ 0.487
TP2= @ 0.504
TP3= @ 0.522
TP4= @ 0.545
TP5= @ 0.583
SL= Break below S2
❤️ If you find this helpful and want more FREE forecasts in TradingView
. . . . . Please show your support back,
. . . . . . . . Hit the 👍 LIKE button,
. . . . . . . . . . Drop some feedback below in the comment!
❤️ Your support is very much 🙏 appreciated!❤️
💎 Want us to help you become a better Forex / Crypto trader?
Now, It's your turn!
Be sure to leave a comment; let us know how you see this opportunity and forecast.
Trade well, ❤️
ForecastCity English Support Team ❤️

ADAUSDT Breakout & Retest Opportunityafter breakout it"s at retest situation if the retest sustains and gave strong closing with bullish engulfing candle then go long otherwise leave it.
follow me if u like this analysis
and press boost button thanks.

Trading Signal For ADAUSDT CardanoTrading Setup:
There is a Trading Signal to Buy in ADAUSDT Cardano
Traders can open their Buy Trades NOW
Rank : ⭐️
⬆️Buy now or Buy on 0.427
⭕️SL @ 0.418
🔵TP1 @ 0.441
🔵TP2 @ 0.460
🔵TP3 @ 0.487
What are these signals based on?
Classical Technical Analysis
Price Action Candlesticks Fibonacci
RSI, Moving Average , Ichimoku , Bollinger Bands
If you liked our ideas, please support us with your likes 👍 and comments .

#ada what's coming first - .3 or .9 $ada Ada is grinding at the top of parallel channel, breakout from here will take ada to 2x easily , But, if fails ad BTC tends to go towards 16-17k we see ada back to .25/.3
I think we should soon see a movement in ada and buying from here till .25 in tranches is a wise decision than shorting here.
Let me know your thoughts

Trading Signal For CardanoTrading Setup:
There is a Trading Signal to Sell in ADAUSDT Cardano (Futures)
Traders can open their Sell Trades NOW
⬇️ Sell now or sell on 0.637
⭕️SL @ 0.674
🔵TP1 @ 0.515
🔵TP2 @ 0.422
🔵TP3 @ 0.351
What are these signals based on?
Classical Technical Analysis
Price Action Candlesticks Fibonacci
RSI, Moving Average , Ichimoku , Bollinger Bands
If you liked our ideas, please support us with your likes 👍 and comments.

💡Don't miss the great buy opportunity in ADAUSD @CardanoTrading suggestion:
". There is a possibility of temporary retracement to the suggested support line (0.5044).
. if so, traders can set orders based on Price Action and expect to reach short-term targets."
Technical analysis:
. ADAUSDT is in a range bound, and the beginning of an uptrend is expected.
. The price is below the 21-Day WEMA, which acts as a dynamic resistance.
. The RSI is at 72.
Take Profits:
TP1= @ 0.5558
TP2= @ 0.6018
TP3= @ 0.6964
TP4= @ 0.7594
TP5= @ 0.8989
SL= Break below S2
❤️ If you find this helpful and want more FREE forecasts in TradingView
. . . . . Please show your support back,
. . . . . . . . Hit the 👍 LIKE button,
. . . . . . . . . . Drop some feedback below in the comment!
❤️ Your support is very much 🙏 appreciated!❤️
💎 Want us to help you become a better Forex / Crypto trader?
Now, It's your turn!
Be sure to leave a comment; let us know how you see this opportunity and forecast.
Trade well, ❤️
ForecastCity English Support Team ❤️

ADAUSD is on supply zone wait engulfing candleHi guys ADAUSD is on supply zone go for buy on buy candle

💎 ADAUSDT : 346% Profit Potential in Next 6 Months💣💣💣💣last 2-3 weeks we seen huge buying in ADA coin, in upcoming months its going pump very hard.
entry and targets are given on the chart. Please Like and comment if there are any queries.
#bitcoin #altcoinseason #altcoin #altnews

💡Don't miss the great buy opportunity in ADAUSD @CardanoTrading suggestion:
". There is a possibility of temporary retracement to the suggested support line (1.110).
. if so, traders can set orders based on Price Action and expect to reach short-term targets."
Technical analysis:
. ADAUSDT is in a range bound, and the beginning of an uptrend is expected.
. The price is above the 21-Day WEMA, which acts as a dynamic support.
. The RSI is at 51.
Take Profits:
TP1= @ 1.149
TP2= @ 1.191
TP3= @ 1.246
TP4= @ 1.293
TP5= @ 1.384
SL= Break below S2
❤️ If you find this helpful and want more FREE forecasts in TradingView
. . . . . Please show your support back,
. . . . . . . . Hit the 👍 LIKE button,
. . . . . . . . . . Drop some feedback below in the comment!
❤️ Your support is very much 🙏 appreciated!❤️
💎 Want us to help you become a better Forex / Crypto trader?
Now, It's your turn!
Be sure to leave a comment; let us know how you see this opportunity and forecast.
Trade well, ❤️
ForecastCity English Support Team ❤️

Trading Signal For CardanoTrading Setup:
There is a Trading Signal to Buy in ADAUSDT Cardano
Traders can open their Buy Trades NOW
Rank : ⭐️⭐️
⬆️Buy now or Buy on 0.759
⭕️SL @ 0.70
🔵TP1 @ 0.92
🔵TP2 @ 1.08
🔵TP3 @ 1.36
What are these signals based on?
Classical Technical Analysis
Price Action Candlesticks Fibonacci
RSI, Moving Average , Ichimoku , Bollinger Bands
If you liked our ideas, please support us with your likes 👍 and comments .

ADAUSD ANALYSIS 1hrFormed a TRIANGLE PATTERN in 1hr timeframe.
ALT coins move based on the movement of BTCUSD , so trade carefully.

💡Don't miss the great buy opportunity in ADAUSD @CardanoTrading suggestion:
". There is a possibility of temporary retracement to the suggested support line (1.094).
. if so, traders can set orders based on Price Action and expect to reach short-term targets."
Technical analysis:
. ADAUSD is in a range bound, and the beginning of an uptrend is expected.
. The price is below the 21-Day WEMA, which acts as a dynamic resistance.
. The RSI is at 57.
Take Profits:
TP1= @ 1.187
TP2= @ 1.314
TP3= @ 1.426
TP4= @ 1.516
TP5= @ 1.635
SL= Break below S2
❤️ If you find this helpful and want more FREE forecasts in TradingView
. . . . . Please show your support back,
. . . . . . . . Hit the 👍 LIKE button,
. . . . . . . . . . Drop some feedback below in the comment!
❤️ Your support is very much 🙏 appreciated!❤️
💎 Want us to help you become a better Forex / Crypto trader?
Now, It's your turn!
Be sure to leave a comment; let us know how you see this opportunity and forecast.
Trade well, ❤️
ForecastCity English Support Team ❤️

ADAUSDCardano / ADAUSD / ADAUSDT
Can we see BULL Move to 4$+. As per my analysis, it is trading at wave 4 of 3.
Let us wait and watch, how this market progresses.


💡Don't miss the great buy opportunity in ADAUSD @CardanoTrading suggestion:
". There is a possibility of temporary retracement to the suggested support line (1.308).
. if so, traders can set orders based on Price Action and expect to reach short-term targets."
Technical analysis:
. ADAUSD is in an uptrend, and the continuation of the uptrend is expected.
. The price is above the 21-Day WEMA, which acts as a dynamic support.
. The RSI is at 71.
Take Profits:
TP1= @ 1.405
TP2= @ 1.489
TP3= @ 1.587
TP4= @ 1.747
TP5= @ 1.904
SL= Break below S2
❤️ If you find this helpful and want more FREE forecasts in TradingView
. . . . . Please show your support back,
. . . . . . . . Hit the 👍 LIKE button,
. . . . . . . . . . Drop some feedback below in the comment!
❤️ Your support is very much 🙏 appreciated!❤️
💎 Want us to help you become a better Forex / Crypto trader?
Now, It's your turn!
Be sure to leave a comment; let us know how you see this opportunity and forecast.
Trade well, ❤️
ForecastCity English Support Team ❤️
