Aeroflex | Symmetrical triangle breakout ### 📊 **Aeroflex Industries Ltd - Technical Analysis Summary (Daily Chart)**
#### 🚀 **Breakout Overview**
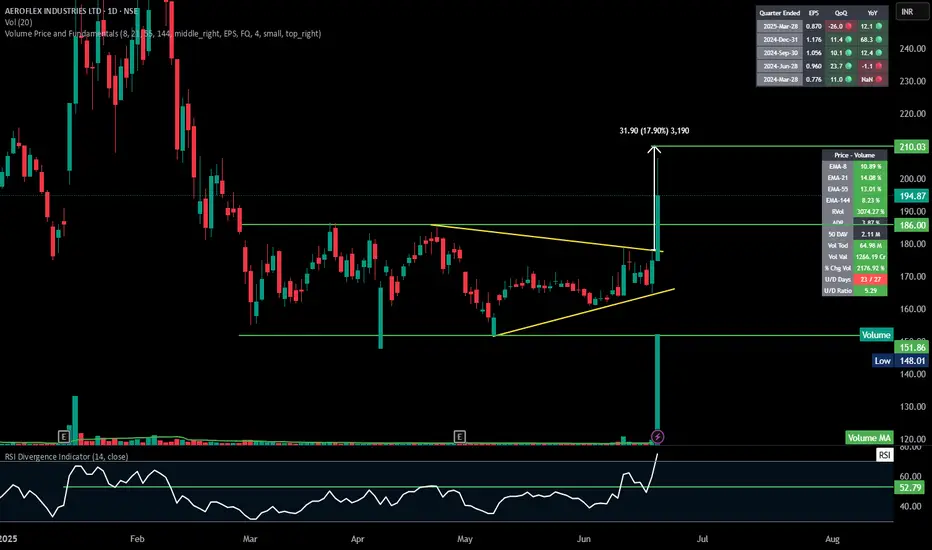
* **Pattern**: Symmetrical triangle breakout (tight range → explosive move)
* **Breakout Confirmation**: Massive bullish candle (+11.45%) with **volume spike (64.98M)** — over **1200% above average**
* **Breakout Level**: \~₹174–₹176
#### 🎯 **Target Projection**
* **Height of Triangle (Approx)**: ₹31.90
* **Target Price**: ₹176 (breakout level) + ₹31.90 ≈ **₹210**
#### 📌 **Key Price Levels**
* **Current Price**: ₹194.87
* **Immediate Resistance / Target**: ₹210
* **Support**: ₹186 (previous swing high and breakout retest level)
* **Stop Loss Zone**: Below ₹174
#### 📈 **Volume & Indicators**
* **RSI**: 74.80 — Overbought, but confirms strong momentum
* **EMA Confluence**:
* EMA-8: +10.89%
* EMA-21: +14.08%
* EMA-55: +13.01%
* EMA-144: +8.23%
* **RVol**: 3074.27% — Heavy institutional activity likely
* **U/D Ratio**: 5.29 — Strong buying dominance
#### 🧠 **Inference**
* **Strong bullish breakout** with rising volume and RSI confirmation.
* Good follow-through expected up to **₹210**.
* Watch for minor pullbacks or consolidation near ₹186 for potential entry on retest.
---
AEROFLEX
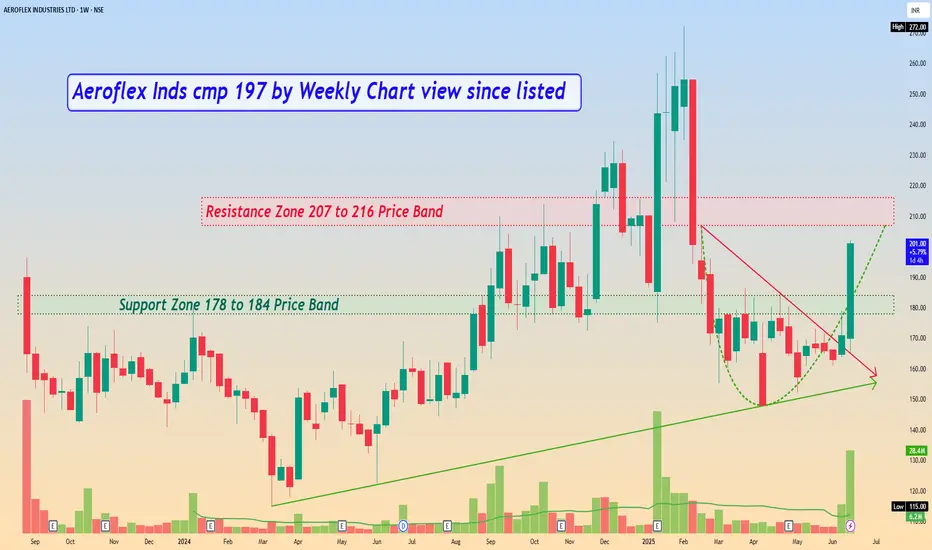
Aeroflex Inds cmp 197 by Weekly Chart view since listed*Aeroflex Inds cmp 197 by Weekly Chart view since listed*
- Support Zone 178 to 184 Price Band
- Resistance Zone 207 to 216 Price Band
- Rising Support Trendline well respected and sustained
- Falling Resistance Trendline Breakout done and maintained
- Heavy Volumes traded over past few days and well above avg traded quantity
- *Bullish Rounding Bottom in the making process with the Resistance Zone neckline*
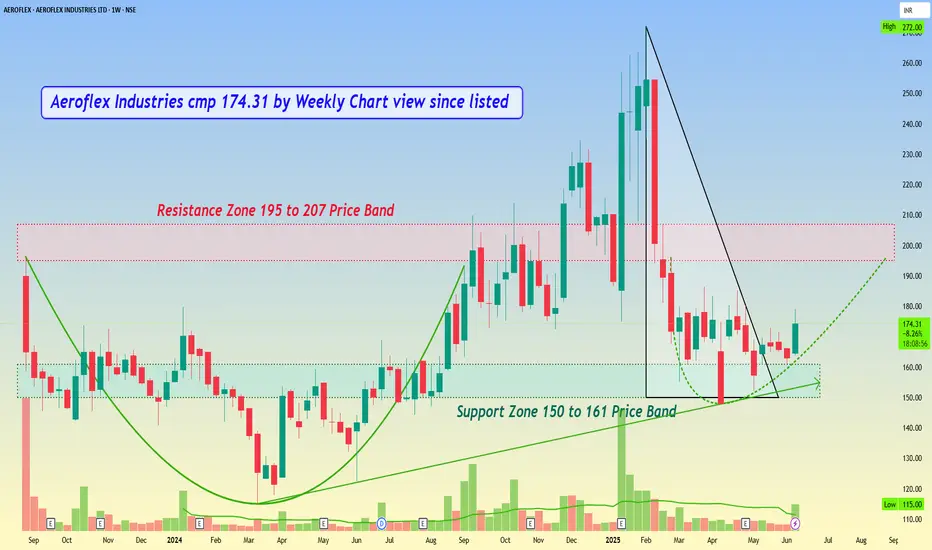
Aeroflex Industries cmp 174.31 by Weekly Chart view since listedAeroflex Industries cmp 174.31 by Weekly Chart view since listed
- Support Zone 150 to 161 Price Band
- Resistance Zone 150 to 161 Price Band
- Descending Triangle pattern Breakout sustained
- Volumes spiked out and traded heavily yesterday
- Old Bullish Rounding Bottom from Aug 23 to Sept 24
- New Bullish Rounding Bottom from Feb 25 to.... in the making process
- Rising Support Trendline respected, hope to see upside momentum gradually carry on
- Will History be repeated and we get to see a New Lifetime High Milestone beyond ATH 272
Aeroflex Industries by KRS Charts4th Oct 2024 / 10:02 AM
Why AEROFLEX ❓
1. Clear Pattern of Reversal to Bullish, Inverted Head & Shoulder❗❗👍
2. Many has Jumped in Breakout due to high calls were given for AEROFLEX but once in Retest ,i think it's right time to enter with more conviction.
3. In smaller TF, 100 EMA is right underneath so multi-TF support ✅↗️
Target would be of ~224 Rs with SL closing below Support as we can see in Chart 📈

AEROFLEX: supply zone breakout2. AEROFLEX
➡️supply zone breakout after consolidation
➡️highest ever sales and PAT
➡️repaid debt
➡️capacity expansion under way would improve financials further
➡️increased cash from operating activities

AEROFLEX : IPO Listing Day High Broken#AEROFLEX #breakout #vcpsetup #vcppattern #IPOstock
AEROFLEX : Swing Trade
>> IPO Listing Day High Broken
>> VCP Formation
>> Good Strength & Volumes
>> Upside Potential min 25-30 %
Swing Traders can lock 10% profit & keep trailing
Note : In the current Market Scenario even the best of Trading setup's can fail so Trade only Good setup's with proper Risk Management, set of rules for Stop-loss & proper position sizing.
Please give a Boost or comment if u r Liking the analysis & Learning from it. Keep showing ur Love by following
Disclaimer : This is not a Trade Recommendations & Charts/ stocks Mentioned are for Learning/Educational Purpose. Do your Own Analysis before Taking positions.

AEROFLEX breakoutAEROFLEX has given resistance breakout with decent volume. Above ATH. Seems the rally may continue

AEROFLEXNote:
1. Views are personal and for educational purposes only. Recheck and take the trade as per your RR.
2. Always remember SL is your lifeline, not the big target...
3. Follow us for more patterns and like, share so that we feel it is helpful to many and share more patterns...
3. Views given here is not a tip rather it is for educational purpose... Aftermarket opens, the condition might change so learn to handle different conditions...
Keep an eye ladies and gentlemen. Cheers and Happy Trading

