AGI - Breakout Alert – Strong Volume, Clear Trend, Smart Zones! ________________________________________________________________________________
📈 AGI GREENPAC LTD – AGI GREENPAC Breakout Alert – Strong Volume, Clear Trend, Smart Zones! Breakout
🕒 Chart Type: Daily Chart
📆 Date: July 22, 2025
________________________________________________________________________________
📌 Price Action:
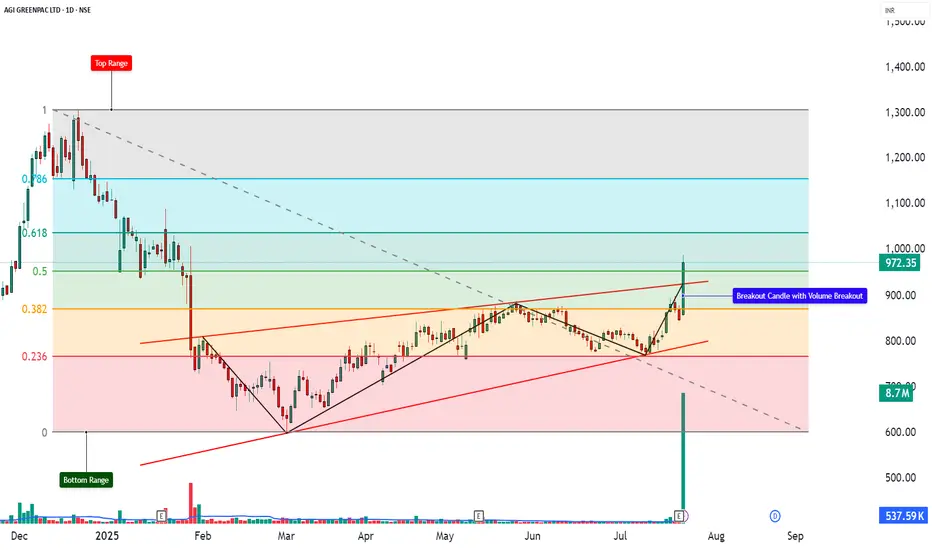
AGI GREENPAC has staged a textbook breakout above its rising channel, with a massive +14.83% rally, closing the day at ₹972.35. The price not only cleared a medium-term resistance level but also broke above critical Fibonacci levels, reclaiming bullish control. This is not just a price breakout — it's a structure + volume + indicator alignment, offering a compelling bullish setup with potential for follow-through.
________________________________________________________________________________
📊 Chart Pattern:
✅ Rising Channel Breakout – A bullish continuation pattern formed over several months
✅ Breakout occurred near the channel’s upper boundary with explosive volume
✅ Price cleared 0.5 (₹950.50) and 0.618 (₹1037.15) Fibonacci retracement levels from the prior fall
✅ The structure was backed by a base formation, indicating accumulation beneath resistance. This pattern signals a potential transition from slow ascent to impulsive trend phase — a powerful sign when backed by volume and momentum indicators.
________________________________________________________________________________
🕯️ Candlestick Pattern:
✅ Wide-Range Bullish Candle
✅ Open = Low formation (strength from the first tick)
✅ Strong follow-through above consolidation
✅ Classic “Buy Today, Sell Tomorrow” price action
✅ Confirms structural breakout from channel top
________________________________________________________________________________
🔊 Volume Analysis:
AGI GREENPAC saw a big jump in trading volume, with over 8.7 million shares traded — that’s more than double the usual average of the past 20 days. This kind of volume shows that a lot more people were actively buying the stock, and it wasn’t just a one-time spike — the buying continued throughout the day. What makes this even more special is that it comes after many days of low activity, which often means big investors were slowly building their positions. When such quiet periods are followed by a big volume and price breakout, it usually signals the start of a strong uptrend. Also, this is the highest volume in the past 52 weeks, which gives even more strength to this breakout and shows serious buying interest.
________________________________________________________________________________
📈 Technical Indicators:
The technical indicators are showing strong signs of bullish momentum in AGI GREENPAC. The RSI is at 73, which means the stock is trending strongly and buyers are in control. The MACD, a popular momentum indicator, has given a bullish crossover both on the daily and weekly charts — this is a positive signal that the trend may continue. The CCI, which tracks the speed and strength of price moves, is at 274, indicating very strong upside pressure. The Stochastic is at 93, which means the stock is in the overbought zone, but still confirming the ongoing strength. The price is trading above the VWAP (Volume Weighted Average Price), showing that buyers are dominating the day. Lastly, the stock has broken out of a Bollinger Band squeeze — a setup where the price was moving in a tight range and has now burst out with momentum. When all these indicators point in the same direction, it gives us a high-confidence signal that the breakout is genuine and may continue.
________________________________________________________________________________
🧱 Support & Resistance:
🔻 Supports:
• ₹887.83 – Immediate support (breakout zone)
• ₹803.32 – Mid-structure base
• ₹752.93 – Last support before invalidation
• Bottom Range: ₹599.10 – Historical demand base
🔺 Resistance Zones:
• ₹1022.73 – First resistance (Fibonacci level)
• ₹1073.12 – Previous swing top
• ₹1157.62 – 0.786 Fib level and prior rejection area
• Top Range: ₹1307.90 – Final upside Fibonacci target
________________________________________________________________________________
👀 What’s Catching Our Eye:
What really makes this setup stand out is that everything is coming together at once — and that doesn’t happen often. The stock has broken out of a rising channel, which is a strong chart pattern. It also crossed important Fibonacci levels, showing strength in the move. The volume is more than double the average, which tells us that serious buyers are stepping in. Momentum indicators like RSI and CCI are showing strong upward energy. On top of that, the price has broken out of a tight Bollinger Band range and is staying above VWAP, which adds more strength to the trend. When so many signals align like this, it usually means the stock has a good chance of moving even higher — this is what we call a high-confidence breakout.
________________________________________________________________________________
🔍 What We’re Watching For:
The key thing now is whether the stock can stay above the ₹950–₹960 zone over the next few days. If it does, it will confirm that the breakout is strong and has the potential to move higher. However, if the price dips slightly into the ₹900–₹915 range with low volume, it could be a good opportunity for a safe re-entry. On the other hand, if the stock closes below ₹887, it may be a warning sign that the breakout is failing. This zone is very important — it’s the make-or-break level that will decide if the uptrend continues or fades away.
________________________________________________________________________________
✅ Best Buy Levels (Low Risk Idea):
🔹 Entry: On pullback to ₹861.7–₹864.9 zone with SL ₹848.54
🔹 Low Risk Entry: ₹851.12 with Stop Loss: ₹833.72 (closing basis)
🔹 Risk-Reward: 1:1 | 1:2 +
📌 Avoid chasing — let the price validate the breakout
________________________________________________________________________________
💼 Sector Tailwinds:
AGI GREENPAC is in a business that’s currently seeing strong demand — especially from sectors like real estate, pharmaceutical packaging, alcohol bottling, and FMCG (like food and household products). These industries need high-quality glass and packaging, which is exactly what AGI provides. With growth happening in these areas, the company stands to benefit. This means that the fundamentals are also supporting the chart breakout, making the overall setup even stronger.
________________________________________________________________________________
⚠️ Risks to Watch:
Even though the chart looks strong, there are a few things to be careful about.
First, indicators like RSI and Stochastic show that the stock is in the overbought zone, which means a small pullback or correction is possible. If the price closes below ₹887, it could mean the breakout has failed. Also, if you start seeing red candles with low volume, it might be an early sign that buying interest is fading. Most importantly — don’t invest all your money at once. It's always better to enter with proper risk management and a clear plan, especially after a sharp move.
________________________________________________________________________________
🔮 What to Expect Next:
If AGI GREENPAC stays above the ₹950–₹960 range, it can likely move up to ₹1022–₹1073 in the short term. If the momentum continues and the stock breaks above ₹1073, it could head even higher toward ₹1157–₹1300 in the coming weeks. But if the price drops below ₹887, it could mean the breakout has failed, and the upward trend might not continue. So, the next few days are very important to confirm whether the breakout is real and sustainable.
________________________________________________________________________________
🧠 How to Trade AGI GREENPAC (For Educational Use Only):
🔹 Breakout Plan
• Entry: ₹988.60 or Pullback Zone ₹903–₹915
• SL: ₹842 (Closing basis)
• Risk-Reward: 1:1 | 1:2 +
• Position Sizing: Never all-in — always size by risk
________________________________________________________________________________
⚠ Disclaimer (Please Read):
• These Trades are shared for educational purposes only and is not investment advice.
• I am not a SEBI-registered advisor.
• The information provided here is based on personal market observation.
• No buy/sell recommendations are being made.
• Please do your own research or consult a registered financial advisor before making any trading decisions.
• Trading involves risk. Always use proper risk management.
I am not responsible for trading decisions based on this post.
________________________________________________________________________________
💬 Found this Helpful?
How would you trade this — chase momentum or wait for pullback entry?
👇 Drop your thoughts or questions below
🔁 Share this post with your trading community – let them benefit from clean charts, structured setups, and zone-based learning.
✅ Follow simpletradewithpatience for charts, clean setups, and educational content based on price action, zones, and risk-managed trades.
🚀 Trade with patience, trust your charts, and stay clear-headed!
Be Self-Reliant | Trade with Patience | Learn with Charts & Zones 📊________________________________________
Agigreenpac
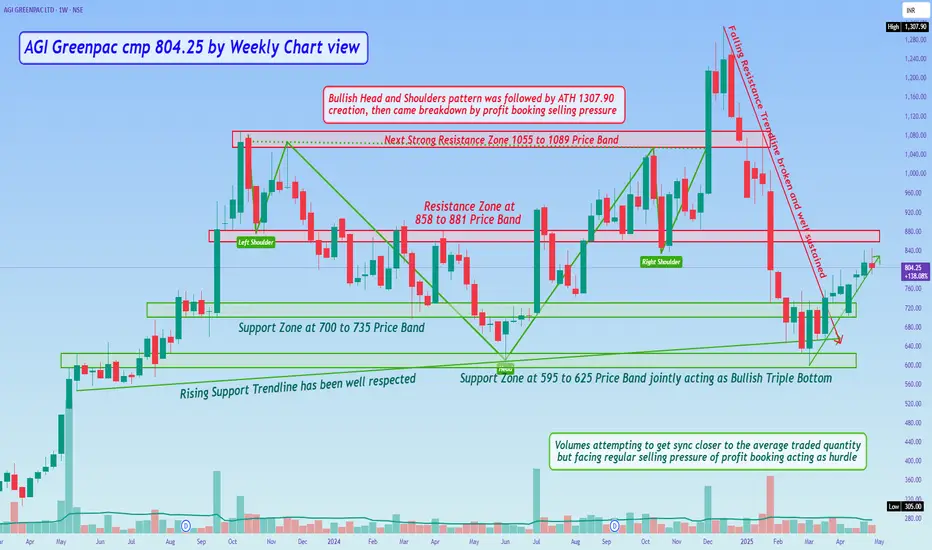
AGI Greenpac cmp 804.25 by Weekly Chart viewAGI Greenpac cmp 804.25 by Weekly Chart view
- Support Zone at 700 to 735 Price Band
- Resistance Zone at 858 to 881 Price Band
- Rising Support Trendline has been well respected
- Next Strong Resistance Zone 1055 to 1089 Price Band
- Falling Resistance Trendline is broken and well sustained
- Next Support Zone at 595 to 625 Price Band jointly acting as Bullish Triple Bottom
- Price closure for few days above the Resistance Band 858 to 881 with increased Volumes may trigger fresh upside momentum
- Bullish Head and Shoulders pattern was followed by ATH 1307.90 creation, then came breakdown by profit booking selling pressure
- Volumes attempting to get sync closer to the average traded quantity but facing regular selling pressure of profit booking acting as hurdle
One Breakout Of All Patterns Together | AGI Greenpac LTD⭕️ Price Action Analysis Alert !!!⭕️
⚡️Investing Opportunity💡
FOR EDUCATION PURPOSE ONLY!!!
1️⃣Company Overview
👉Glass containers for industries like food, beverages, pharmaceuticals, and cosmetics.
👉PET bottles and closures as part of its expanded portfolio in plastic packaging.
👉The company caters to both domestic and international markets, exporting to over 23 countries.
👉In recent years, the company has diversified into new business segments, including premium liquor packaging, real estate, and building solutions under its parent company, HSIL.
2️⃣Technical Analysis:-
✅Ascending Triangle Pattern BO
✅Rising Wedge Pattern BO (Yet to Happen)
✅Channel Pattern BO
✅Trendline BO
✅Double Bottom BO
✅ Supporting 100,200 EMA
🎯The current price indicating a sustained uptrend over the long term
🎯Overall technical indicators such as moving averages and oscillators align with a "strong buy" sentiment for the stock, reinforcing the bullish perspective
⚠️Investors should monitor broader market conditions, as technical indicators are one part of the decision-making process. Always consider fundamental analysis and market news before making investment decisions.
✍️28% YoY rise in Q2 FY25 net profit and improved EBITDA margins to 28%, Its stock recently surged 6.54%, reflecting strong investor confidence
✅Check out my TradingView profile to see how we analyze charts and execute trades.
🙋♀️🙋♂️If you have any questions about this stock, feel free to reach out to me.
📍📌Thank you for exploring our idea! We hope you found it valuable.
🙏FLLOW for more !
👍LIKE if useful !
✍️COMMENT Below your view !

AGI Greenpac cmp 1052.30 by Weekly Chart viewAGI Greenpac cmp 1052.30 by Weekly Chart view
- Resistance Zone 1055 to 1089
- Price Band 858 to 881 Support Zone
- Weekly basis Support at 881 > 765 > 643 with the Resistance only at ATH 1089
- Bullish Head and Shoulders pattern with the neckline made at midway of Resistance Zone
- Volumes gearing up attempting, to go above avg traded quantity by demand based buying

AGI Greenpac cmp939.95 by Weekly Chart views*AGI Greenpac cmp939.95 by Weekly Chart views*
- 875 to 895 Support Zone Price Band
- Stock Price is well above EMA 21-50-100-200
- Volumes incremental needed for upside move
- Weekly basis Support at 830 > 700 > 590 with Resistance only at ATH 1089
- *Bullish Momentum undertone by closely similar pattern behavior by past history and YET individually different*

AGI GREENPAC LTD - BREAKOUT STOCK - SHORT TERMAGI GREENPAC LTD. looking Good above 960.
Volume is Greater than last 10 trading sessions.
Price Above 50-100-200 Day Moving Average.
Monthly, Weekly, Daily RSI are above 50 Bullish Signal.
Daily DMI also Bullish.
Price above Middle BB means Bullish .
Weak Below 890 on CLB.
Ready For Upside 1120-1200-1300+

Long Setup in AGI Greenpac Ltd.A bullish flag & pole Chart Pattern Breakout on the Daily Time frame of NSE:AGI
Price Action supported by very good volume.
The stock is currently in uptrend making higher highs and higher lows.
One can add this stock into their stocks to buy list and initiate the long trade as per the levels mentioned on the chart
Stop loss will be on a Daily closing basis.
Trend Analysis :- UP Trend
Chart Pattern :- Bullish flag & pole Chart Pattern
Technical Indicator :- Positive MACD Crossover
Disclaimer: This is for educational purpose only.
