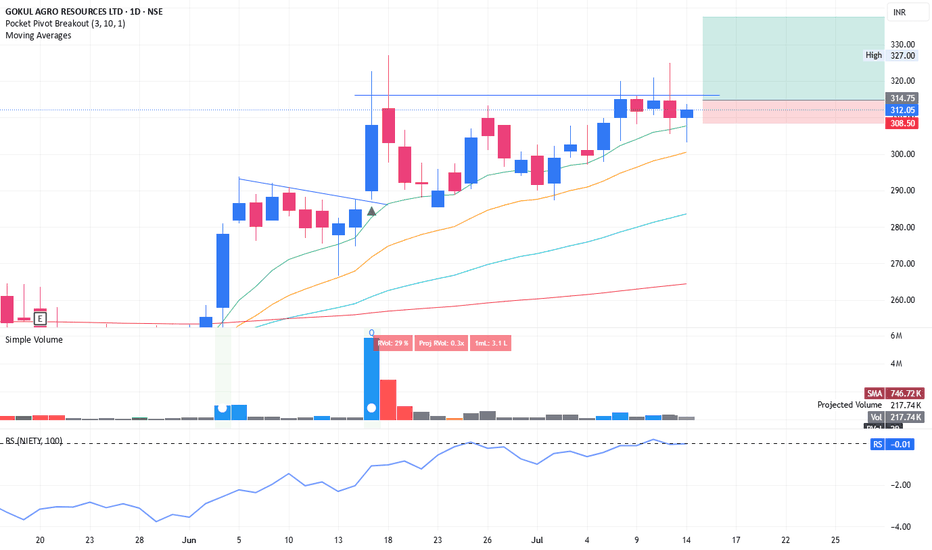
Swing trading opportunity with good risk : reward in GOKULAGROAgain coming up with swing trade idea. tight consolidation in range of 2-4% within last 5-6 days. Price is hovering around short term EMA. Looks like weak hands are exiting. Breaking above the pivot line could lead to significant push when crossing with good volume.
SL is somewhere around 3% (Refer the long position drawn over the chart).
One can invest 10% portfolio size as per following calculations
Position sizing and managing risk is the key.
Portfolio is: 1,00,000
Position size: 10,000
Risk 3%: 300. Which means only 0.3% of overall portfolio value is under risk.
Stay connected for commentary for coming days.
Disclaimer:
The information provided herein is for educational and informational purposes only and should not be construed as investment advice. The stock analysis and recommendations are based on publicly available information, data sources believed to be reliable, and our interpretation at the time of writing.
Investing in equities involves risks, including the risk of loss of capital. Past performance is not indicative of future results. Readers and investors are advised to conduct their own research or consult a qualified financial advisor before making any investment decisions.
The author(s), affiliates, or associated entities may hold positions in the stocks mentioned, and such positions are subject to change without notice.
We do not guarantee the accuracy, completeness, or timeliness of any information presented, and we disclaim any liability for financial losses or damages resulting from the use of this content.
AGRO
ARIES AGROOn the larger time frame what is visible is a VCP
Close to the multiyear resistance, a breakout here would mark the beginning of a fresh new trend. The fundamentals look decent too.
On the lower time frame a darvas box is being formed. Accumulation is taking place within the box. Time would decide when the breakout comes to light.
Hatsun Agro - Technical chart analysis Hatsun is in the correction since Sep' 2021 and is at strong support zone currently. Even the 850 levels are broken this stock has another support at 725 levels. The current support levels will be tested for next month and if the stock cant hold it,725 levels can be a good buy(or for averaging for the 850 levels). If the levels break down the 600 levels can wait for the stock to go for more correction of 75% from ATH.
Buy levels - 850-865
Sell - 1130-1150
Averaging - 725-740
Stop loss - 600
Narmada AgrobaseThis chart analyze the fluctuation zone of the stock in which it may render most of the time in the current time but As the PE ratio of the company is 59rs which is too high and the company is currently so much overvalued that more chances are that the prices may drop and the there would be a significant difference. for short term I analyzed the chart and it has a bearish trend which has currently a fluctuation zone (marked with yellow lines). Intraday trade can be predicted from this chart if my analysis is not wrong.
Breakout on either side can be used as anchoring point.
But the MACD chart has the EMA's which are both with the falling wedge which concludes there are more possibilities of the stock price going down.
The trade:
BULLISH
BUY after breakout of 26
Target-1: 27.30
BEARISH
Sell after breakout of 23
Target-1: 23
Target-2: 21
Please Correct me if I'm wrong somewhere. and also check out my other analyses on the profile
JAYANT AGRO ORGANICS LTD (Buy)NSE:JAYAGROGN
The analysis is simple 25 ema crossing 50 ema ( faster ema is crossing slower ema from below ) which is a long signal is mixed with some more technical analysis as you can see in the chart.
The stock has given a good breakout and retraced just like the textbook picture.
Invest only if breaks the resistance and shows good price action (HL and HH), always trade with good RRR (risk to reward ratio)
Note: I'm not SEBI registered person, it's just for educational purposes. Do your analysis before investing.
GOKUL AGRO KI TRAIN NIKAL PADI NEXT PLATFORM 50GOKUL AGRO KI TRAIN NIKAL PADI NEXT PLATFORM 50... Those who want to PICK catch the train and enjoy.
all technical reason mark
after squeeze Monthly Blast observed on Gokul AGRO
in.tradingview.com
Daily and 30 Min Band squeeze breakout also observed.
mcpriceaction


