BHARTIARTL (Airtel) – Daily Chart | Simple Long SetupBharti Airtel is currently pulling back after a strong up-move and has reached an important support area. Price is also near an upward trendline, which often acts as support.
🔹 Trend: Overall trend is up
🔹 Support Zone: Marked grey area
🔹 Entry Idea: Buy if price holds above support
🔹 Stop Loss: Below the red zone (support break)
🔹 Target: Previous highs / upper green area
📌 Why this setup makes sense (simple):
Price is in an uptrend
It came down to a support level
Trendline support is also present
Risk is small compared to reward
📈 If the price stays above support, it can move higher again.
⚠️ If it breaks and closes below support, avoid the trade.
💡 For learning purpose only. Always use stop loss.
Airtel

NATURALGAS1! 1D Time frame📍 Current Price
₹261
🔑 Key Levels
Immediate Resistance: ₹268 → ₹272
Immediate Support: ₹257 → ₹253
52-Week High: ₹366
52-Week Low: ₹188
Short-Term Outlook
Bullish Scenario: Sustained above ₹272 → possible move toward ₹280–₹285
Bearish Scenario: Falls below ₹257 → may test ₹253–₹250

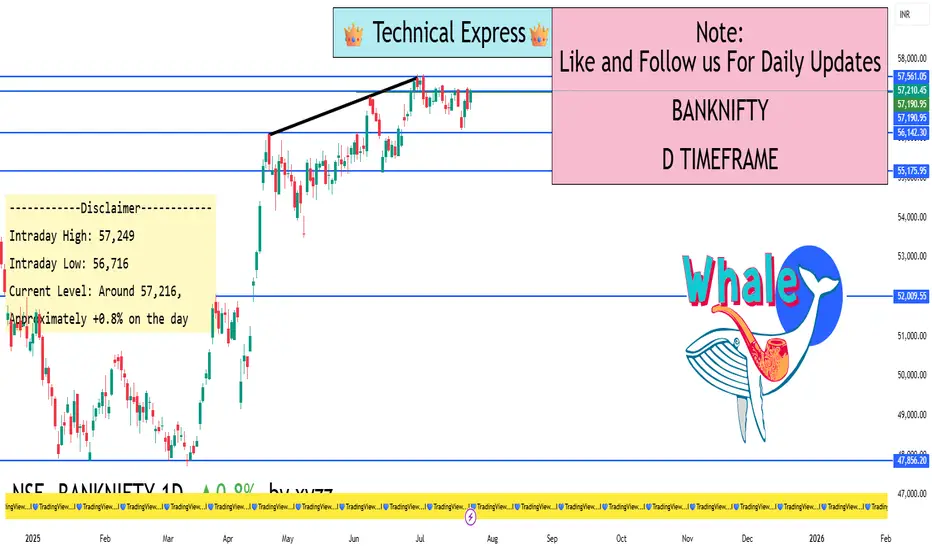
BANKNIFTY 1D TIMEFRAME📉 Market Overview
On the daily chart (1D timeframe), Bank Nifty showed signs of weakness today. It opened strong in the morning, moved higher during the first half, but faced selling pressure at higher levels and eventually closed near the day’s low.
This kind of price movement typically indicates short-term bearish sentiment and hesitation among buyers at higher levels.
📌 Key Market Data
Open: Around 57,200
High: Near 57,286
Low: Around 56,692
Close: Approximately 56,756
Net Change: Down by around 0.35% for the day
🔍 Candlestick Pattern
The candle formed today is bearish in nature. It could resemble something like a dark cloud cover or inverted hammer depending on the exact structure. This shows that bulls tried to push prices higher, but bears took over by the end of the session.
This candle near a resistance level usually suggests a reversal or at least a pause in upward momentum.
🔧 Technical Indicators (Daily Chart)
RSI (Relative Strength Index): Around 50–52
This shows a neutral zone — neither overbought nor oversold. It means the index has room to go either way depending on market sentiment.
MACD (Moving Average Convergence Divergence): Slightly positive
The MACD line is still above the signal line, showing some bullish momentum is intact — but it's fading.
Moving Averages:
20-day EMA: Bank Nifty closed below this line, showing short-term weakness.
50-day SMA: Still holding above this line, so the broader trend remains mildly bullish.
📊 Price Action Summary
Bank Nifty failed to break above the 57,300 zone.
Sellers became active at higher levels, pushing the index down.
Closing near the day's low shows bearish pressure is currently dominant.
The index is moving in a range, with no clear trend yet.
📈 What to Watch for Tomorrow
✅ Bullish Scenario:
If Bank Nifty moves above 57,300 with volume, we may see it head toward 57,500–57,800 in the next few days. This would indicate bulls are regaining control.
⚠️ Bearish Scenario:
If it breaks below 56,600, a further drop toward 56,000 is likely. This would be a signal that short-term correction is underway.
🔄 Sideways:
If the price stays between 56,600 and 57,300, the market is consolidating and waiting for a trigger (earnings, global news, RBI policy, etc.)
🎯 Strategy Outlook
Intraday traders: Be cautious near resistance (57,300) and support (56,600). These are zones where reversals happen.
Swing traders: Watch for a clear breakout or breakdown before taking big positions.
Options traders: Expect volatility to rise if it breaks out of the current range.
📌 Conclusion
Bank Nifty on the daily chart is showing signs of indecision and minor weakness. The index is stuck in a tight range, and traders are waiting for a clear breakout above resistance or breakdown below support. Until then, range-bound trading with proper stop-loss is advised.
If you’d like the same type of analysis for Nifty 50, Sensex, or specific stocks like Reliance or HDFC Bank, just ask — I’ll deliver them without links and in the same easy language.
Learn Institutional Trading Part-5🧠 What is Option Trading?
Option trading is the practice of buying and selling options contracts on stocks, indices, currencies, or commodities.
An option is a financial derivative — a contract that gives the buyer the right (but not the obligation) to buy or sell an underlying asset at a predetermined price on or before a specific date.
There are two types of options:
✅ Call Option: Right to buy the asset.
✅ Put Option: Right to sell the asset.
📝 Key Terms:
Strike Price: The price at which the option can be exercised.
Premium: The cost of buying the option.
Expiry Date: The last date the option is valid.
Lot Size: Options are traded in fixed quantities, known as lots.
Underlying: The asset the option is based on (e.g., Nifty, stock, commodity).
📊 Basic Example of Option Trading
Imagine stock ABC is trading at ₹100.
You buy a Call Option with strike price ₹105, expiring in 1 week, paying ₹3 as premium.
If ABC goes to ₹110, your option is worth ₹5 (profit = ₹2 per share).
If ABC stays below ₹105, your loss is limited to ₹3 (the premium paid).
Options allow you to leverage trades — you control large value positions with smaller capital.
🔍 Why Trade Options?
✅ Low Investment, High Potential: You pay only the premium, not the full asset price.
✅ Hedging: Protect long-term investments from market downturns.
✅ Strategic Flexibility: Make profits in bullish, bearish, or even sideways markets.
✅ Defined Risk: In buying options, your maximum loss is limited to the premium.
🧱 Types of Option Trading Strategies
There are two categories of traders:
Option Buyers
Option Sellers (Writers)
Let’s explore both with common strategies.
🔼 1. Option Buying Strategies
✔️ Bullish Strategies
Long Call: Buy Call expecting price to rise.
Bull Call Spread: Buy one Call and Sell higher strike Call to reduce cost.
✔️ Bearish Strategies
Long Put: Buy Put expecting price to fall.
Bear Put Spread: Buy higher strike Put and sell lower strike Put.
✔️ Volatile Market Strategy
Long Straddle: Buy both Call and Put at the same strike (profits in big moves).
Long Strangle: Buy OTM Call and OTM Put — cheaper than Straddle.
🔽 2. Option Selling (Writing) Strategies
Option sellers benefit from time decay and collect premium from buyers.
✔️ Range-Bound Strategies
Short Straddle: Sell both Call and Put at same strike (profits if price stays stable).
Iron Condor: Sell OTM Call and Put, buy further OTM Call and Put (limited risk).
✔️ Directional Strategies
Covered Call: Hold stock, sell Call for income.
Naked Put: Sell Put expecting price to stay above strike.
🛑 Warning: Selling options can have unlimited risk if not hedged properly. Only experienced traders should use these strategies.
🕰️ Time Decay & Option Greeks
Option prices are influenced by multiple factors. The most important ones are called Option Greeks:
🔹 Delta – Measures how much the option price moves for a ₹1 move in the underlying.
Call: Delta between 0 to +1
Put: Delta between 0 to -1
🔹 Theta – Measures time decay. Options lose value as they approach expiry.
🔹 Vega – Measures sensitivity to volatility. Higher volatility = higher premium.
🔹 Gamma – Measures how Delta changes as the underlying moves.
Understanding Greeks helps you manage risk, timing, and volatility in trades
💼 Option Trading in Institutional Trading
Institutions like hedge funds, FIIs, and banks use options to:
Hedge portfolios
Build complex arbitrage positions
Exploit volatility
Earn passive income via writing options
They don’t just guess direction — they analyze Open Interest, volume, VIX (volatility index), and option chains to create data-driven positions.
Retail traders can track institutional activity by analyzing:
Option Chain Data
Open Interest Build-up
Put-Call Ratios (PCR)
Volume Spikes in OTM options
📈 Real-World Example: Bank Nifty Intraday Option Buy
Bank Nifty is at 48,000.
You buy a 48,100 CE for ₹150.
It jumps to 48,400 within 1 hour.
Your CE premium rises to ₹350.
You book profit: ₹200 * 15 lot size = ₹3,000 profit (before brokerage/taxes).
Such short-term intraday moves can yield high returns, but also come with high risk.
📉 Common Mistakes in Option Trading
🚫 Holding options till expiry without purpose
🚫 Buying OTM (far out-of-money) options hoping for big moves
🚫 Ignoring Theta decay
🚫 Not managing position size
🚫 Lack of understanding of Option Greeks
🛡️ Risk Management Tips
💰 Never risk more than 2-5% of capital per trade.
✅ Use stop-loss or premium SL.
📚 Always trade with a defined strategy.
🧊 Avoid overtrading in high-volatility news events.
📊 Backtest your setups and understand risk-reward ratios.
🧠 Mindset for Option Trading
Be logical, not emotional.
Accept losses as part of the game.
Focus on probability, not certainty.
Be a risk manager first, trader second.
Learn from your trades — both wins and losses.
🎯 Final Words: Why You Should Learn Option Trading
Option trading is not gambling. It’s a skill — one of the most strategic tools in the financial markets. With proper education, discipline, and practice, options can give you:
🔹 More ways to profit in any market
🔹 Better control over risk
🔹 Flexible strategies for every condition
Whether you want to day trade Nifty options or hedge your long-term investments, mastering option trading puts you ahead of 90% of retail traders

Support and ResistenceWhat is Support?
Support refers to a price level where a downtrend tends to pause or reverse due to increased buying interest. When price drops to a support level, traders and investors see it as a “discounted” price, which attracts buying activity. This buying demand causes the downtrend to slow down or reverse.
Key Points About Support:
It acts as a floor in the market.
Support levels are created when buyers are willing to purchase at a certain price level.
The more times price touches a support level and bounces back, the stronger the support becomes.
Once broken, support can become resistance, meaning that if the price breaks below support, it may face difficulty moving back up past that level.
What is Resistance?
Resistance refers to a price level where an uptrend tends to pause or reverse due to increased selling pressure. When price rises to a resistance level, traders see it as an “expensive” price and tend to sell, causing the price to stall or drop.
Key Points About Resistance:
It acts as a ceiling in the market.
Resistance levels are formed when sellers dominate and prevent the price from moving higher.
The more times price touches resistance and fails to break through, the stronger the resistance is.
If price breaks above resistance, it can become support, known as a support-resistance flip.
Why Support and Resistance are Important
✅ Identifies High-Probability Trade Zones – Helps you spot where to enter and exit trades.
✅ Improves Risk Management – Lets you place stop-loss orders around logical areas.
✅ Confirms Market Direction – Breakouts and rejections from these zones signal potential trend continuations or reversals.
✅ Works Across All Timeframes – Support and resistance can be applied to intraday trading, swing trading, and long-term investing.
Types of Support and Resistance
🔹 Horizontal Levels
Flat, horizontal price areas where the market reverses multiple times. This is the simplest and most common form.
🔹 Dynamic Support and Resistance
Levels that change with price movement, usually identified using moving averages like the 50-day or 200-day MA.
🔹 Trendlines
Diagonal support and resistance lines that connect higher lows in an uptrend or lower highs in a downtrend.
🔹 Zones Instead of Exact Lines
Professional traders focus on zones, not exact price points, because the market often reacts within a range.
How Professionals Use Support and Resistance
Institutions use these levels to accumulate positions quietly.
Smart traders wait for confirmation (candlestick patterns, volume increase) before entering trades.
Breakouts of these levels often lead to big moves because many stop-loss orders are triggered, creating momentum.
False breakouts or liquidity grabs are used by big players to trap retail traders before reversing the market.
Final Thoughts
Understanding support and resistance is fundamental to becoming a successful trader. It helps you anticipate market behavior, manage risk, and trade with confidence. Whether you are a beginner or an experienced trader, continuously refining your ability to identify and trade these key levels will improve your consistency and profitability.
Support and resistance are not just lines on a chart — they are the battle zones where market decisions are made. Master them, and you will master the market.

Master Institutional TradingWhy Master Institutional Trading?
The stock market, forex, and other financial markets are highly manipulated environments, driven by the decisions of institutional traders, banks, hedge funds, and large players. Learning how these institutions trade gives you the clarity and confidence to trade in the direction of smart money rather than becoming a victim of market traps.
With this program, you will not only learn how the markets operate but also how to read price movements like an institutional trader. You’ll master advanced techniques that allow you to identify high-probability trade setups, manage your risks like a professional, and trade with patience and precision.
Key Features of Master Institutional Trading
Smart Money Concept (SMC): Understand the core principles of smart money trading, including how large institutions accumulate and distribute assets.
Liquidity Hunting Strategies: Learn how institutions use liquidity zones, stop loss hunting, and false breakouts to trap retail traders — and how you can profit by following their footprint.
Order Block Mastery: Master the identification of order blocks, breaker blocks, and mitigation blocks — key areas where institutional orders are placed.
Market Structure & Price Action: Analyze clean price action without relying on lagging indicators. Understand market structure shifts, internal and external liquidity, and premium/discount zones.
Advanced Risk Management: Learn professional risk management techniques to control drawdowns and maximize returns, including how institutions scale in and out of positions.
Live Market Analysis: Get exposure to live trading sessions where experts explain the logic behind every trade entry and exit, based on institutional concepts.
Psychological Discipline: Develop a winning mindset focused on discipline, patience, and long-term profitability, just like professional traders working in financial firms.
Who Is This Course For?
This program is ideal for:
Traders who want to stop following retail strategies and learn real market mechanics.
Beginners who want to build a solid institutional foundation from the start.
Intermediate traders who are struggling with inconsistent results and want to level up their skills.
Experienced traders who wish to refine their market reading abilities and trade with greater precision.
Full-time or part-time traders seeking to understand price manipulation and liquidity traps.
What You’ll Gain from This Master Class
✅ The ability to track institutional footprints and predict market movements more accurately.
✅ A complete system based on price action, market structure, and liquidity analysis.
✅ Tools and strategies to avoid false signals and stop-loss hunts.
✅ Improved risk-reward ratios by trading in the direction of smart money.
✅ A professional, emotion-free approach to trading that focuses on long-term profitability.
✅ Real-world practical skills that you can apply in any market — stocks, forex, crypto, or commodities.
This is not a basic or theoretical course. The Master Institutional Trading program delivers real, professional-level trading knowledge, breaking down the hidden market mechanics that drive price action. By the end of this program, you will no longer trade like the crowd — you will trade like the institutions that move the markets

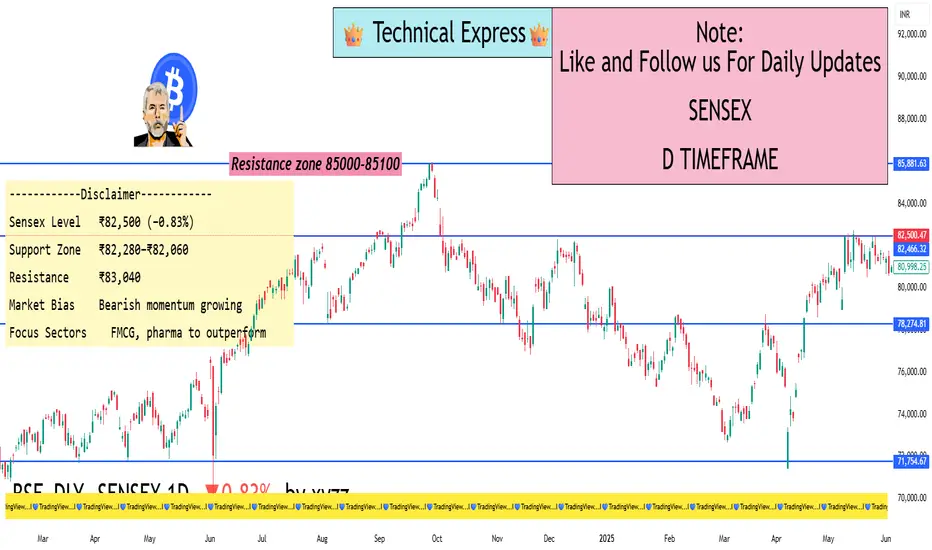
Sensex Dives Below ₹82,600 — IT Stocks Drag Index DownFrom a technical standpoint, Sensex breaking below ₹82,600 is important. This was seen as a short-term support level. Now that it's broken, ₹82,280 and ₹82,060 are the next zones to watch for.
Moving Averages:
Sensex has slipped below its 20-day moving average, which is often used as a trend indicator.
This shows short-term weakness and signals caution for traders.
RSI (Relative Strength Index):
RSI is heading lower but not yet in oversold territory.
This means there could be more downside before a potential bounce.
MACD:
The MACD indicator is also showing bearish crossover – another sign that the market could stay weak in the near term.
What Should Traders & Investors Do Now?
For Traders:
This is a time to stay cautious.
Avoid taking aggressive long positions unless Sensex reclaims ₹83,000+ with strong volume.
Focus on stock-specific opportunities in sectors like FMCG, pharma, or even PSU banks.
For Long-Term Investors:
Don’t panic. Corrections like these are common.
Instead of trying to time the market, look for quality stocks at attractive valuations.
IT stocks are fundamentally strong, so long-term investors can accumulate slowly on dips, especially if they fall further.
Global Factors at Play
What happens in the global economy directly affects Indian markets. Here are some international cues that are influencing Sensex:
US Interest Rates:
The US Federal Reserve may raise interest rates again to fight inflation.
Higher rates make borrowing expensive, slow down spending, and can trigger a global slowdown.
China's Economic Data:
Slower growth in China has worried global investors.
A slowdown in Asia’s biggest economy has ripple effects on global demand.
Geopolitical Tensions:
Trade issues, especially between the US and China, are creating uncertainties.
Wars or unrest in regions like Ukraine or the Middle East also cause global instability.
What to Watch in Coming Days
Key Events:
More Q1 results from major companies
Global inflation data releases
FII (Foreign Institutional Investors) activity – whether they continue selling or start buying
Crude oil price movement – as it affects inflation and currency
RBI commentary on interest rates
📢 Final Thoughts
The fall in Sensex below ₹82,600 is a signal for caution, not panic. The IT sector’s weakness has triggered the fall, but the overall market is still stable when compared to global peers.
For serious investors, this is a good time to review portfolios, build a watchlist, and focus on quality stocks and sectors that show relative strength. Defensive sectors like FMCG and pharma are showing signs of leadership.
Market cycles are natural – after every fall, there's a recovery. The key is to stay updated, stay disciplined, and not let emotions drive your decisions.
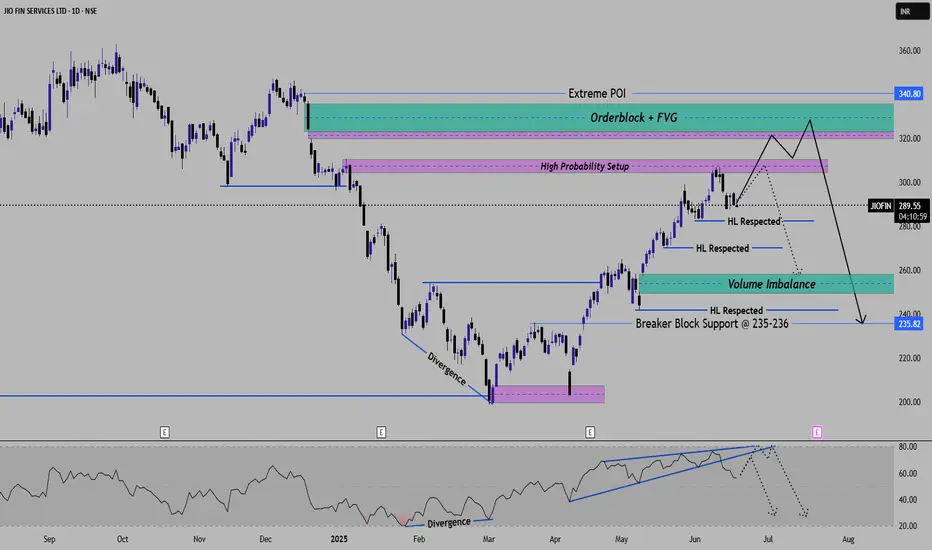
Jio Financial ---- Deep AnalysisJIOFIN -- High Probability Reversal Setup Based on ICT & SMC Concepts
Timeframe - Daily
Projection -- High Probability Reversal Setup expected.
Price Action Overview --
Stock is currently Respecting an internal bullish structure without breaking higher lows.
And stock is currently moving towards High probability POI zone along with --
Order block + FVG is 330-340 levels
Liquidity zone just below the Order block
Liquidity & POI Zone ----
Immediate Liquidity is resting above the levels of 290-300
Imbalance ---
Downside VOlume imbalance between 250-260 levels
below that there is breaker block support zone
RSI ----
Rsi divergence observed at bottom, which shows a bullish move
Rsi showing potential exhaustion or say confluence for reversal after POI is tapped.
Final projection for next 2-3-4 months view -----
Main Target (High Probability) -- Price likely to sweep buy-side liquidity above 300-310
tapping into orderblock + FVG zone 330-340 levels
Expecting strong rejection and sell-off towards Volume imbalance(255) and Breaker block(235)
If main Target Does not go well --- If rejection occures earlier around 300-310 then a partial distribution may trigger
earlier dump into volume imbalance without reaching to Orderblock.
This setup is just reflecting classic Buy-side liquidity grab >>>>> Sell off into imbalance.
Your views or comments are really welcomed. Also just give comments for any confusion or clarification.
#Nifty #Sensex #Jio #Reliance
Airtel Strong Q3 and Uptrend NSE:BHARTIARTL is showing a good uptrend with good Q3 Numbers.
Revenue growth was driven by strong underlying momentum in India, sustained constant currency growth in Africa, and the consolidation of Indus Tower Limited, effective 19 November 2024. Net profit increased significantly due to an exceptional net fair value gain on Indus Tower and a forex gain due to currency appreciation. Capex for FY25 is expected to be lower than FY24, and that would expand in FY26. Fibre rollout continues to be a key area of focus for the company.
About:
NSE:BHARTIARTL is one of the world’s leading providers of telecommunication services. It is in 18 countries, including India, Sri Lanka, and 14 African countries.
F&O Activity:
Long Buildup in Futures with 1720 CE Gaining Significant OI.
Trade Setup:
It looks like a good 1:1 trade setup, with the recent base as a strong support zone, the RSI and MACD trending upwards, and the trendline being respected.
Target(Take Profit):
Around 1720 Levels for Swing & 1842 for Positional Trader.
Stop Loss:
Entry Candle Low or Trendline for Swing Trader and Recent Base for Positional Trader.
📌Thank you for exploring my idea! I hope you found it valuable.
🙏FLLOW for more
👍BOOST if useful
✍️COMMENT Below your views.
Meanwhile, check out my other stock ideas below until this trade is activated. I would love your feedback.
Disclaimer: "I am not SEBI REGISTERED RESEARCH ANALYST AND INVESTMENT ADVISER."
This analysis is intended solely for informational and educational purposes only and should not be interpreted as financial advice. It is advisable to consult a qualified financial advisor or conduct thorough research before making investment decisions.

Airtel Bharti Technical showing Bullish trendline.Bharti airtel is showing some amazing charts for bullish trendlines and breakouts. It can reach to 25% upside.

Bharti Airtel Ltd. - Breakout OpportunityDate : 15-Dec-2024
LTP : Rs. 1,681.75
Targets: (T1) Rs. 1,779 --> (T2) Rs. 1,944
SL : Rs. 1,511
Technical View:
• NSE:BHARTIARTL is in strong primary uptrend and was recently going through it's secondary downtrend within primary uptrend.
• After touching a lifetime high of 1,779 on 26-Sep-2024, it has retraced 15% to 1,511 level.
• NSE:BHARTIARTL has breakout from it's secondary downtrend on 13-Dec-2024 with higher than average volume.
• NSE:BHARTIARTL has closed above 20 DEMA and 50 DEMA on 12-Dec-2024 and currently trading above 20 DEMA and 50 DEMA.
• RSI is in buy zone and trading at 63.85. MACD has given bullish crossover on 13-Dec-2024 and trading at 5.19
• Looking strong to start a new swing from here.
Liked the analysis? Boost/Like this idea and follow my ID for more ideas.
Disclaimer: I am not a SEBI registered analyst/consultant and not recommending anyone to take any BUY or SELL position in stock market. Investing in stock market is risky and one should do a self analysis and validation before investing in stock market. My ideas are published for learning purpose only and are available to everyone at no cost/charge.

BHARTI AIRTEL#BHARTIARTL
Resistance 1615. Watching above 1620 for upside movement...
Support area 1580. Below 1600 ignoring upside momentum for intraday
Support 1580. Watching below 1578 for downside movement...
Resistance area 1610-1615
Above 1605 ignoring downside move for intraday
Charts for Educational purposes only.
Please follow strict stop loss and risk reward if you follow the level.

BHARTI AIRTEL Support Breakdown: Don't Miss This !A break below support indicates sellers are willing to sell at even lower prices. It also indicates a lack of buyers.
Please share this as much as you can so that we all collectively can short airtel below 1662 closing level
Keep boosting this so that I am reminded to find more such scripts to help all of you !

Bharti Airtel - Posiibly BearishStock broke Trend line
Currently going for LL LH structure
1720 & 1740 remains to be Strong resistance area
If remains unbroken stock can head towards 1655 / 1630 area
View changes if closes above 1745

Bharti Airtel is looking WeakIt's had a good rally and it's time for a breather.
I guess it should atleast take out Target 1 and Target 2

Bharti Airtel - Possible upsideStock may go to make new highs in coming times
Seems live Wave 2 is about to start
Risk is high but looks like reward will be higher
View negates below 1500
Will wait for a pullback to accumlate more

Bharti Airtel cmp 1589.05 by a Monthly Chart view- Stock price trading well above EMA 9, 14, 21, 50, 100, 200
- Volumes have leaped close to double over the past few months
- Weekly basis : Support at 1491 > 1389 > 1274 with Resistance only at ATH 1608.40
- Stock traded in price range marked on the chart for respective period between Aug 2021 to August 2022 and August 2022 to August 2023, before a breakout to traverse in the Rising Price Channel

Idea - Major breakout - Cup & Handle - Can double from here !Idea has got several major news in past few days !!
Strong volumes breakout as well !!
Breakout zone is 18.5 and above
Support is around 16
It can easily hit 27-35 levels in coming months !!

BHARATI AIRTEL FOR 1500Bharti Airtel Limited, commonly known as Airtel, is an Indian multinational telecommunications services company based in New Delhi. It operates in 18 countries across South Asia and Africa, as well as the Channel Islands. Currently, Airtel provides 5G, 4G and LTE Advanced services throughout India.
Bharati Airtel is currently looking good for level @1425 for target 1500 with Stop loss : 1350
Note : This is not a stock recommendation it is only for educational purpose

BHARTI AIRTEL BULLISH VIEWBharti airtel looking good
it is in demand zone
invest in CPM
most of the smart money enter in this zone
so most of the chances it's going to up side
my first target@1520
second target@1650
stop loss@1321
Disclaimer:
I am not a SEBI Registered Analyst. Anything posted here is my own analysis and views. This is created for educational purposes only. Always consult your Financial Advisor before taking any decision or trade.
Happy trading.
so please keep Bharti airtel in your watchlist for long term investment.
If you like my view, do support it with a boost witch is valuable inspiration for me to post ideas like this in future. thank you friends!

BHARTIARTL SHORTBharti Airtel has finished Wave 5 according to the Elliot Wave Theory and is poised for a correction. We're currently anticipating a strong follow-up candle to the recent Lower High (Spinning Top Candle), which could signify a trend reversal.
ADDITIONALLY, ENDING DIAGONAL TRAIANGLE CAN ALSO BE SEEN.

Airtel gave Good Returns to the Long Term Investors...!Airtel give Breakout above imp level of 900 on weekly TF
It continued showed it's upside momentum and Made high of 1220+
Long term investors got Good Returns from the stock
It may come for Pullback around imp Fibo levels
Keep in Radar
* For Education Purpose
Practice and Learn price action setups

BHARTI AIRTEL - Swing Trade - 3rd March #stocksBHARTI AIRTEL (1D TF) - Swing Trade Analysis given on 3rd March, 2024
Pattern: FALLING WEDGE BREAKOUT
- Volume buildup at Resistance - Done ✓
- Resistance Breakout - In Progress
- Retest & Consolidation - In Progress
#stocks #swingtrade #chartanalysis #priceaction #traderyte #BHARTIAIRTEL #stockmarket #sharemarket #viral #sharemarketindia #StockMarketindia
