FedFina (D): Aggressive Bullish (Blue Sky Breakout)(Timeframe: Daily | Scale: Linear)
The stock has confirmed a major "Rectangle Breakout" from a 5-month consolidation base. By clearing ₹166.80, it has entered "Price Discovery" territory (New ATH), powered by pre-earnings institutional buying.
🚀 1. The Fundamental Catalyst (The "Why")
The breakout is timed perfectly with corporate events:
> Earnings Anticipation: The Q3 FY26 results are scheduled for Jan 16, 2026 . The massive volume suggests that "informed investors" expect robust AUM growth and stable asset quality.
> Sector Re-rating: Small/Mid-cap NBFCs are currently outperforming larger peers due to faster growth rates, attracting capital flows.
📈 2. The Chart Structure (The Base)
> The Pattern: Sideways trend (₹133 – ₹166). This 5-month pause allowed the stock to digest its gains from the Apr 2025 lows (₹80).
> The Breakout: Yesterday's close at ₹176.40 was decisive.
- Significance: A breakout to a new ATH usually signals the start of a new, durable trend rather than a quick pop.
📊 3. Volume & Indicators
> Volume Ignition: The 6.89 Million volume is an "Ignition Bar." It confirms that the breakout is real and not a "retail trap."
> Indicators:
- RSI: Rising into the "Overbought" zone (>70) is actually positive here. In strong momentum stocks (like NBFCs in a bull run), RSI can stay overbought for weeks.
- EMAs: The stock is trading well above all short-term averages, confirming the markup phase.
🎯 4. Future Scenarios & Key Levels
The stock is now in unchartered territory.
🐂 Bullish Target (Blue Sky):
- Target 1: ₹200 .
- Target 2: ₹215 .
🛡️ Support (The "Must Hold"):
- Immediate Support: ₹166 – ₹168 . The previous resistance ("The Ceiling") must now act as a rigid floor ("The Floor").
- Risk: Be careful of "Sell the News" volatility after the Q3 results are announced. If the stock falls back below ₹160 , the breakout could fail.
Conclusion
This is a Grade A Setup .
> Strategy: The breakout is valid. If you are holding, trail your stop loss. If looking to enter, wait for the Q3 results (Jan 16) to settle.
Alltimehigh

M&M FIN SAILING IN BLUE SKY ZONEBUY M&M FINANCE 355 for 380 to 410 levels.
Technical breakout to all time high zones with volumes.
View invalid if falls below 325 on weekly closing.

GolD Market Update | XAU/USDGold Market Update | XAU/USD
Gold prices eased slightly to around $4,500 per ounce, retreating from record highs but remaining strongly supported by ongoing geopolitical uncertainty and expectations of further US interest rate cuts.
Optimism around Russia–Ukraine peace talks improved after US President Donald Trump stated that negotiations have made significant progress, with Ukrainian President Volodymyr Zelenskiy noting that nearly 90% of the framework is agreed and security guarantees are in place. However, unresolved issues—particularly territorial control of the Donbas region—continue to limit downside pressure on gold.
Additional support comes from persistent Middle East tensions and rising US–Venezuela frictions, keeping safe-haven demand elevated. Investors are now focused on the upcoming FOMC minutes for guidance on the Fed’s policy outlook, with markets currently pricing in two rate cuts next year.
On a broader scale, gold is up over 70% year-to-date, on track for its strongest annual performance since 1979, driven by aggressive central bank purchases and steady ETF inflows.

Shriram Fin (D): Cautiously Bullish - Breakout with IndecisionTimeframe: Daily | Scale: Linear
The stock has attempted a breakout from a multi-week consolidation range, hitting a new All-Time High. However, the formation of a Neutral Candle on high volume signals a fierce battle between buyers and sellers at the top. The breakout needs confirmation.
📈 1. The Chart Structure (Consolidation)
> The Range: The stock has been trapped between ₹820 (Support) and ₹870 (Resistance) .
> The Breakout Attempt: Today (Dec 18, 2025), the stock pierced the upper band to hit ₹867.90 .
> The Candle: The daily candle closed as a Spinning Top (small body, long wicks). This indicates indecision. Despite the record volume, the bulls failed to close near the day's high, showing supply pressure at ₹870.
📊 2. Volume Analysis (The Warning)
> The Spike: Volume of 12.48 Million is huge.
> Interpretation: When you see Record Volume + Neutral Candle at resistance, it often means Distribution (sellers absorbing the buying pressure).
> Action: This invalidates an immediate "buy at market" order. You must wait for the price to clear today's high.
🚀 3. The Fundamental Context (Post-Split Stability)
> Valuation: Since the 1:5 Stock Split in Jan 2025, the stock has stabilized in this ₹800s zone. The current consolidation is a healthy digestion of the post-split gains.
> Catalyst: Recent reports of a stake sale (20% to MUFG) or strategic partnership are keeping the volume elevated. This news flow is the likely driver of the breakout attempt.
🎯 4. Future Scenarios & Key Levels
The "Neutral Candle" dictates a Wait & Watch approach.
> 🐂 Bullish Confirmation (The Trigger):
- Condition: A decisive Daily Close above ₹870 .
- Target 1: ₹920 .
- Target 2: ₹970.
> 🐻 Bearish Rejection (The Fakeout):
- Condition: If the stock slips below today’s low ( ~₹855 ).
- Implication: The "Spinning Top" would confirm a short-term top, sending the stock back into the box toward ₹820 .
Conclusion
Technically, the breakout is NOT confirmed yet. The high volume without a strong close is a red flag.
> Strategy: Do not chase here. Wait for a close above ₹870 to confirm that the "churn" has resolved in favor of the bulls.

HBL ENGG, FRESH BREAKOUT FOR ANOTHER BULL RUNHBL ENGG (W) 800 has given fresh breakout above 735 and highest all time high closing. All leading and lagging indicators are bullish. Breakout is supported by heavy buying volumes.
Expected technical targets are 940/1080/1260 in next 12 to 18 months.
Set up invalid if stock falls below 740 on weekly closing basis.
Daily Analysis: Nifty 28/11/25Targets on either side for Nifty based on the breakout of support and resistance levels as mentioned.

SOL DUMP TO THE $40YES, YOU SEEN RIGHT
CRYPTO:SOLUSD
SOL ready with multiple negative patterns.
1. all time resistance
2. triple top
3. cup and handle failure
First pattern is already activated and triple top near to active.
Reverse scenario
take support from major strong support. cup and handle breakout
🧠 Always DYOR (Do Your Own Research)
⚖️ This is not financial advice or suggestion
👉 “Risk Is Real 💸 Stay Practical🚀”
💬 Please feel free to ask any questions (It's Free)

SHYAM METALLICS - PERFECT BULLISH TRADESHYAM METALICS, 970, (D) Stock has given CUP&HANDLE breakout on daily timeframe.
Good potential to test 1020/1075/1140 and 1200 if breakout gets sustained. Trade invalid if falls below 920 levels on 2 days closing basis.
Torrent Pharma (D): Strongly Bullish, Blue-Sky BreakoutThis is a high-conviction breakout. The stock has broken out of a 4-month consolidation, setting a new all-time high on high volume. The move is strongly supported by all indicators and a powerful fundamental catalyst.
📈 1. The Dominant Pattern: ATH Breakout
- The Consolidation: After making its previous ATH in July 2025, the stock entered a 4-month sideways trend.
- The "Lid": A horizontal resistance line formed at this ATH (approx. ₹3,787 ) restricted all forward movement.
- Volume Contraction: Volume was "drying up" during this consolidation phase. This is a classic bullish sign of seller exhaustion and accumulation.
🚀 2. The Decisive Breakout (Today's Action)
- The Surge: Today, the stock shattered this resistance with a 6.63% surge , backed by a high-conviction volume of 1.65 Million shares.
- The New ATH: This move resulted in a new all-time high, pushing the stock into a "blue-sky" price discovery phase.
- The Catalyst: This technical move is not speculative. It is driven by strong Q2 2026 earnings (30% profit growth), confirming that institutions are buying on good news.
📊 3. Key Technical Indicators
Indicator analysis confirms the bullish momentum across all timeframes:
- RSI: The Relative Strength Index is rising on the Daily, Weekly, and Monthly charts .
- EMAs: The short-term Exponential Moving Averages are in a "PCO" (Price Crossover) state on all three timeframes.
🎯 4. Future Scenarios & Key Levels to Watch
⚠️ A Note of Caution (The "Fakeout" Risk)
The risk is a "bull trap" or "fakeout." The correct thing to watch for, is bearish divergence (i.e., if the stock makes another new high, but the RSI makes a lower high).
🐂 The Bullish Case (Confirmation)
- Confirmation: The ideal "textbook" move would be a re-test . We want to see the stock pull back to the ₹3,787 level and "bounce," confirming the old resistance has become new support.
- Target: If the bullish momentum continues, the next logical target is ₹4,100 .
🐻 The Bearish Case (Breakout Failure)
- Trigger: The breakout fails, and the stock loses momentum (a "bull trap").
- Confirmation: The price falls and closes back below the ₹3,787 support level, invalidating the breakout.

Thangamayil (M): Strongly Bullish, Blue-Sky BreakoutThis is a high-conviction breakout. The stock has broken out of a year-long consolidation base, created a new all-time high, and is supported by explosive volume and powerful fundamental results.
📈 1. The Long-Term Context (The "Big Picture")
- Logarithmic View: On a long-term logarithmic chart, this move is a continuation of a major uptrend.
- The Consolidation: After hitting its previous All-Time High (ATH) in October 2024, at ₹2,567.50, the stock entered a year-long sideways consolidation.
- Drying Volume: During this phase, volume "dried up," which is a classic bullish sign of seller exhaustion and accumulation by new buyers.
🚀 2. The Decisive Breakout (The November 2025 Event)
- The Surge: In the first week of November 2025, the stock shattered this consolidation with a massive +40.17% surge.
- High-Conviction Volume: This move was backed by exceptional, non-speculative volume of 3.67 Million shares, confirming strong institutional interest.
- New ATH: This surge pushed the stock into "price discovery" mode, creating a new all-time high.
📊 3. The Fundamental Catalyst (Why it's Breaking Out)
This powerful technical breakout is fully supported by blowout fundamental news, which gives the move high validity:
- Massive Profit: The company reported a sharp Q2 profit turnaround (from a net loss last year to a ₹58.5 Cr net profit).
- Record Sales: The company also announced record-breaking sales in October , crossing the ₹1,000 Cr mark for the first time in a single month.
🎯 4. Future Scenarios & Key Levels
- Bullish Indicators: The short-term EMAs are in a PCO state and the RSI is rising , confirming the momentum is strong and on the side of the buyers.
🐂 The Bullish Case (Price Discovery)
- Trigger: If this momentum is sustained, the stock is in "blue-sky" territory with no overhead resistance.
- Target: Projected target of ₹4,150 is a logical next-level based on technical extensions.
🐻 The Pullback Case (Support Test)
- Trigger: If the momentum pauses or a pullback occurs (which is healthy after a 40% surge).
- Support: The most critical level to watch is the old resistance-turned-support zone at ₹2,560 - ₹2,570 . A re-test and "bounce" off this level would be a textbook confirmation of the new support and an ideal entry point for those who missed the initial breakout.

Vintage Coffee (D): Breaks Out of Consolidation on High VolumeAfter a powerful 125% rally since March 2025, Vintage Coffee (VINCOFE) entered a healthy sideways consolidation phase in July. Today, that consolidation has been decisively resolved to the upside, signaling a potential continuation of the primary uptrend.
Today's Decisive Breakout
The stock has been capped by a stubborn horizontal resistance trendline since July, with multiple previous breakout attempts failing* at this level. Today's price action (Wednesday, October 29, 2025) was different:
- Strong Price Surge: The stock rallied by +7.82% .
- High-Volume Confirmation: The move was supported by a strong volume of 7.53 million shares.
- Key Resistance Breach: Most importantly, the stock closed above the resistance trendline , a significant technical victory for the bulls.
This breakout is particularly convincing because it follows a classic volume pattern: volume dried up during the consolidation and then surged in the past couple of days, fueling today's successful move.
Underlying Technical Strength
The breakout is well-supported by key momentum indicators on the Weekly and Daily timeframes:
- The short-term Exponential Moving Averages (EMAs) are in a bullish Positive Crossover (PCO) state.
- The Relative Strength Index (RSI) is in a rising trend.
Outlook and Key Levels to Watch
With the consolidation now broken, the path of least resistance is higher.
- Bullish Target: If this bullish momentum is sustained, the next logical area of resistance and potential target is the ₹180 level.
- Critical Support: The old resistance level, around ₹155 , is now the most critical new support zone.
As you rightly noted, the ideal scenario would be a successful re-test of this ₹155 level. A bounce from this "resistance-turned-support" would provide the strongest confirmation for the next leg up.

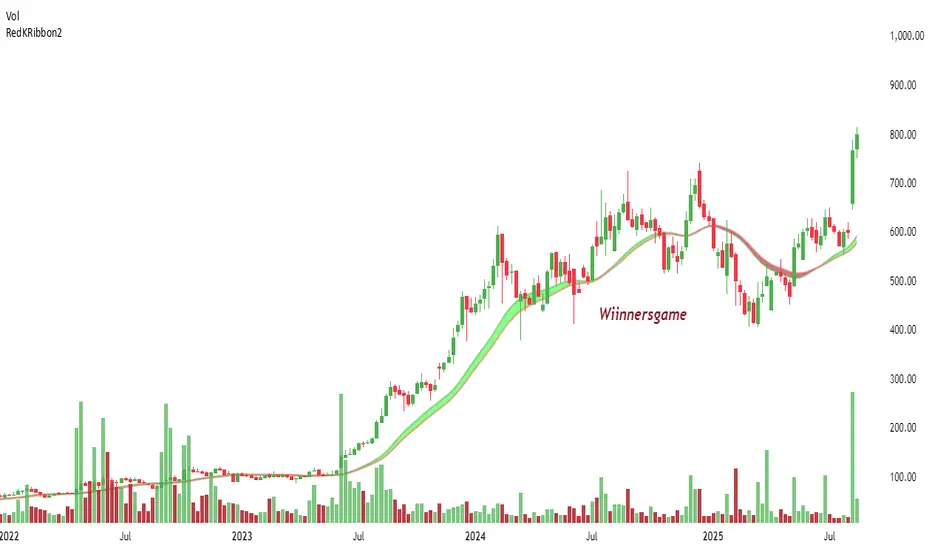
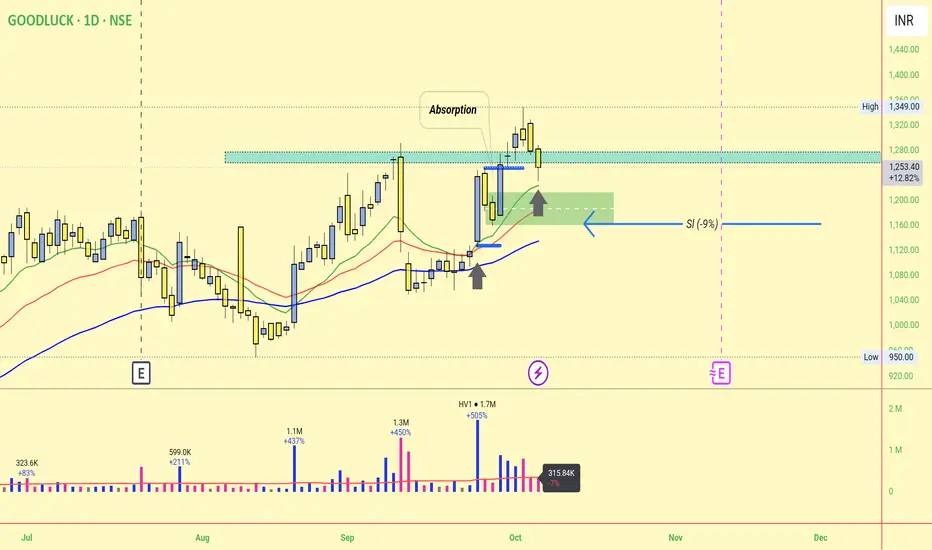
Goodluck swing500% big volume after price fall and quickly recover , now look like maybe sustain and move upside,
Here i just look
Huge volume
But price move , after profit booking, then fast way recovery.
And some News for affect in short to midium term
Sbi mutual fund bought that time , and some defences news
Indraprastha Medical (D) - Bullish Breakout or Bearish Reversal?Indraprastha Medical Co. is at a critical juncture, presenting conflicting signals that warrant close attention. While the long-term trend remains bullish, emerging patterns suggest a potential reversal.
The Bullish Case: Strong Momentum
The stock has been in a consistent uptrend since July 2023, followed by a period of sideways consolidation that began in October 2024. Today's session was notably strong:
- New All-Time High: The stock registered a new all-time high, with the closing price being the same as the high of the day. This indicates intense buying pressure and an absence of selling at the peak.
- Massive Volume: The breakout was supported by exceptionally high trading volume, adding conviction to the upward move.
- Indicator Alignment: Key momentum indicators are bullish across multiple timeframes (Monthly, Weekly, and Daily). The short-term Exponential Moving Averages (EMAs) are in a positive crossover state, and the Relative Strength Index (RSI) is rising, confirming the underlying strength.
If this bullish momentum is sustained and the stock decisively breaks out from the current resistance zone, the next potential target is the ₹760 level.
The Bearish Counterargument: Divergence and Reversal Pattern
Despite the bullish price action, there are significant warning signs:
- Potential Double-Top: Today's new high has formed a potential Double-Top pattern on the Monthly, Weekly, and Daily charts. This is a classic bearish reversal pattern that can signal a market peak.
- Bearish Divergence: Crucially, this pattern is accompanied by a bearish divergence in the RSI. While the price made a new high, the RSI failed to do so, suggesting that the momentum behind the rally is weakening.
If the breakout fails and this bearish pattern plays out, the stock could see a significant correction, with a potential downside support level at ₹385 .
Conclusion and Outlook
The current technical landscape is ambiguous. We have a powerful breakout candle on high volume conflicting with a classic bearish reversal pattern and weakening momentum.
The immediate price action in the upcoming days is critical. Traders should wait for confirmation . A sustained move above today's high would validate the bullish case, while a failure to hold these levels and a subsequent breakdown would give credence to the bearish scenario.

All The Target DoneHere's a breakdown of what the chart shows and why "target done" is applicable:
• The Movement: The chart displays a significant V-shaped recovery and surge starting around September 27th or 28th and continuing up to the current date (October 4th).
• The Target Area: The large green shaded box highlights the upward trajectory and covers the area where the price has been moving. The upper limit of this green box and the price levels around the $122,000 to $123,000 mark appear to be the region of the achieved target.
• Current Price Action: The current price is displayed as $122,506.9, which is at the upper end of the recent upward movement and well into the highlighted green zone.
• Inferred Trading Context: In a trading context, it suggests that a long (buy) position was likely entered near the bottom of the V-shape, perhaps around the $110,000 to $112,000 area, with a profit target set near the current price level. Since the price has reached or exceeded that upper range, the objective has been met, hence "target done."
In short, the chart clearly illustrates a successful, powerful move to the upside, indicating that the profit goal (target) for that particular trade setup has been achieved (done).

INDNIPPON (D) - Hits New All-Time High After Dual BreakoutIndia Nippon Electricals has demonstrated exceptional bullish momentum, surging to a new All-Time High (ATH) yesterday with a powerful +11.24% gain on the back of massive trading volume.
This price surge follows two significant technical breakouts in September 2025:
1. A breakout from a prolonged consolidation phase that had been in place since January 2024.
2. A breakout from a very long-term angular resistance trendline that dated back to January 2020.
Since breaking out of consolidation last month, the stock has already gained over 24%.
Comprehensive Bullish Confirmation 👍
The upward move is strongly supported by a confluence of positive indicators across multiple timeframes:
- Broad-Based Strength: Short-term Exponential Moving Averages (EMAs) are in a bullish crossover state across the monthly, weekly, and daily charts .
- Confirmed Momentum: The Relative Strength Index (RSI) also shows a bullish crossover on the monthly and weekly charts, while the daily RSI is on the verge of confirming the same.
- Volume Trend: There has been a consistent increase in overall trading volume , indicating growing and sustained buyer interest.
Outlook and Key Levels
Given the rapid and significant price appreciation, a short-term pullback or consolidation would be a healthy technical development. A potential retest of the recent breakout level could offer a lower-risk entry point for new positions ("buy on dips").
- Bullish Case 📈: If the current momentum is sustained, the next potential price target on the upside is ₹1,118 .
- Bearish Case 📉: If the momentum is not sustained and a correction occurs, the stock could find support near the ₹900 level.

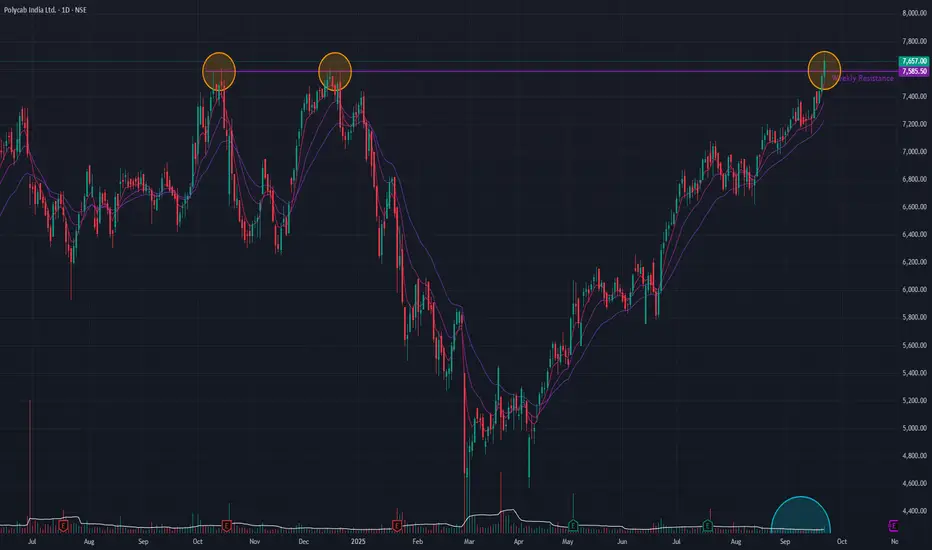
Polycab (Daily) - Reaches New ATH with Decisive BreakoutPolycab has demonstrated exceptional strength, achieving a new All-Time High (ATH) today. The stock decisively broke out of a significant long-term horizontal resistance level , a move that was confirmed by a healthy surge in trading volume.
This breakout is the latest milestone in a powerful rally that began from a Double-Bottom pattern in April 2025 . Since that point, the stock has surged over 65% to date.
Broad-Based Bullish Confirmation 👍
The bullish momentum is confirmed across multiple indicators and timeframes:
- Sustained Volume: Trading volume has remained consistently around the average in the recent past, indicating steady accumulation and persistent buyer interest.
- Daily Momentum: On the daily chart, both the short-term Exponential Moving Averages (EMAs) and the Relative Strength Index (RSI) are in a strong bullish crossover state.
- Weekly Strength: This positive sentiment is echoed on the weekly timeframe , where the EMAs and RSI also confirm a powerful bullish momentum, suggesting strength on a larger scale.
Outlook: Monitoring for Confirmation
Overall, Polycab is in a clear and powerful bullish trend. A common post-breakout behavior could involve the stock retesting the previous resistance level as new support .
The price action in the coming days will be crucial to watch. A successful retest would confirm the breakout's strength and suggest a continuation of the upward trend. Therefore, observing this near-term price action is vital before making any further decisions.
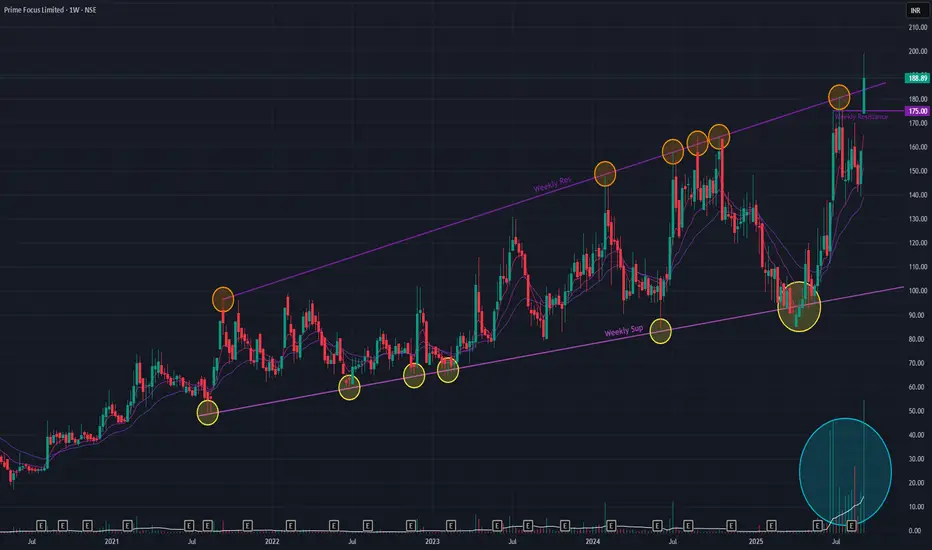
Prime Focus (Weekly Timeframe) - Will the momentum continue ?Prime Focus is exhibiting exceptional strength, building upon a remarkable long-term uptrend. Since May 2020, the stock has delivered a staggering 1,019% return. Recent price action suggests this rally is not only continuing but potentially accelerating.
## Key Bullish Developments 📈
Dual Resistance Breakout: Last week, the stock decisively broke through two critical levels: a short-term resistance trendline and, more importantly, a significant long-term angular resistance. This signals the resolution of a major consolidation phase in favor of the bulls.
Volume Confirmation: The breakout was validated by exceptionally high trading volume , indicating strong institutional interest and conviction behind the move, which culminated in a +19.27% surge for the week.
Technical Strength: The short-term Exponential Moving Averages (EMAs) are in a Positive Crossover (PCO) state, a classic bullish sign of underlying momentum. Furthermore, the stock has consistently respected its long-term support trendline throughout its multi-year advance.
## Outlook and Strategy
While the breakout is decisively bullish, a minor pullback or consolidation in the short term would be healthy due to potential profit-booking after such a sharp rally.
Overall, the powerful breakout on massive volume suggests that Prime Focus has entered a new phase of its uptrend. The stock is now well-positioned to challenge its previous All-Time Highs (ATHs) in the near future.
Watch the coming week's price-action !!
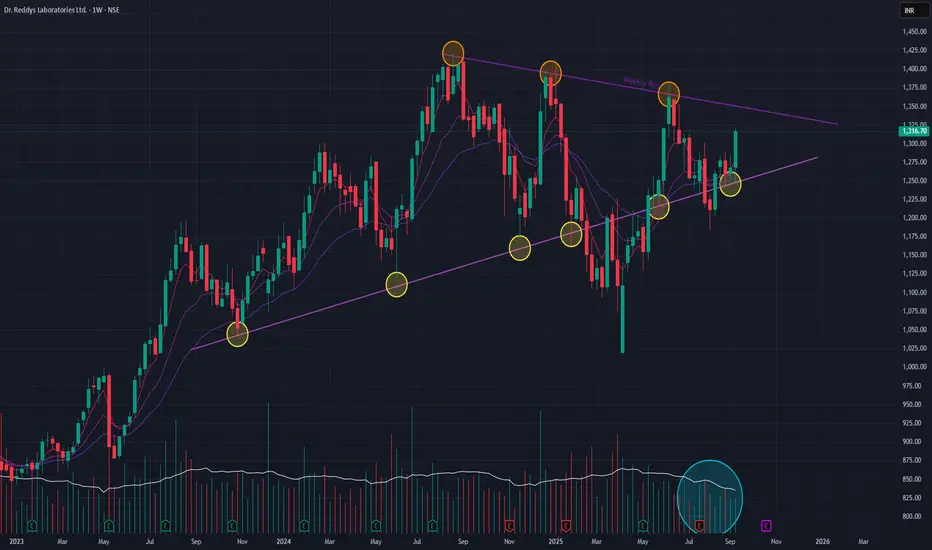
Dr. Reddy's (Weekly Timeframe) - Potential BreakOut?Dr. Reddy's Laboratories is currently in a phase of strategic consolidation. After a remarkable 93.63% uptrend that began in March 2022, the stock has settled into a well-defined triangle formation since August 2024. This pattern suggests a temporary equilibrium between buyers and sellers as the market digests previous gains.
The technical underpinnings remain constructive. The Positive Crossover (PCO) in the short-term EMAs provides a bullish undercurrent, and the resilience of key support levels indicates a solid foundation. The primary scenario we are monitoring is for a bullish continuation.
The key catalyst for the next leg up will be a volume-supported breakout above the triangle's resistance. Such a move would signal the end of the consolidation phase and could propel the stock towards retesting its All-Time High (ATH) . Investors should, however, remain watchful of the trading volume, as it will be the ultimate arbiter of the breakout's validity.
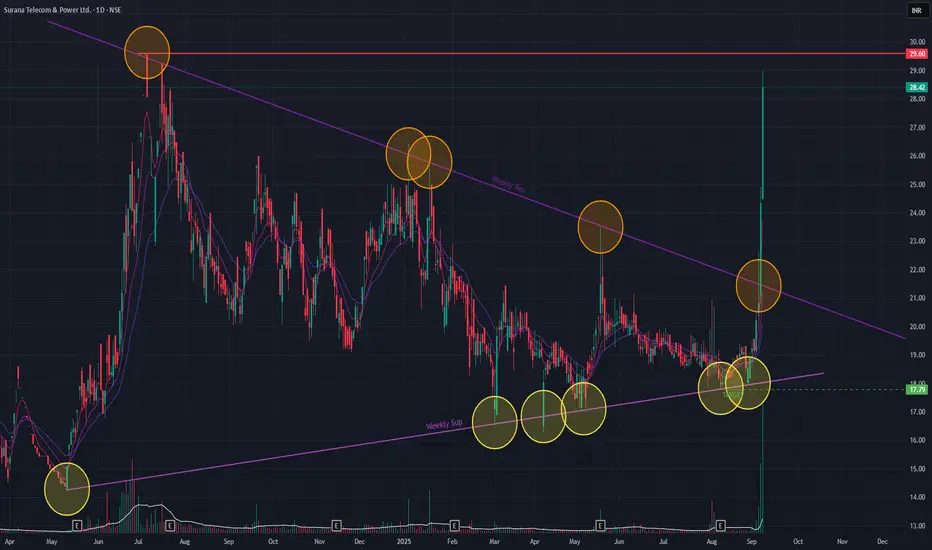
Surana T&P (Daily Timeframe) - Will it make new ATH?Surana has formed a Triangle formation which it Broke-Out last week confirming a bullish momentum. Short-term EMAs are in a PCO state. Today the stock opened Gap-up and formed a strong bullish candle (16.86%) with huge volume. A Golden Cross-over in both EMAs and DMAs may form in the coming days, which is a bullish signal, confirming the momentum.
On upside the stock may reach 37 levels if the momentum continues. If the stock is unable to sustain momentum, then we may see the levels of 17 on the downside.
Price-action is what we need to keep monitoring!!
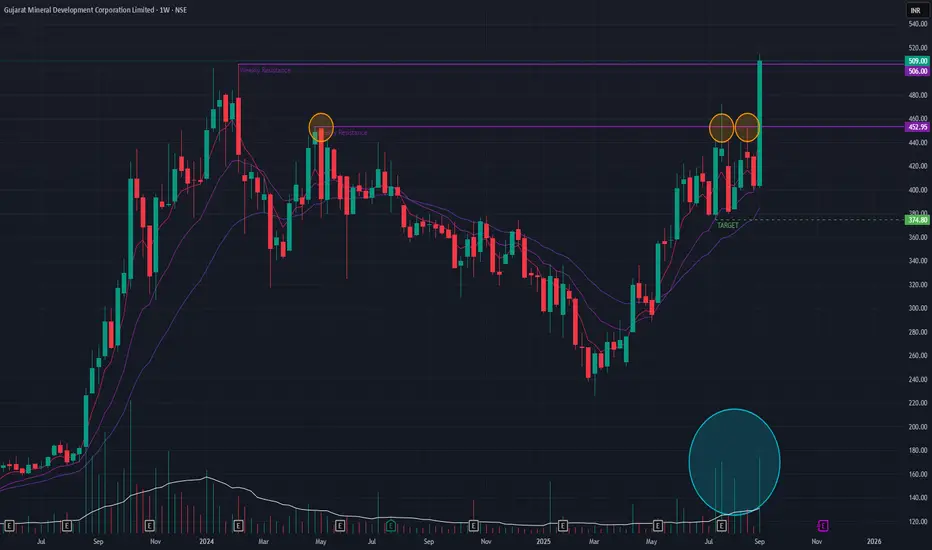
GMDC (Weekly Timeframe) - What next after ATHGMDC was in a short-term downtrend which reversed into an uptrend by Mar 2025. Past few weeks it tried to BreakOut of the horizontal key resistance trendline as indicated. Last week the stock surged by 26.04% with huge volume and made a new ATH. What can we expect after the new ATH, I would expect some profit booking in the coming week.
If the momentum sustains then we may see the stock surge to 640 levels on the upside. On downside, we may see 374 levels. All depending on the coming week's price-action.
To be watched !!
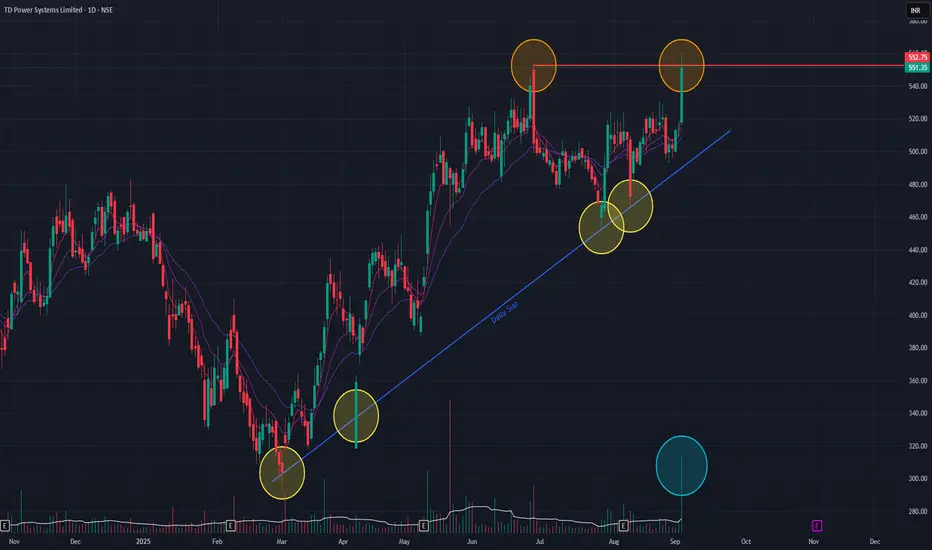
TD Power Systems (Daily Timeframe) - Can it make new ATH ??TD Power made a new All Time High today with huge volume. With that last bullish candle, on daily timeframe, we observe a Double-Top which is a bearish chart pattern. The angular support trendline has been respected as indicated. Short-term EMAs are in positive cross-over state, which is an obvious scenario during Double-Top formation.
We should observe how the price action plays out in the coming days to decide on the possible targets, both upside and downside.
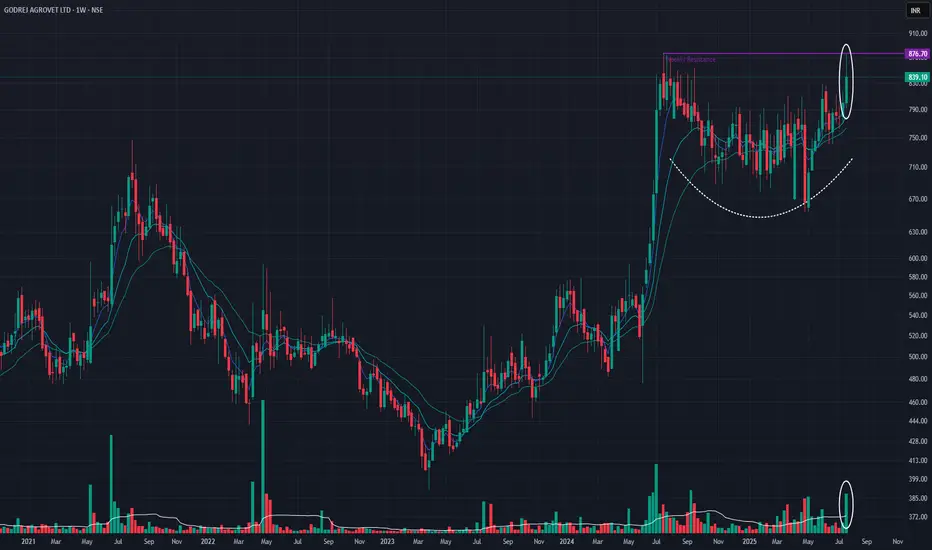
Godrej Agrovet Ltd (Weekly Timeframe) - Potential BreakoutSince the All Time High on Jul 15, 2024, the stock is in a Accumulation phase , and last week it tried to breach the ATH with Huge Volume . The stock may BreakOut of the Resistance Zone if Good Volume is available. If it is able to breach the resistance zone, then it may go to 1070 levels.
It is also possible that there could be some profit booking which means the stock could come down as well.
Keep monitoring.
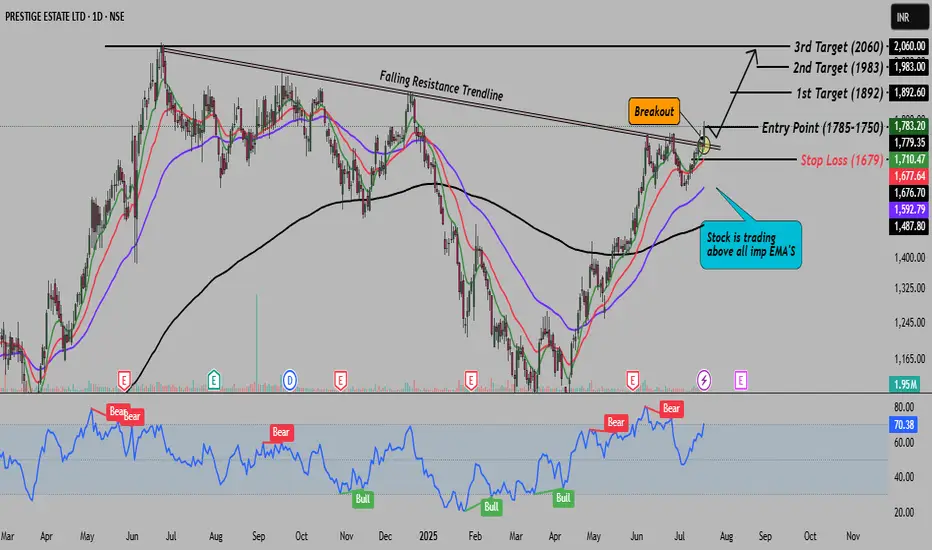
Prestige on breakout, this is ready to fly in blue sky!Hey Traders! Today, I’m sharing a stock that has broken out from a falling resistance trendline. This breakout sets the stage for a potential move towards its all-time high zone. It looks promising for both short-term and long-term trades. In my opinion, this could be a solid trade for the next few days.
Here’s what you need to know:
The stock has broken above a key falling resistance trendline.
This sets up a potential move towards the all-time high zone.
For better risk-reward, I suggest trading with smaller quantities.
Don’t forget to use the stop loss marked on the chart for risk management.
Please trade wisely and according to your own risk tolerance.
Disclaimer: This analysis is for educational purposes only. Always consult a financial advisor before making any investment decisions.