Is $MONAD Bullish? Technical Structure Suggests 10x PotentialPrice is Consolidating in a range-bound Structure Between Well-Defined Support and Resistance, indicating active Accumulation.
🟦 Demand Zone: $0.020–$0.022
🟥 Supply Zone: $0.025–$0.027
A Confirmed Breakout and close above Resistance Would signal a Bullish Structure Shift and Continuation of the Uptrend.
Trend Remains Bullish above $0.016, the recent swing low. A breakdown below invalidates the setup.
Based on Structure and Expansion Potential, 10x Upside is possible in a Strong Altseason.
Volatility remains High, Risk Management is Mandatory.
NFA & DYOR
Altcoin

$TWT at a Major Decision Zone | Accumulation or Distribution?CRYPTOCAP:TWT at a Major Decision Zone | Accumulation or Distribution?
CRYPTOCAP:TWT has been range-bound between $0.65 – $1.55 for nearly 3 years, signaling a long-term consolidation. This structure usually precedes a big directional move, the only question is which side breaks first.
Bullish Structure (Accumulation Case)
🔹 Primary accumulation zone: $0.92 – $0.72
🔹 Key condition: Price must hold above $0.70
🔹 If support holds Upside expansion targets: $2 → $5 → $10 (only after confirmed breakout)
Bearish Structure (Distribution Case)
🔹 $0.70 = critical long-term support
🔹 A clean breakdown below $0.70 confirms bearish market structure
🔹 Downside Targets: $0.20 – $0.10 (70–80% potential drawdown)
Key Technical Levels
Strong Resistance: $1.72
Major Support: $0.70
FVG / Demand Zone: $0.23 – $0.17
Technical Conclusion
CRYPTOCAP:TWT is compressing inside a multi-year range. No bias until breakout or breakdown.
Trade only confirmed setups, manage risk tightly, and let price decide the direction.
NFA & DYOR

$LINEA WARNING: Bearish Pressure + Accumulation Opportunity Ahea$LINEA WARNING: Bearish Pressure + Accumulation Opportunity Ahead!
Chart Analysis Recap:
Previous exit signal: $0.025 → #Linea is now ~50% down ✅ confirms chart-based strategy.
Current trend: Super bearish; expecting further downside 20%-40% before the next upward leg.
Long-Term Potential:
@Linea.eth could give 10x returns, targeting $0.1–$0.2, but success depends on smart entry points.
Key Strategy:
Ideal accumulation zone: below $0.01 for long-term holders.
Trade smart, enter on hard dips and manage risk.
Takeaway: Patience + technical discipline = positioning for potential massive upside.
NFa & DYOR

$TRUMP MEMECOIN: -98% DRAWDOWN ANALYSIS$TRUMP MEMECOIN: -98% DRAWDOWN ANALYSIS
TECHNICAL BREAKDOWN:
▶️ ATH Distribution: $70 (Exit signal executed)
▶️v Current Price Action: 98% retracement from peak
▶️ Market Structure: Parabolic blow-off → capitulation phase complete
▶️ Performance validates early exit thesis.
CURRENT MARKET STRUCTURE:
▶️ Bias: Bearish continuation
▶️ Key Resistance: $8.00 (structural pivot)
▶️ Invalidation Level: Sustained break above $8 with volume
▶️ Breakout scenario → $50 measured move target
▶️ Probability: Low (requires liquidity catalyst)
SPECULATIVE OPPORTUNITY (HIGH RISK):
▶️ Asset Class: Extreme volatility / lottery ticket
▶️ Entry Thesis: 92% discount from ATH = asymmetric R/R
▶️ Position Allocation: 1-2% max portfolio weight
▶️ Time Horizon: 12-24 month hold
▶️ Stop Loss: Total loss acceptable
▶️ This is binary outcome speculation, not investing.
INSTITUTIONAL PERSPECTIVE:
▶️ Celebrity token = coordinated distribution to retail
▶️ Tokenomics favor insiders
▶️ Liquidity profile indicates exit event completed
▶️ Capital preservation >> speculative moonshots
Risk Disclosure: Speculative asset. Trade accordingly.
⚠️ NOTE: Never invest hard-earned money in celebrity/influencer tokens. These are engineered liquidity extraction schemes, not legitimate projects.
Capital preservation > moonshot gambling.
NFa & DYOR

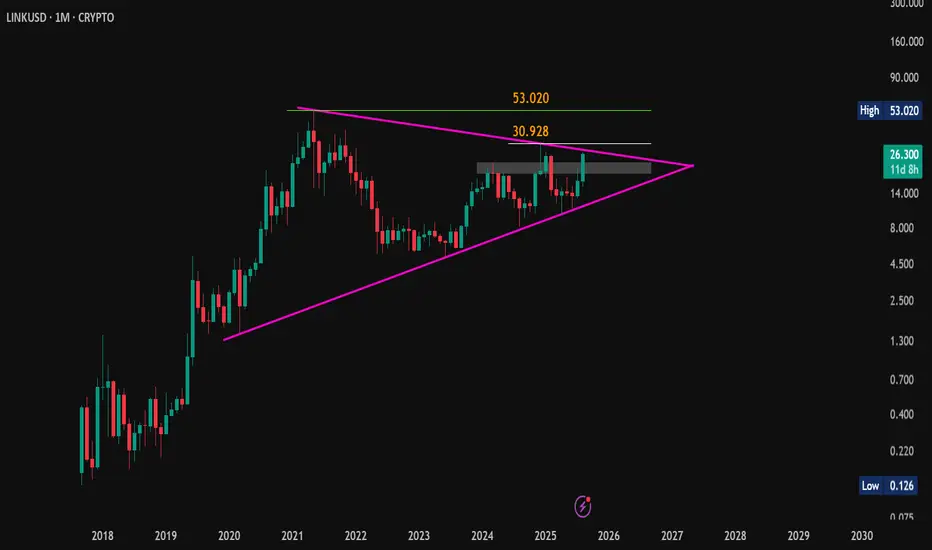
LINKUSD: Symmetrical Triangle Signals Possible Breakout#LINKUSD – Technical Analysis
CMP: $26.30
Chart Pattern: Symmetrical Triangle
Key Observations:
LINKUSD is currently trading within a symmetrical triangle formation, indicating a phase of consolidation. A breakout from this pattern may potentially lead to directional movement, depending on volume and broader market conditions.
Support Levels:
Immediate Support Zone: $22.87 – $19.29
Strong Support (long-term): $10.11
Upside Reference Levels (Post Breakout):
Potential resistance or price reference levels to watch on the upside:
$30.90
$53.00
$92.00
$110.00
$125.00
$145.00
Extreme bullish scenario: $250+
Disclaimer:
This post is for educational purposes only and does not constitute investment advice. Crypto assets are subject to high market risk and volatility. Please #DYOR before making any investment decisions.
#Crypto | #LinkUSD | #LINK | #TechnicalAnalysis | #ChartPatterns | #SymmetricalTriangle | #Altcoins | #Cryptocurrency | #PriceAction | #CryptoMarket | #CryptoCharting
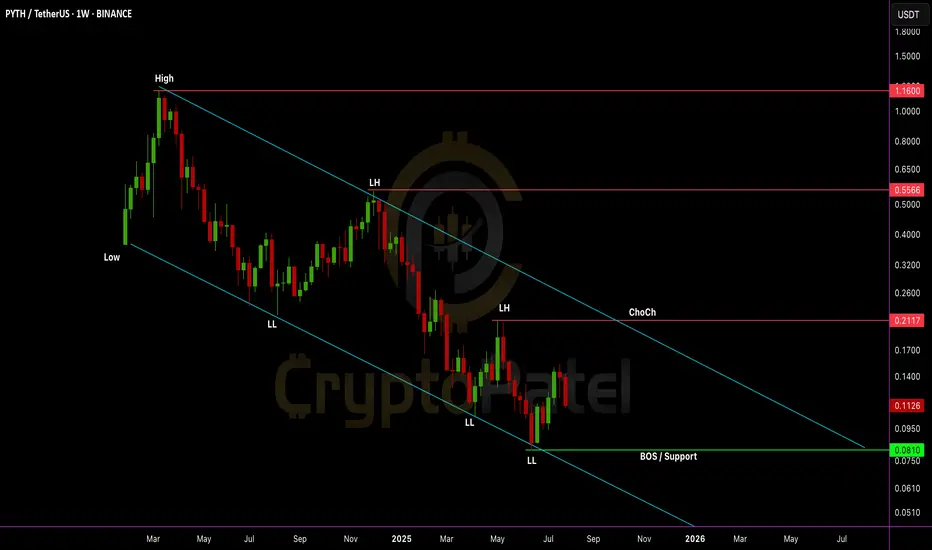
Will $PYTH go to $1 or drop even lower?Will EURONEXT:PYTH go to $1 or drop even lower?
Chart is still bearish with LL + LH structure.
But $0.0810 is a key level. If it holds, a trend reversal is possible. Accumulation zone: $0.085–$0.110
Risky entry, but R:R is huge. Hold = 10x potential to $1+
Break below $0.0810 = new LL incoming.
NFA & DYOR
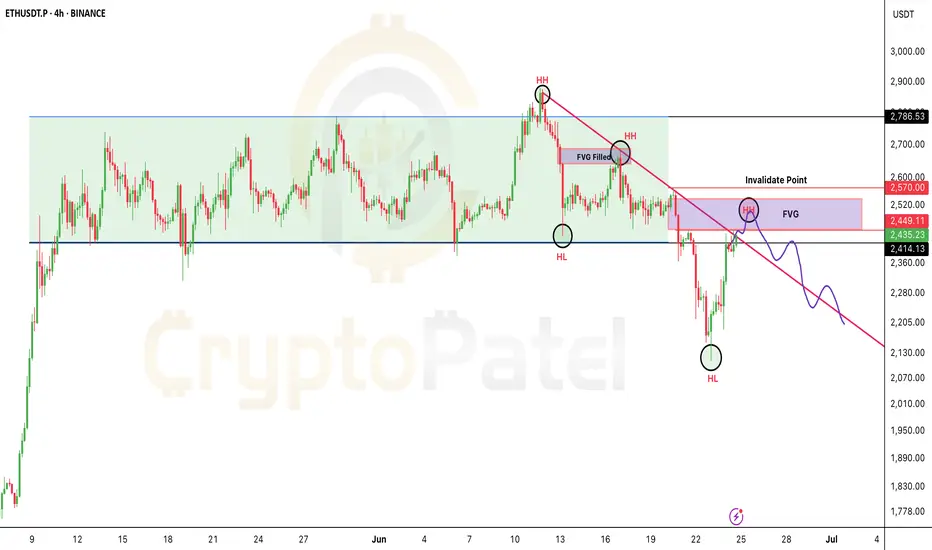
If you're shorting Ethereum, watch $2570 closely.If you're shorting Ethereum, watch $2570 closely.
If a candle closes above $2570, that invalidates the short — time to exit.
Why?
Because above this level, the risk/reward flips against you.
Better to wait for a cleaner entry with less risk, more reward.
Target: $2000
Retweet if this helps your trade plan.
NFA & DYOR
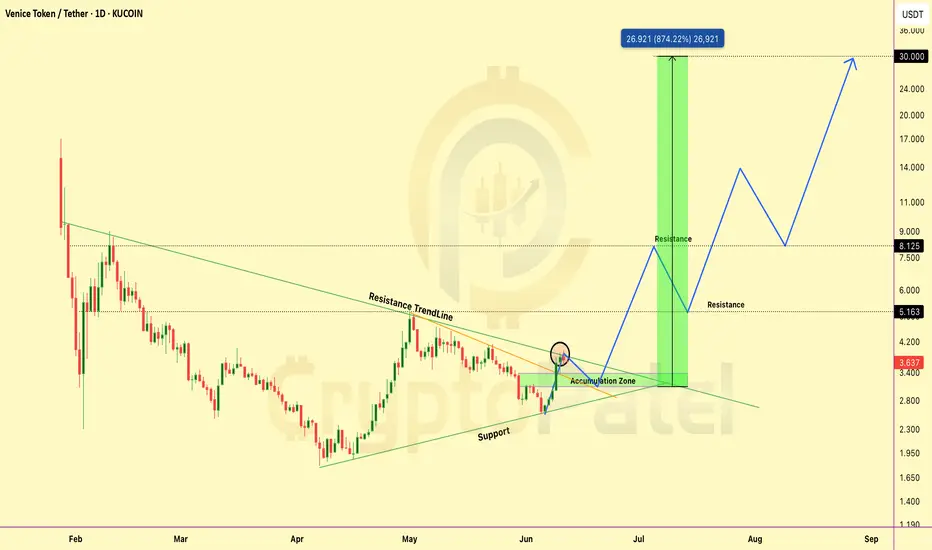
Is VVV The Next 10x RWA Play? Breakout + Strong Fundamentals!VVV is starting to show one of the strongest setups on my radar right now.
Here’s why this could turn into a major long-term bullish play 👇
Technical Picture:
✅ Broke LTF (lower time frame) resistance trendline
✅ Now attempting to break HTF (higher time frame) resistance trendline
✅ Accumulation Zone: $3.40–$3
✅ Strong Support: ~$2.70
👉 If HTF breakout confirms → serious upside could follow.
My Long-Term Targets:
$5 → $10 → $20 → $30 🚀
Why VVV Is Bullish Fundamentally:
✅ Real-world utility → tokenized luxury + travel ecosystem
✅ Strong partnerships → hotels, luxury brands, travel services
✅ Scarce supply + clear token utility (staking, discounts, access)
✅ Aligns with major Web3 + AI + RWA narratives → a trend driving this cycle
✅ Still low market cap → high asymmetry → early opportunity
Summary:
👉 If HTF breakout confirms, this could easily become one of the top runners this year.
👉 Narrative + chart + fundamentals are all lining up perfectly.
🎯 Strategy: Accumulate within the zone, watch for breakout confirmation → hold for long-term targets.
👉 Keep this one on your radar.
Note: NFA & DYOR
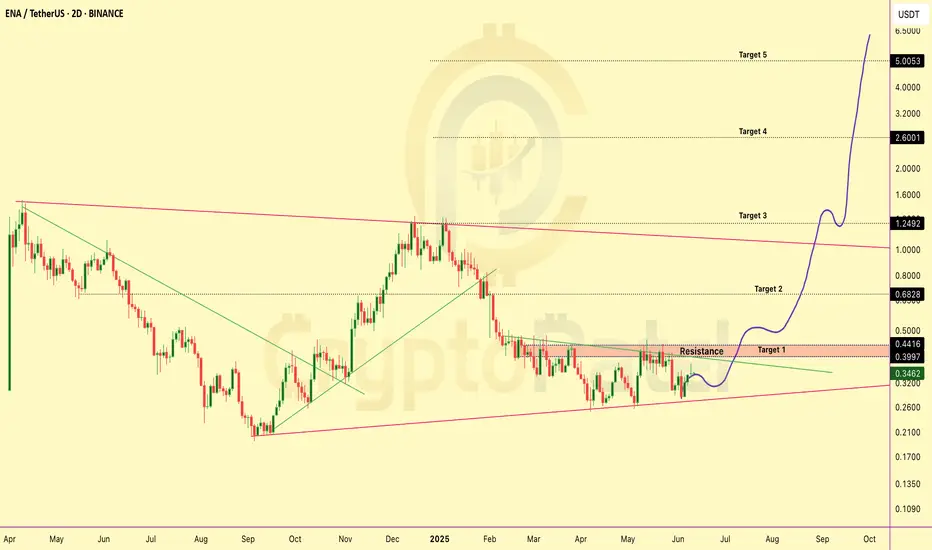
ENA/USDT Chart Analysis — Is It the Right Time To Accumulate?ENA/USDT Chart Analysis — Is It the Right Time To Accumulate?
MIL:ENA is still trading nearly -77% below its all-time high (ATH) of $1.52, currently hovering around $0.34.
Right now, the price is sitting above a strong support zone near $0.27, making the current range of $0.34–$0.30 an attractive accumulation zone — especially for long-term investors.
Short & Long-Term Targets:
Short-Term Targets: $0.44 → $0.68 → $1.25
Long-Term Potential: $2.60 → $5+
Key Levels To Watch:
Major Resistance: $0.45 — a breakout above this level could pave the way toward the $1 zone.
Strong Support: $0.27 — holding this level is critical to maintain bullish momentum.
Risk Note: As always, this is the crypto market — highly volatile and inherently risky. Please do your own research and manage risk wisely. This is NOT financial advice.
👉 Will ENA deliver another big leg up? Let us know your thoughts!
Note: NFA & DYOR
Is $WLD the Next 10x Altcoin This Bull Run? Is MIL:WLD the Next 10x Altcoin This Bull Run? 🚀
Based on the chart, this looks like a good time to start accumulating.
👉 My zone: $1.21–$1.00
👉 Bull target this cycle: $10
Strong bullish structure above $0.60 — but don’t forget: risk management is key.
#Altcoin #Worldcoin

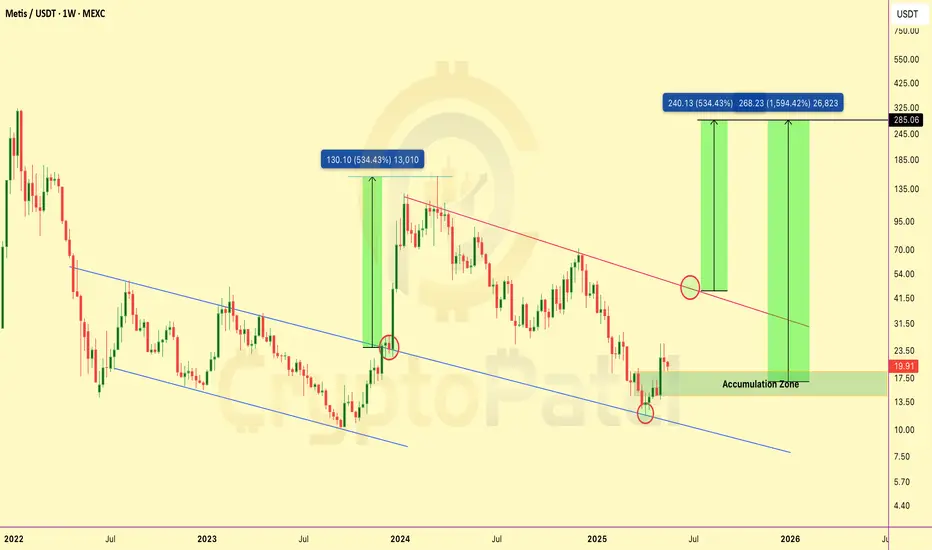
This Hidden Gem Could 10x–20x — Why I’m Buying $METIS Now!This Hidden Gem Could 10x–20x — Why I’m Buying SEED_DONKEYDAN_MARKET_CAP:METIS Now! 🚀
SEED_DONKEYDAN_MARKET_CAP:METIS Long-Term Accumulation Plan
SEED_DONKEYDAN_MARKET_CAP:METIS is showing strong long-term potential — I’m starting to buy small amounts now and planning heavier buys in the accumulation zone between $19–$14.
If price holds above $14, we could see a major rally ahead with potential 10x–20x returns.
Long-Term Targets: $50 / $100 / $150 / $200 / $250 / $300
Why I’m Bullish on SEED_DONKEYDAN_MARKET_CAP:METIS :
• Ethereum Layer-2 Rollup focused on decentralization
• Plans to decentralize its sequencer for more security
• Backed by a $100M Ecosystem Fund to attract developers
• Co-founded by Vitalik Buterin’s mother, Natalia Ameline
• Gaining momentum from recent ecosystem news
Reminder: Crypto is highly volatile — always use proper risk management and understand the risk/reward.
📌 Not financial advice — Do your own research.
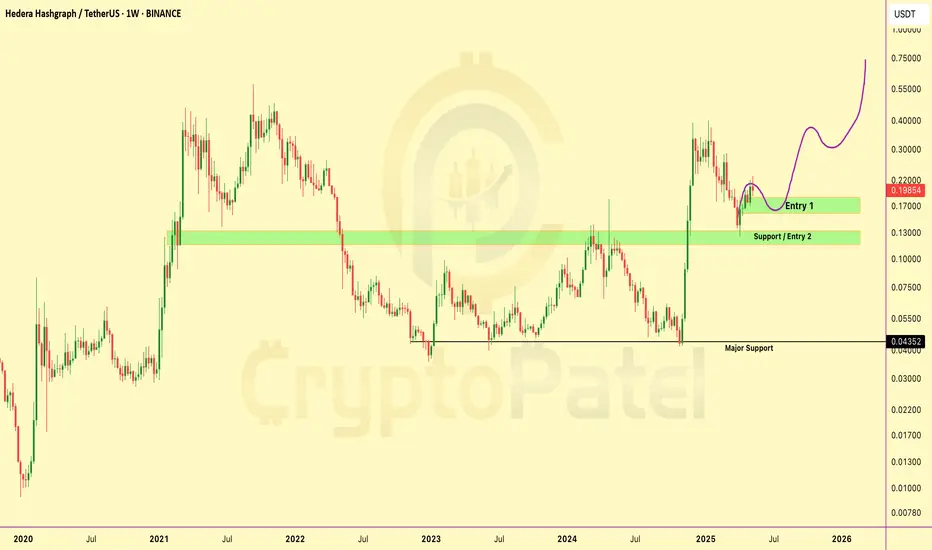
HBAR/USDT Chart Analysis and Price ProjectionMassive CRYPTOCAP:HBAR Rally Loading – Only If This Zone Holds!
Price is holding the critical support at $0.130 — a confirmed base here could trigger a major upside move toward $0.50–$1 🚀
▶️ Accumulation Zone: $0.180–$0.160
▶️ Invalid below $0.124
▶️ Above = ultra bullish structure in play!
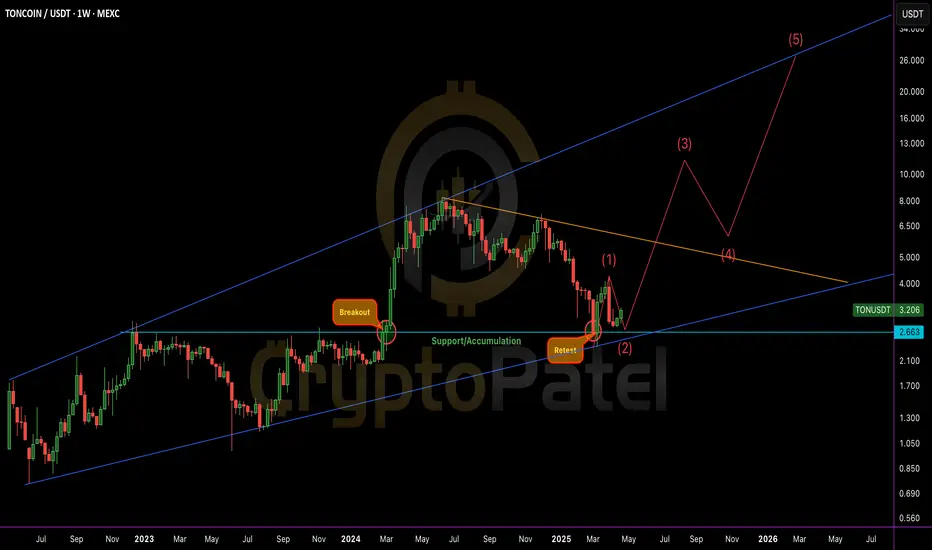
Accumulation Done. Retest Passed. Next: Moon Mode Activated!Accumulation Done. Retest Passed. Next: Moon Mode Activated! 🚀
#TONCOIN is shaping up beautifully! Here’s the full breakdown:
🔹 Breakout & Retest:
TON broke out of a major channel resistance last year around $2.66, followed by a clean retest at the same zone — confirming strong Support and Accumulation.
🔹 Current Structure:
After the successful retest at $2.66 (Support/Accumulation Zone), TON has started a fresh bullish structure.
Price is now building momentum above key dynamic trendlines.
🔹 Smart Money Concepts (SMC) Observation:
✅ Breaker Block (Accumulation Phase) confirmed at the $2.6–$2.7 zone.
✅ Classic Reclaim + Retest + Rally setup — typical Smart Money Accumulation behavior.
🔹 Inner Circle Trader (ICT) Concepts:
✅ Market Structure Shift (MSS) visible: from lower highs/lower lows ➔ shifting to higher highs and higher lows (bullish orderflow).
✅ Strong bullish Fair Value Gap (FVG) likely forming if TON pushes beyond the next local resistance (~$4).
🔹 Elliott Wave Theory Insight:
✅ Probable start of a 5-wave bullish impulsive move:
* Wave 1: Current push from retest zone.
* Wave 2: Minor correction expected.
* Wave 3: Parabolic rally (targeting $8–$10+).
* Wave 4 & 5: Following standard Elliott extensions.
🔹 Potential Targets (Mid to Long Term):
🎯 $5.00
🎯 $8.50
🎯 $13.00
🎯 $20-$50+ (in case of major altseason or BTC strength continuation)
🔹 Invalidation:
A confirmed weekly close below $2.30 would invalidate this bullish setup. Until then, dips are opportunities!
Summary:
TON looks primed for a major breakout continuation. Smart money seems to be accumulating heavily around the $2–$3 zone.
✅ Retest successful.
✅ Bullish structure confirmed.
✅ Massive upside potential.
🔔 Keep a close eye — TON might enter the "Next Big Move" phase soon!
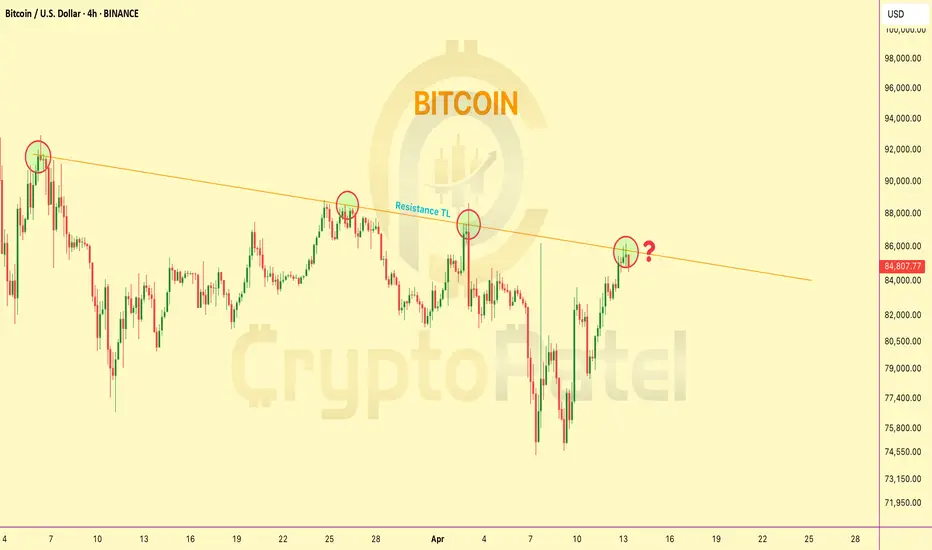
Bitcoin trading at Resistance level so What Next?🚨 Bitcoin 4H Chart Update
CRYPTOCAP:BTC is now trading right at the trendline resistance on the 4H chart
So what’s next?
1️⃣ Breakout and blast toward $100K?
2️⃣ Or another rejection down below $70K?
The decision point is HERE.
This breakout could change the game.
👇 Drop your thoughts –
Gold’s New All-Time High Could Be #Bitcoin Signal🚨 Gold’s New All-Time High Could Be #Bitcoin Signal 🟡
And if history repeats, Bitcoin could be next.
Every time #Gold moves first, Bitcoin usually follows with a major rally. If that happens again, we could see a new Bitcoin ATH in Q2-Q4 of 2025.
Are you ready for the next big move? 🚀
CRYPTOCAP:BTC #BullMarket

MEWUSDT - EYEING KEY LEVELS FOR A POTENTIAL DROP AHEADSymbol - MEWUSDT
MEWUSDT pair is currently in the distribution phase, testing a significant resistance and liquidity zone, where it has exhibited a false breakout. In light of the current market conditions, it is crucial to monitor several key levels, including both support and resistance.
A potential retest of the 0.00300 - 0.00312 range is likely, with the possibility of targeting another liquidity zone before MEWUSDT resumes its downward movement in alignment with the prevailing local and global market trends. These trends are characterized by a weakening Bitcoin and an overall sluggish cryptocurrency market.
Key Resistance Levels: 0.002793, 0.00300, 0.00312
Key Support Level: 0.002696
The primary support level at 0.002696 is critical, as it aims to prevent further market decline. Should the price fall below this level, there is a lack of significant support, potentially allowing for a strong move downward. A breakdown and sustained consolidation beneath the 0.002696 level could trigger a substantial impulse toward target zones around 0.00222 and 0.00200

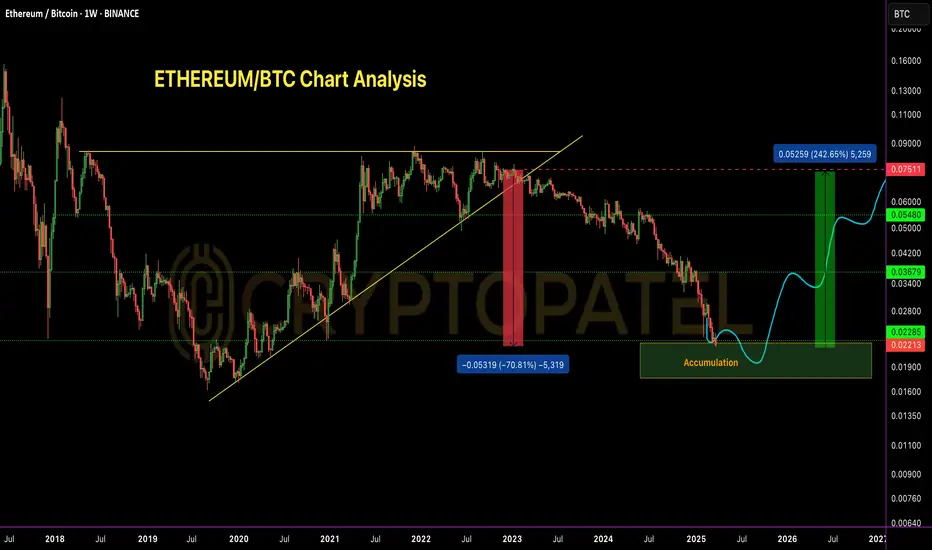
ETH/BTC – 70% Drop Achieved | Perfect Short ExecutionETH/BTC – 70% Drop Achieved | Perfect Short Execution
As projected in my analysis dated 10th Nov 2022, ETH/BTC has completed the anticipated 70% correction from the top.
Short Entry: 0.075 BTC ✅
TP1: 0.055 BTC – ✅
TP2: 0.037 BTC – ✅
TP3: 0.023 BTC – ✅
All targets achieved with precision.
Bearish structure played out as expected.
Current Outlook:
CRYPTOCAP:ETH Price has now entered a historical demand zone, coinciding with major multi-year support levels.
Accumulation Phase Activated –
Starting to scale into long positions from current levels, targeting mid-to-long term reversal setup.
Patience required – this could be the base of the next macro leg up.
Note: NFA & DYOR
#Ethereum
LAYERUSDT - TIME FOR REVERSAL?Symbol - LAYERUSDT
CMP - 1.4200
LAYERUSDT is currently exhibiting a consolidation phase within an ongoing uptrend. The asset is outperforming the broader market; however, the initial reaction to the significant resistance at 1.4200 may result in a false breakout, followed by a retracement towards 1.275 or the 0.5 Fibonacci level.
Since the start of the session, LAYERUSDT has surpassed its daily Average True Range (ATR). However, upon encountering resistance, the coin may lack the momentum required for sustained upward movement. Liquidity in the vicinity of the 1.4200 level could serve to restrict price action, hindering the asset’s ability to break through this barrier on the first attempt.
At present, Bitcoin is testing its trend resistance, which could potentially lead to a reversal or continuation of its current downtrend, influencing altcoin prices accordingly.
Resistance levels: 1.4200, 1.4900
Support levels: 1.2932, 1.2747
The outcome hinges on the price's response at the 1.400 level. A sharp and distributive approach, with a high probability, is expected to result in a false breakout and a correction towards the aforementioned support levels. However, should LAYERUSDT show signs of slowing down and consolidating near 1.4000, there could be an attempt at a breakout, with further price movement dependent on the outcome of that attempt.

$MONGUSDT massive weekly bullish divergenceMASSIVE WEEKLY BULLISH DIVERGENCE
something very big cooking on POLONIEX:MONGUSDT as weekly bullish divergence showing very big move incoming.. Things can get much more bullish than anyone ever thought possible.. Is $MONG gonna pull off 10,000X?!
DONT UNDERESTIMATE WEEKLY BULLISH DIVERGENCE

Polkadot (DOT) at Critical Support – What’s Next?Polkadot (DOT) at Critical Support – What’s Next?
📉 DOT is trading near strong support at $3.80–$3.60. If this level holds, we could see an upward move.
⚠️ Risk of liquidity grab: Price may dip below support to liquidate high-leverage positions before bouncing.
💡 Buy Strategy: Consider small entries now and place buy orders between $2.50–$2.00 for long-term gains.
📈 Altseason Target: If DOT follows the market uptrend, it could reach $40–$50 in the next cycle.
🔎 Key Levels:
✅ Above $3.60 – Bullish move likely
❌ Below $3.60 – Possible stop hunts before reversal
Are you buying DOT at these levels? Let’s discuss! 👇
#Polkadot #DOT #Crypto

BTC/USD TECHNICAL ANALYSIS – WHAT’S NEXT?📌 Timeframe: 2H
BTC/USD is currently trading within a symmetrical triangle pattern, signaling a phase of accumulation before a potential major breakout.
📈 TREND ANALYSIS & KEY PRICE LEVELS
1️⃣ Current Trend
BTC is trading around $86,301, moving within a narrowing price channel.
Price is caught between the ascending trendline support and the key resistance zone at $90,000 - $92,000.
A breakout above this zone could trigger a strong bullish move towards $98,000+.
Conversely, a failure to hold support may push BTC down to $82,764, with further downside potential towards $78,000 - $80,000.
2️⃣ Key Levels to Watch
🔺 Major Resistance Levels:
$90,000 - $92,000: Strong resistance; a breakout here could lead to a rally.
$98,000: The next target if BTC successfully breaks above resistance.
🔻 Major Support Levels:
$82,764: Closest support; a breakdown could trigger further downside.
$78,000 - $80,000: A strong demand zone that could provide a solid bounce if BTC dips further.
📉 POTENTIAL TRADING SCENARIOS
📌 Scenario 1 – Bullish Breakout 🟢
If BTC breaks above $90,000 - $92,000, it could confirm a bullish trend continuation toward $98,000+.
Watch for strong volume confirmation and a clear close above resistance.
📌 Scenario 2 – Bearish Rejection 🔴
If BTC fails to break $90,000 - $92,000, it could retrace to $82,764.
A further break below this level could send BTC down to $78,000 - $80,000 before finding strong support.
⏳ CONCLUSION – PREPARE FOR A BIG MOVE!
📊 BTC is in a critical accumulation phase, setting up for a major breakout soon.
📈 If BTC clears $90,000 resistance, the bullish trend will likely continue toward $98,000+.
📉 If BTC rejects and drops below $82,764, a deeper correction to $78,000 is possible.
⚠ Traders should wait for a clear breakout signal & manage risk carefully ahead of the big move!
📢 Do you think BTC will break out or correct further? Share your thoughts below! 🚀🔥

$MONGUSDT READY FOR MEGA THIRD WAVE POLONIEX:MONGUSDT LOOKING JUICY after completing WXYXZ CORRECTIVE AND LOOKING FOR MEGA THIRD WAVE Easy 1000-10000x on the cards ....MEMECOIN TO THE MOOONN

Bitcoin 2H SMC Chart Analysis: Bearish Outlook Bitcoin 2H Chart Analysis: Bearish Outlook
Currently, Bitcoin is forming a Lower Low (LL) and Lower High (LH) pattern, signaling a potential bearish trend in the short-term. Key support levels to watch are around $88,000 and $85,000.
📉 Next Targets: $88,000 → $85,000
🚫 Critical Level: A 2H close above $101,000 would invalidate this bearish outlook.
Note: If Bitcoin holds below $100,000, expect a possible decline to $85,000.
Remember, always set your stop losses to protect your funds in case the trend shifts.
