Bitcoin bearish scenario updateCRYPTOCAP:BTC Update
#Bitcoin is still trading below the key $93K–$94K resistance, so my bearish bias remains unchanged.
As long as price stays below this HTF bearish OB, I’m expecting continuation toward $75,000.
❌ This Bearish scenario only invalidates if we get a strong HTF close above $94,000.
Until then: rallies = selling pressure. Stay disciplined & manage risk.
NFA & DYOR
ALTS

$VELO IS ONE OF THE MOST MISPRICED TOKENS IN CRYPTONASDAQ:VELO IS ONE OF THE MOST MISPRICED TOKENS IN CRYPTO
$120M mcap.
BlackRock-backed stablecoin.
1M+ real users.
Backed by CP Group (7-Eleven Thailand) + Stellar.
Down 99.7% from ATH while building real PayFi rails in SE Asia’s $396B Cross-Border Market.
IEO: $0.05 → ATH: $2.07 (40x)
Now at $0.0067 🤯
High inflation? Yes.
High risk? Absolutely.
If RWA + PayFi runs and a Binance Main Listing Lands… This Won’t Stay at $120M.
⚠️ Disclaimer: Not financial advice. Do your own research. Crypto is volatile & You Can Lose Everything.

Everyone Asking Why $PIPPIN Did a 30x in a Few Days Is Already LEveryone Asking Why CRYPTOCAP:PIPPIN Did a 30x in a Few Days Is Already Late (Read Before You Trade)
CRYPTOCAP:PIPPIN did not rally 30x because of innovation.
It rallied because market structure allowed it to.
No presale.
No venture capital.
No team allocation.
From Pump.fun to $300M+ market cap in days.
Here is the reality 👇
1️⃣ Separate narrative from mechanics
Markets do not move on stories.
They move on liquidity, positioning, and leverage.
CRYPTOCAP:PIPPIN ’s move was structural, not fundamental.
Anyone telling you otherwise is selling a narrative.
2️⃣ Launch mechanics defined tradability
CRYPTOCAP:PIPPIN launched on Pump.fun via a fair-launch bonding curve.
🔹 No private allocations
🔹 No insider inventory
🔹 Uniform market access
This removed early insider dumping,
It did not remove downside risk.
3️⃣ Tokenomics were neutral, not bullish
▪️ 1B fixed supply
▪️ 100% circulating
▪️ No future unlocks
▪️ No inflation
Clean structure reduces uncertainty.
It does not create demand.
Demand came from positioning, not supply math.
4️⃣ AI credibility acted as a filter, not a driver
Association with BabyAGI’s creator improved narrative quality.
It did not justify valuation.
It lowered skepticism.
Narratives don’t need depth,
They need acceptance and distribution.
5️⃣ Pre-breakout behavior followed a known pattern
Before expansion, we observed:
🔸 Tight consolidation
🔸 Low public attention
🔸 Increasing large-wallet activity
This is where asymmetric risk is formed.
Retail reacts later.
6️⃣ Expansion phase was mechanical
Once volume accelerated:
🔹 Leverage increased
🔹 Shorts were liquidated
🔹 Exchanges amplified liquidity
🔹 Momentum systems engaged
From this point, price discovery becomes reflexive.
7️⃣ Risk concentration is non-trivial
On-chain data indicates significant supply concentration.
A small group of wallets controls a meaningful share of float.
This introduces binary risk:
🔹 Support continuation
🔹 Or rapid distribution
Liquidity disappears faster than it appears.
8️⃣ This asset class demands precision
CRYPTOCAP:PIPPIN is best described as:
👉 A high-beta momentum instrument
👉 A narrative-driven liquidity event
It is not:
❌ A long-term investment vehicle
❌ A fundamentals-based AI allocation
❌ Capital-preservation oriented
Volatility is a feature, not a flaw.
9️⃣ Where participants fail
Most losses occur when traders confuse:
🔹 Narrative with valuation
🔹 Momentum with durability
🔹 Fair launch with safety
Markets punish conceptual errors quickly.
1️⃣0️⃣ Final assessment
CRYPTOCAP:PIPPIN is not a forecast.
It is a case study in modern crypto market behavior.
Success in this market comes from understanding:
👉 Structure
👉 Liquidity
👉 Timing
👉 Risk
Not belief.
This is a high-risk memecoin environment.
Position sizing and discipline are mandatory.
Follow for institutional-grade crypto analysis.
NFA & DYOR

HUMANITY +600% Setup or Full Breakdown?HUMANITY +600% Setup or Full Breakdown?
Trendline confluence + demand reaction
$H Price has tapped a well-respected ascending HTF trendline and printed a support reaction, maintaining bullish market structure.
Structure intact → higher low holding.
Targets: 0.143 → 0.387 (+627%)
Invalidation: Daily close < 0.046
Bias: Bullish while above trendline.
NFA & DYOR

$TAO Reset Complete? This One Level Decides the Next 5xGETTEX:TAO : High-Timeframe Technical Outlook
GETTEX:TAO has already delivered ~200% upside from earlier structure. From the recent swing high near $539, price has corrected ~50% and is now ~65% below ATH, A normal reset after an impulsive expansion.
Key Structure & Levels
Price is currently trading above the 0.618 Fibonacci retracement at ~$262, which is a critical HTF support.
As long as $262 (0.618 fib) holds on a daily/weekly closing basis, the structure remains bullish, with potential for continuation toward new ATH.
Downside Scenarios
If $262 fails, next major support lies at the 0.786 Fibonacci around ~$215, a historically strong reaction zone.
Bullish Order Block: $263 – $228
→ Confluence of fib support + demand zone = high-probability accumulation area.
Invalidation / Risk
A clean breakdown and acceptance below $228 would invalidate the current bullish structure.
In that case, probability increases for a deeper move, potentially sub-$100 in a worst-case market-wide risk-off scenario.
Strategy:
🔹 This is not a one-shot entry zone, It’s a slow accumulation range.
🔹 Risk-managed scaling is favored while price holds above the order block.
🔹 Momentum expansion during a confirmed alt-season opens upside targets in the $1,000 – $2,000 range over the full cycle.
🔹 HTF trend remains constructive above $262.
🔹 Volatility is part of cycle structure. Trade levels, not emotions.
🔹 Not financial advice. Technical structure based.

$TWT at a Major Decision Zone | Accumulation or Distribution?CRYPTOCAP:TWT at a Major Decision Zone | Accumulation or Distribution?
CRYPTOCAP:TWT has been range-bound between $0.65 – $1.55 for nearly 3 years, signaling a long-term consolidation. This structure usually precedes a big directional move, the only question is which side breaks first.
Bullish Structure (Accumulation Case)
🔹 Primary accumulation zone: $0.92 – $0.72
🔹 Key condition: Price must hold above $0.70
🔹 If support holds Upside expansion targets: $2 → $5 → $10 (only after confirmed breakout)
Bearish Structure (Distribution Case)
🔹 $0.70 = critical long-term support
🔹 A clean breakdown below $0.70 confirms bearish market structure
🔹 Downside Targets: $0.20 – $0.10 (70–80% potential drawdown)
Key Technical Levels
Strong Resistance: $1.72
Major Support: $0.70
FVG / Demand Zone: $0.23 – $0.17
Technical Conclusion
CRYPTOCAP:TWT is compressing inside a multi-year range. No bias until breakout or breakdown.
Trade only confirmed setups, manage risk tightly, and let price decide the direction.
NFA & DYOR

$BTC: Technical Breakdown (High-Probability Bearish Setup)CRYPTOCAP:BTC : Technical Breakdown (High-Probability Bearish Setup)
Market Structure Shift
Bitcoin has Already lost $107000 major bullish support and is sustaining below it, confirming a bearish market phase.
The Head & Shoulders distribution pattern is fully validated.
Head & Shoulders Measurement
As per classical H&S rules, the 162% extension target of the pattern has already been achieved on the downside, indicating:
🔹 Pattern completion
🔹 Cycle top likely formed
🔹 Transition from bull to bear phase
Fibonacci Retracement (Macro Bear Framework)
Measured from bear-market low → cycle top, Fibonacci levels project:
0.382 Fib: ~$56,700
0.5 Fib: ~$44,000 → key bear market acceptance zone
0.618 Fib: ~$35,000 → strongest macro support / worst-case scenario
Current price action still reflects a healthy macro retracement, not capitulation.
Liquidity & Imbalance
Despite the bearish structure, a Fair Value Gap (FVG) remains unmitigated in the $98,000–$100,000 range.
This level may act as a liquidity magnet before the next impulsive leg down.
Bias & Scenarios
Primary bias: Bearish
Relief rally possibility: $98K–$100K (FVG fill)
Next downside leg: $70K–$60K, then deeper Fib supports
Conclusion
With H&S 162% target completed and structure broken, BTC remains bearish by technical definition.
Trade only with confirmation, manage risk, and respect all valid scenarios.
NFa & DYOR

$LUNA Finally Catching a breath After Brutal Red Days VIE:LUNA Finally Catching a breath After Brutal Red Days 😮💨
From Bloodbath to Bounce:
🔴 -99.88% massacre (RIP portfolios)
🟢 Now +286% relief at $0.23 From $0.06415 within 21 Days
▶️Major Downtrend line overhead
Major resistance at $0.30-0.38 ahead.
Potential bottom formation or dead cat bounce?
Recovery or bull trap? Time will tell 🤔
EXTREMELY HIGH RISK asset - trade with caution
Not financial advice | DYOR

$BONK Technical Analysis Update by CryptopatelSIX:BONK Technical Analysis Update by Cryptopatel
Current Structure:
SIX:BONK has broken key support at $0.00001 and is currently retesting the level.
Red zone: $0.000010 – $0.00001125.
Price below this zone = bearish, high probability of testing Bullish Order Block between $0.00000450 – $0.00000350, which is the prime accumulation area.
Retracement Outlook:
If SIX:BONK fails to reclaim $0.00001, expect 50%–70% retracement in the next few weeks.
Bullish Flip:
Key breakout required: $0.00001250.
Closing above this Red box signals super bullish momentum, potential 200%–400% upside.
Trade Watch:
Red zone $0.000010–$0.00001125 = critical level to enter trades.
Monitor price reaction at Bullish Order Block for optimal accumulation.
Summary:
Below $0.00001 → Bearish / accumulation phase
Above $0.00001250 → Super bullish breakout
TA Edge: Discipline on zones + clear breakout confirmation = key to maximizing gains.
NFA & DYOR

$BNB: Key HTF Decision Zone AheadCRYPTOCAP:BNB : Key HTF Decision Zone Ahead
#BNB is still holding above the critical $700–$550 demand zone, the same area that defines the continuation or breakdown of the current macro trend. As long as price maintains this support, HTF structure stays bullish and the next expansion wave targets $1500 → $2000 → $2500 → $3000.
A weekly close below $550 would flip structure bearish and open a deeper correction toward $250–$170.
Key Levels
Accumulation Zone: $700–$550
Upside Targets: $1500 / $2000 / $2500 / $3000
Invalidation: Weekly close < $550
BNB is at a major decision point: Hold the zone and bullish momentum accelerates; lose it and trend resets.
NFA & DYOR

RENDER will hit $15?CRYPTOCAP:RENDER Technical Update
Price is in a bearish corrective phase and currently reacting at the 0.618 Fib zone ($1.55–$1.25), A key area for potential bullish reversal. Holding this zone increases the probability of a strong upside continuation toward $4.6 / $8 / $13 / $20.
If this support breaks, the next major demand lies at the 0.786 Fib level (~$0.84), considered the optimal accumulation zone before any trend shift.
Key Zones:
0.618 Support: $1.55–$1.25
0.786 Support: $0.84
Targets: $4.6 / $8 / $13 / $20
NFA Always DYOR

$SHIB HOLDERS: READ THIS BEFORE THE NEXT MOVE!CRYPTOCAP:SHIB HOLDERS: READ THIS BEFORE THE NEXT MOVE!
Shiba Inu is approaching one of the strongest historical support zones in its entire chart history… and every previous touch has triggered a massive impulsive rally.
Current Positioning
SHIB is trading ~91% below its ATH and ~82% below last year’s high, compressing into a major long-term support demand block at:
Strong Support Zone: $0.0000080 – $0.0000060
This level has acted as a multi-cycle accumulation range and has repeatedly generated explosive upside moves.
Historical Reaction From This Support Zone:
🟩 Aug 2021: Price tapped the zone → +1200% breakout within days
🟩 Jun 2022: Retest → +145% rally
🟩 Oct 2023: Retest → +575% surge
Now the price is once again hovering near this same structural support.
If the zone holds, especially above $0.0000060, The probability of another large bullish expansion increases significantly.
TA-Based Expectation:
Given the historical pattern of explosive reactions off this range, the setup hints at a potential +500% to +1000% upside in the next 6 months, if support holds and momentum confirms.
This region remains one of the highest-probability accumulation zones from a pure technical-analysis standpoint.
But remember: Risk management is everything.
Always DYOR, This is NOT financial advice.

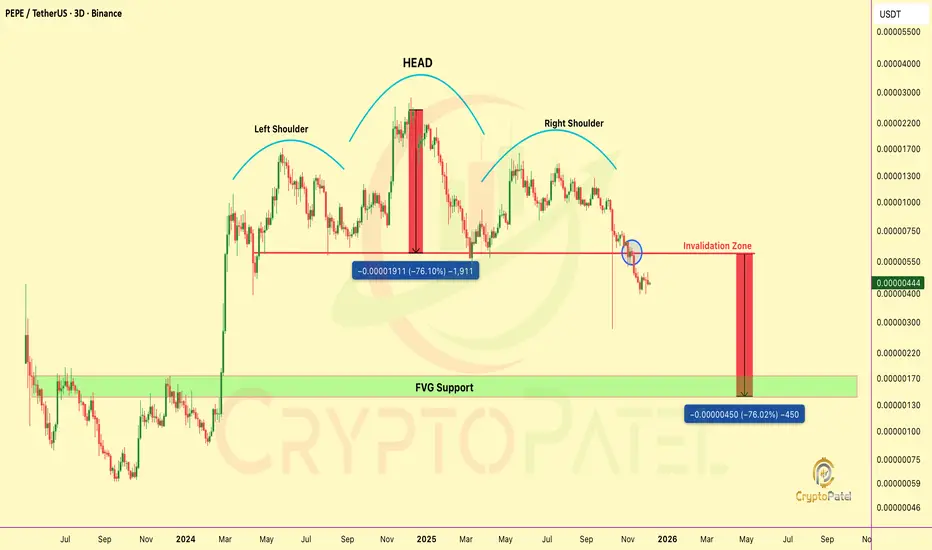
$PEPE TA Update: What PEPE Head & Shoulder Pattern Say?CRYPTOCAP:PEPE TA Update: What PEPE Head & Shoulder Pattern Say?
Head & Shoulders = Bearish
70% retracement possible ( Neck Line Support Broken )
Key Support $0.000006, Now Strong neckline support became strong resistance
Below NeckLine Support = 50-70% drop to $0.00000150
Hold & reclaim $0.000006 = bullish Reversal
NFA & DYOR
BTC Breakdown Confirmed – Here’s Where BTC Could Surge NextBTC Breakdown Confirmed – Here’s Where BTC Could Surge Next
1️⃣ Long-Term Trendline Breakdown Confirmed
🔹 BTC has decisively broken the multi-year ascending trendline supporting price since Nov 2022.
🔹 The Breakdown + Retest at ~$104k-$108k confirms bearish structure ✅.
🔹 Retest failed in Oct 2025, confirming sellers are in control.
2️⃣ Fibonacci Levels Highlight Strong Demand
🔹 Price is now hovering between 0 Fib ($125,647) and 0.382 Fib ($56,494).
🔹 Measured move Targets: Strong Demand Zone $34,477 - $56,494 (0.618 - 0.382 Fib)
🔹 This is the accumulation zone for long-term positions, historically providing strong bounce potential.
3️⃣ Critical Support / Resistance Zones
🔹 Immediate Support: $85k-$87k (psychological)
Major Support:
🔹 $56,494 (0.382 Fib, upper demand)
🔹 $44,133 (0.5 Fib, middle demand)
🔹 $34,477 (0.618 Fib, “Golden Pocket”, lower demand)
Resistance: Broken trendline now acting as key supply
4️⃣ Potential Scenarios
Bearish (High Probability)
🔹 Continuation down to Strong Demand Zone ($34k-$56k)
🔹 Represents 38-61% retracement from ATH, typical after trendline breakdown + retest
Bullish (Needs Reclaim)
🔹 Reclaim broken trendline (~$95k-$100k)
🔹 Close above $104k = false breakdown, continuation to new highs
Why I’m Watching $56,500 - $34,500 for Longs
🔹 Historical accumulation zone with high probability of a strong bounce
🔹 After breakdown + retest, price often retraces to 0.5 or 0.618 Fib before resuming bull trend
🔹 Perfect long-term entry for those aiming for multi-year BTC upside
BTC may test the $56k-$34k demand zone soon. For long-term holders, this is a prime accumulation area before the next bull cycle. Stay patient and strategic – $1M BTC dreams require discipline, not FOMO.
Guys, don’t judge me: I’m a Bitcoin lover too. I’m just reading what the chart is showing. Even if the short-term looks bearish, I see the setup for a massive long-term move toward $1M 🚀
NFA & DYOR

$BCH hasn’t hit a new ATH since 2017: Dead or Utimate Sleeper?SET:BCH hasn’t hit a new ATH since 2017: Dead or the Utimate Sleeper?
SET:BCH ATH: $4,212 (Dec 2017)
CRYPTOCAP:BTC ATHs: $19,800 (Dec 2017), $69,000 (2021), $126,000 (2025)
Observation:
SET:BCH hasn’t touched a new ATH since 2017.
CRYPTOCAP:BTC surged 6x+ after 2017 ATH, but SET:BCH stalled.
Is SET:BCH dead ❓
Key TA Levels:
🔹 Strong accumulation zone: $465 – $375
🔹 Critical support: $375 (holding this is essential)
🔹 Potential upside: $2,000 – $4,000 if momentum returns
Eyes on these levels. SET:BCH could be a sleeper play if it reclaims support.
Pro Tip: Patience + volume confirmation = key before any breakout.
NFA & DYOR

ETH Premium OB & FVG Zones – ChoCh Could Hit at $3,660ETH Premium OB & FVG Zones – ChoCh Could Hit at $3,660
Market remains in a Bearish Structure with steady LH → LL and clean BOS down. The current upward move is just a retracement into premium.
Key Zones:
FVG: $3,250–3,350 – First Reaction Zone for Short Entries
Bearish OB: $3,600–3,660 – Prime Supply Zone for Shorts
Shorting Strategy:
If you are Shorting ETH, these are the best levels to scale in.
Caution:
Any HTF candle closing above $3,660 Bearish OB signals a ChoCh. Exit shorts immediately, Trend flips bullish, opening the path toward new ATH.
Below $3,660 → bearish continuation likely
Above $3,660 → trend flip, bullish momentum expected
Until the OB break happens, bias stays bearish.
NFA & DYOR

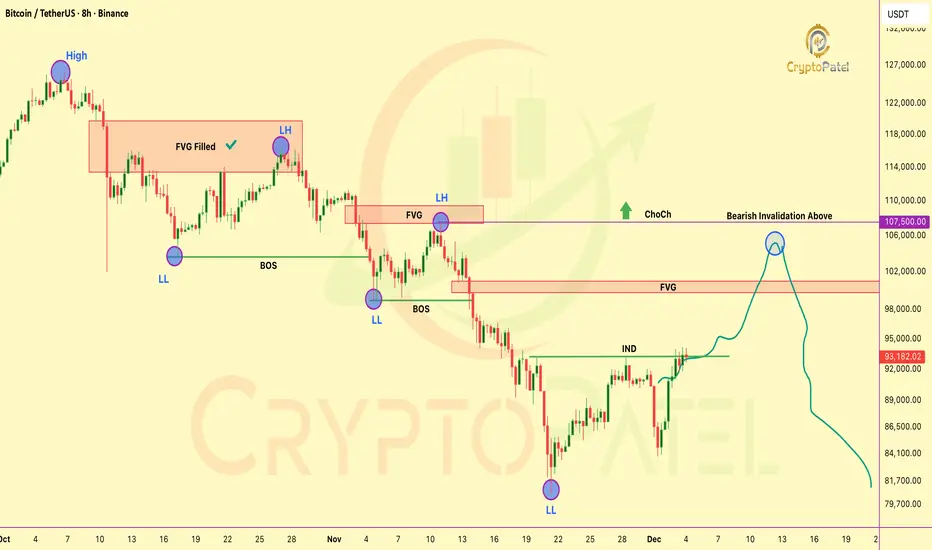
HTF ChoCH Alert: BTC’s Macro Bias Is Still BearishHTF ChoCH Alert: BTC’s Macro Bias Is Still Bearish
BTC is still following clean HTF bearish order-flow (LH → LL → BOS).
The current push up is just a premium retracement, driven by internal liquidity grabs.
Price is reaching for the premium FVG at 99,866–101,184, the next clear draw on liquidity and a prime reversal zone.
Below 107,500 bias stays bearish (Bearish Invalidation / HTF ChoCH)
Expect: BSL sweep → FVG fill → mitigation → sell-side continuation.
ICT view:
Market is simply rebalancing inefficiency before delivering lower.
NFA & DYOR
$TRUMP TOKEN: A 92% MASSACRE IN JUST 316 DAYS$TRUMP TOKEN: A 92% MASSACRE IN JUST 316 DAYS: WHAT THE HELL JUST HAPPENED? 😡
Let’s talk about the BRUTAL reality of celebrity/president tokens:
THE NUMBERS DON’T LIE:
🔹 ATH: $79.70 (January 19, 2025)
🔹 TODAY: $5.69 (December 1, 2025)
🔹 DOWN 92.58% IN LESS THAN A YEAR
316 DAYS: Not even a full year and your portfolio is DESTROYED.
THE REALITY CHECK:
If you bought $1,000 at ATH → Your bag is worth only ~$71 TODAY 💀
WHO PROFITED?
✅ Early insiders who dumped on retail
✅ VCs who got free or discounted tokens
✅ Influencers who promoted and then silently exited
WHO GOT REKT?
❌ Retail investors who FOMO’d at the top
❌ Newbies who trusted the hype
❌ Anyone who didn’t take profits
MY REPEATED WARNING:
NEVER INVEST IN INFLUENCER/PRESIDENT TOKENS!
This is exactly why I keep saying:
🔹 Don’t chase celebrity coins
🔹 Your money is HARD-EARNED
🔹 These are pump & dump schemes disguised as “movements”
Is this crypto or a 3rd class memecoin casino? YOU DECIDE.
LESSON: Hype doesn’t pay bills. Due diligence does.
STAY SAFE. TRADE SMART. PROTECT YOUR CAPITAL.
NFA & DYOR
TShort

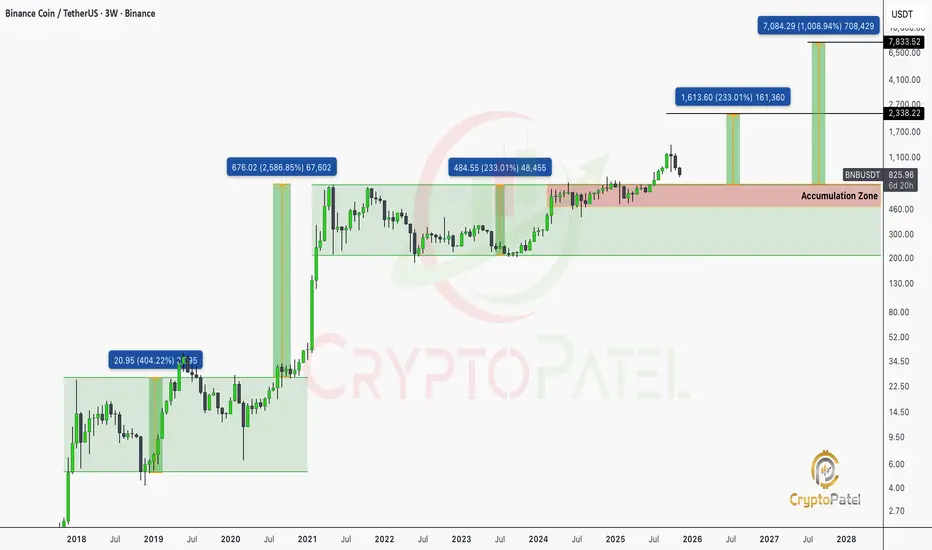
BNB/USDT 3-Week Chart Analysis: Is a Massive Breakout Coming?BNB/USDT 3-Week Chart Analysis: Is a Massive Breakout Coming?
Current Price: $827.05 (down 10.74%)
BNB is currently consolidating in a key Accumulation Zone between $700-$800, signaling institutional accumulation and balance.
Key Levels to Watch
Support Zones:
🔹 $484.55 – Critical demand from 2023 lows
🔹 $676.02 – Former ATH turned support
🔹 $700-$750 – Bottom of current accumulation
Resistance Targets:
🔹 $1,613 – First major upside
🔹 $2,338 – Next intermediate target
🔹 $7,084 – Long-term “moonshot” scenario
Volume & Structure Insights
🔹 2019 Breakout: Started the long-term uptrend
🔹 2021 Bull Run: Peak at $676, classic blow-off top
🔹 2024-2025 Accumulation: Renewed institutional interest
Bearish Risk
🔹 Failure to hold $700 → Retest $484 (-41%)
🔹 Breakdown below $484 → Bullish thesis invalid
NFA & DYOR
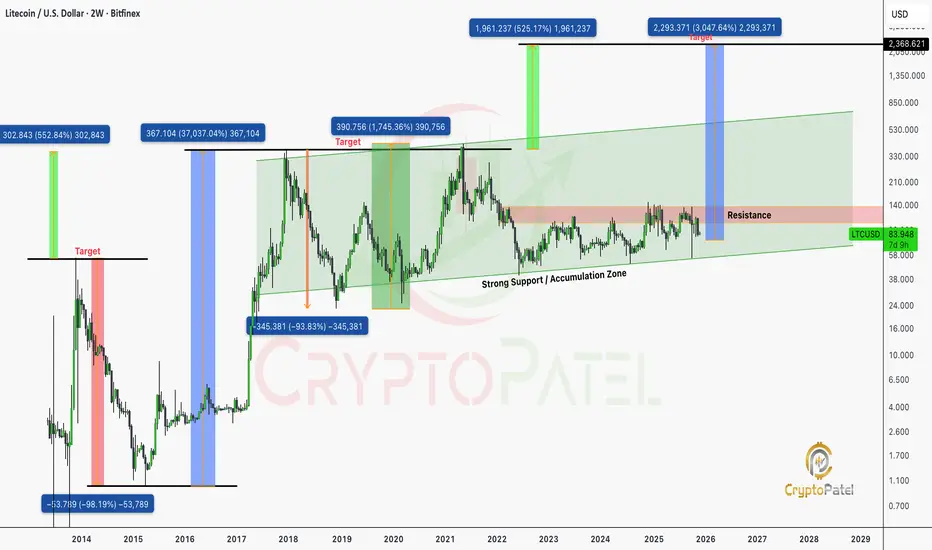
Is $LTC Dead? The Same Question Asked Before Every Major Rally…Is CRYPTOCAP:LTC Dead? The Same Question Asked Before Every Major Rally…
When markets forget history, they repeat it. Litecoin has gone through multiple full-cycle Retracements, Each time followed by explosive multi-X expansions. Let’s walk through the data:
🔰 2013–2015 Cycle: “LTC is Dead” #1
🔹 LTC hit an ATH of $55 from $1.
🔹 Retraced ~98%, bottoming at $0.985 within 16 months.
🔹 Retail sentiment: “LTC is dead.”
🔹 Smart money quietly accumulated.
Result?
$0.985 → $9 in 4 months (≈ +900%)
Eventually: $0.985 → $370 in 3 years (≈ +37,000%)
🔰 2017–2018 Cycle: “LTC is Dead” #2
🔹 New ATH: $370
🔹 Retracement: 92%, down to $23
🔹 Again: retail capitulation.
Result?
$23 → $146 in 6 months
$23 → $413 by May 2021 (≈ +1700%)
🔰 Current Market Structure (2021–2025)
🔹 Previous ATH: $413 (May 2021)
🔹 Current price: ~$84
🔹 Drawdown: 80%
Retail narrative: “LTC is dead.”
TA narrative: This is historically the accumulation zone.
Technical Outlook (Cycle-Based TA Projection)
Every prior deep-cycle retracement (80–98%) has led to:
🔹 Fresh multi-year impulse waves
🔹 New macro highs
🔹 Massive ROI expansion for accumulator wallets
Based strictly on historical cycle symmetry, volatility bands, and LTC’s halving-driven structure:
LTC Bull-Run Projection:
$600 – $1,000 is a reasonable and technically sound target range for the current macro cycle.
This would represent:
🔹 Breaking the 2021 high
🔹 Completing a full 5-wave macro structure
🔹 Returning to historical expansion ratios seen in every prior cycle
So You Already Know What Happens Next.
Litecoin’s entire history is built on max pain → max gain cycles.
Every 80–98% retracement has delivered its largest multi-X rallies after retail gave up.
Smart investors accumulate when the chart says accumulate, not when the crowd screams “dead.”
FINAL MESSAGE
LTC is not dead. It is in the same deep-value zone where every previous mega-cycle began.
If the market delivers another historical impulse, the $600–$1000 range remains a technically justified target.
Accumulate dips.
Ignore noise.
Let the chart speak.
Not Financial Advice so Always Do your Own Research Before Any Investments.
ETH Could Skyrocket to $7.8K After FUSAKA Upgrade: History ShowsCRYPTOCAP:ETH Could Skyrocket to $7.8K After FUSAKA Upgrade – History Shows
The last Ethereum Pectra Upgrade on 7 May 2025 triggered a massive move:
✅ +55% in 35 days
✅ +168% in 109 days
What’s next?
The FUSAKA Upgrade is scheduled for 3 December 2025. If history repeats:
👉 Target 35 days post-upgrade: $4,500 (7 Jan 2026)
👉 Target 109 days post-upgrade: $7,800 (22 Mar 2026)
Note: This is Purely Fractal Analysis Based on Pectra. Always DYOR – Markets can behave differently, and “Sell the News” Scenarios Happen.
Get ready for a potential ETHEREUM rally!
NFA & DYOR

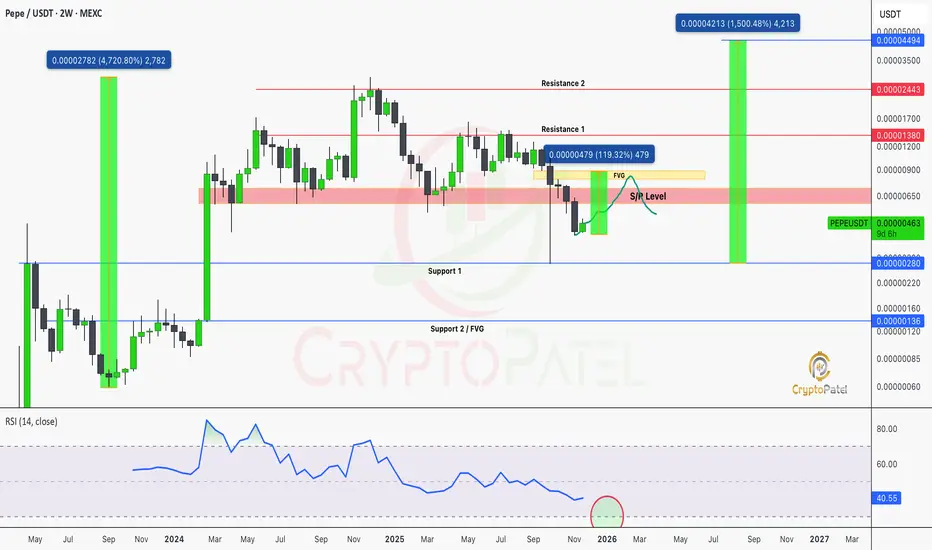
$PEPE Weekly Support Broken Or the Perfect Trap Before a Pump?CRYPTOCAP:PEPE Weekly Support Broken Or the Perfect Trap Before a Pump?
CRYPTOCAP:PEPE lost its weekly support and is now trading below it, which looks more like a full liquidity sweep than a real trend shift. I’m expecting a 50–100% relief rally before the next major move.
If key S/R flips and holds, we could see another memecoin cycle, with 1,000–1,500% upside back on the table.
Support / Accumulation: $0.00000280 / $0.00000136
Resistance / Targets: $0.00000914 → $0.00001380 → $0.00002443 → $0.00004494
Watch my levels closely before entering any trades.
NFA & DYOR
Biggest Altseason 10x-20x Loading for 2026?If You're Panicking Right Now, You're About To Miss The Easiest 5x-20x Of Your Life
The Total Market Cap (excluding BTC & ETH) just painted a picture we've seen before...
HISTORICAL CONTEXT:
Last bull run → 1200% pump after breakout & retest
Current situation → Long-term trendline support broken
This looks like a classic liquidity sweep before the next major leg up.
KEY LEVELS TO WATCH:
🔴 Strong Support: $750B - $600B
🟡 Strong Resistance: $1.1T
🟢 2026 Target: $4.25T
THE MATH:
If we hit that Target, we're looking at a 5x on total alt market cap
Individual Altcoins could Easily do:
Quality projects: 5x-10x
High potential gems: 10x-20x
Moonshots: Beyond 20x
MY TAKE:
This current "Crash" is NOT the beginning of a Bear Market. It's a shakeout. Big money is accumulating while retail panics.
The setup is almost identical to previous cycles:
✅ Panic selling at support
✅ Fear at maximum levels
✅ Long-term holders getting shaken out
This is exactly when you want to be positioning for the REAL altseason ahead.
RISK MANAGEMENT:
DCA at support zones ($750B-$600B)
Don't go all-in at once
Keep some powder dry for further dips
Focus on fundamentally strong projects
The biggest gains come to those who stay calm when others panic.
Are you ready for what's coming? 🚀
Not financial advice. DYOR. Manage your risk.
