UPDATE: $ZEC Playing Out EXACTLY As WarnedUPDATE: CRYPTOCAP:ZEC Playing Out EXACTLY As Warned
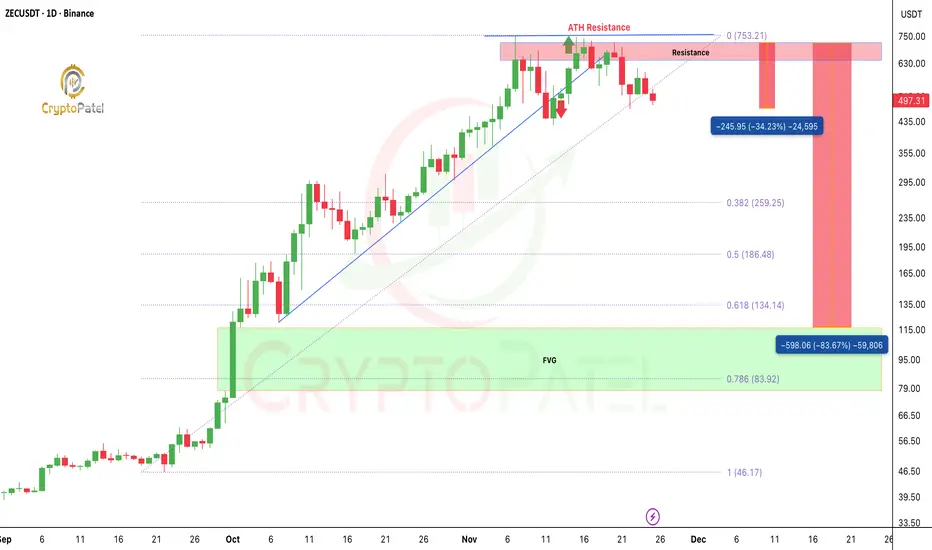
ZEC tagged the $700 HTF resistance and dumped 35%+ right from the level I highlighted earlier.
The move toward the $100 zone is unfolding step-by-step, exactly what the HTF structure hinted at.
I’m not saying ZEC can’t reclaim $700 and even squeeze toward $1,000 again…
But the risk is extremely elevated up here. Smart money enters where risk is low + reward is high, not at euphoric tops.
This is NOT a short signal.
This is awareness analysis, don’t jump into high-leverage longs blindly in a corrective environment.
My Radar Levels: $259 / $186 / $134
Invalidation : Any HTF candle closing above $760
Stay disciplined. Protect capital. Market always rewards the patient, not the emotional. NFA.
ALTS
$TAO HTF SMC: Who’s Ready for the $1,000+ Expansion?GETTEX:TAO HTF SMC: Who’s Ready for the $1,000+ Expansion?
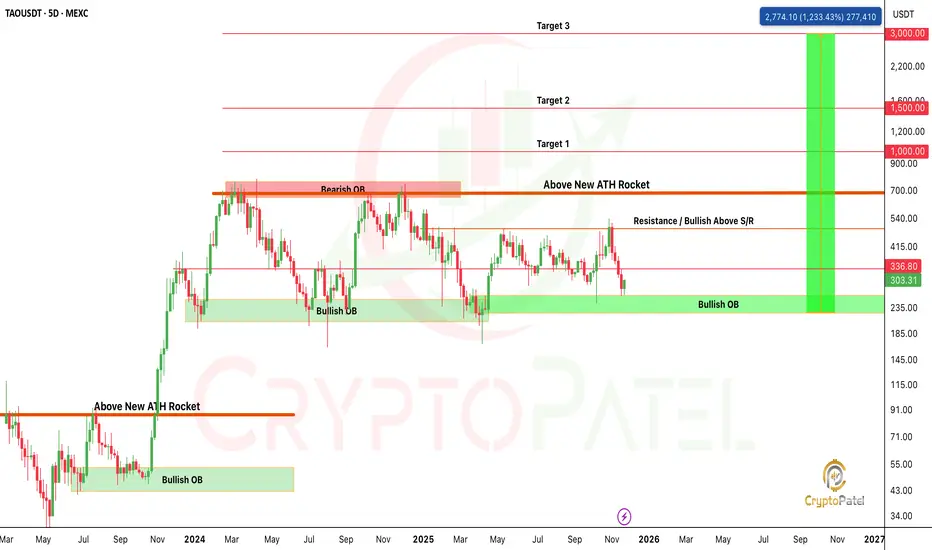
Price continues to respect the HTF Bullish Order Block (OB) at $235–$185, which remains the primary demand zone maintaining bullish order flow. Each mitigation of this OB has previously generated strong displacement to the upside, confirming active institutional interest.
The current range is defined by:
🔹 HTF Demand (Bullish OB): $235–$185
🔹 Mid-Range S/R: $540
🔹 HTF Supply (Bearish OB): $640–$700
A decisive close above $540 S/R will shift the internal structure bullish and validate a premium re-pricing phase targeting the HTF Supply at $640–$700.
A clean break of structure (BOS) above $700, combined with a displacement candle, will confirm HTF trend continuation and open up extended liquidity targets:
Target 1: $1,000
Target 2: $1,500
Target 3: $3,000
As long as price maintains the $235 Bullish OB, the HTF narrative remains bullish, with expectation of a sweep of upper-side liquidity and expansion toward unmitigated supply zones.
NFA & DYOR
UPDATE: $HYPE/USDT SHORT PLAYED TO PERFECTIONUPDATE: $HYPE/USDT SHORT PLAYED TO PERFECTION
Perfect short entry nailed at $50, after the clean retest, price flushed to $29, now stabilizing near $32.
That’s 38% down from our entry.
📉 5x Short = ~190% Profit
📉 Spot Position = 38% Gain
Both sides winning exactly as planned.
If you’re satisfied with the massive profit, feel free to secure and book here.
I’m still eyeing the $23–$19 zone for the full high-risk/high-reward target but safer traders already have their bag made.
We literally rode it from $50 → $29 in real time. 🔥
NFA & DYOR

Bitcoin Ready to hit New Low?BITCOIN QUICK UPDATE: LEVELS PLAYING OUT EXACTLY AS EXPECTED
As we mentioned earlier, the $88,600 FVG has now been fully filled, and CRYPTOCAP:BTC is currently trading below that zone.
Here’s what matters next:
🔹 If $85,000 holds as support → BTC likely pushes toward the next major Bearish Order Block at ~$93,000.
High probability this zone gets tapped.
🔹 If BTC fails to reclaim and break above $88,000 → expect a deeper leg down toward ~$75,000.
Stay sharp. NFA.

BITCOIN JUST DID EXACTLY WHAT WE DISCUSSED: CURRENT UPDATEBITCOIN JUST DID EXACTLY WHAT WE DISCUSSED: CURRENT UPDATE
CRYPTOCAP:BTC bounced perfectly from the 0.786 Fib ($83,308), The FINAL bullish support.
Now trading above $86,500, already +5–6% up from the exact level I alerted.
As long as BTC holds $83,308, upside relief rally remains active:
$88,000 (FVG)
$93,000 (Bearish OB)
$98,000 (FVG inefficiency)
But… if BTC loses $83,000, say hello to the $66,000 demand zone, The next real bullish orderflow.
For now: Structure is bullish above 0.786, cautious below it.
(NFA / DYOR)

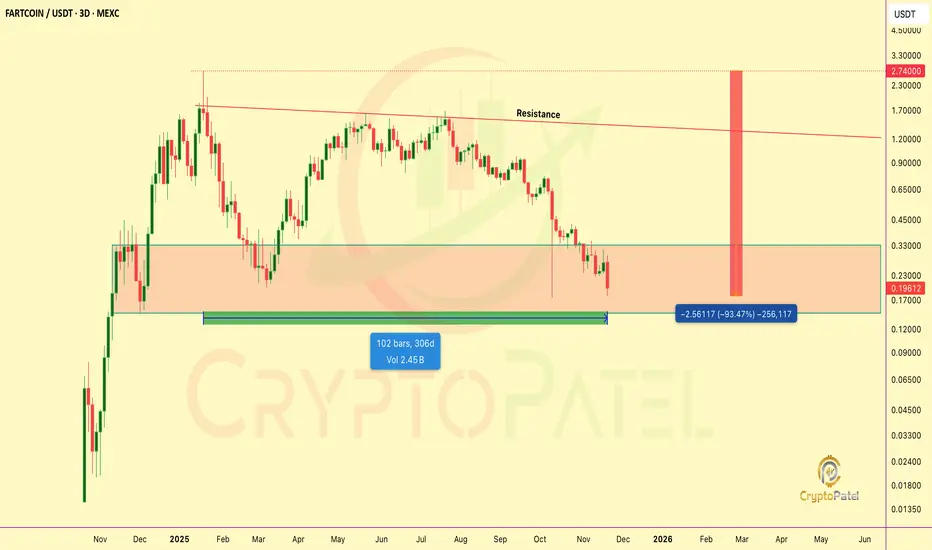
FARTCOIN COLLAPSES BELOW $200M: END OF AN ERA?FARTCOIN COLLAPSES BELOW $200M: END OF AN ERA?
Fartcoin has officially plunged 94% from its January ATH, now trading around $0.18.
On-chain data (Arkham) shows Wintermute slashing its holdings from nearly 3% of supply → just 0.24%, triggering fears of a major market-maker exit.
Rumors point to an expiring dev loan driving aggressive sell-offs and mixed sentiment:
🔻 Bears: calling for $0.10
🔼 Bulls: eyeing an unlikely but possible $1-$2 rebound
Despite the wreckage, perp volumes remain high and funding flipped deeply negative, often a setup for short-term relief bounces in memecoins.
Volatile conditions ahead. Stay sharp.
NFA & DYOR
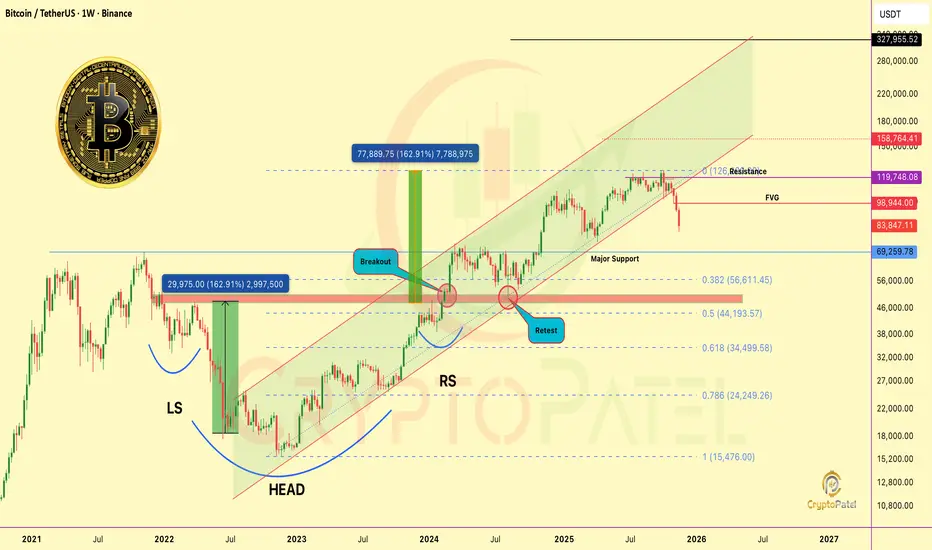
STOP SCROLLING: BITCOIN TECHNICAL ALERT (3-Year Support Break)🚨 STOP SCROLLING: BITCOIN TECHNICAL ALERT (3-Year Support Break) 🚨
Bitcoin has broken a long-term support channel that’s been respected since 2022. That multi-year channel support was around $108,000 and I warned there to protect capital and trade safe.
Result: Breakdown.
✅ BTC dumped over -25%
✅ Now trading near $83,000
Structure Still Bearish
Trend remains bearish unless BTC reclaims the broken channel.
A Relief bounce is still possible toward: $93,000 / $98,000
But treat that as corrective unless structure flips.
Major Support: $69,000 is a critical level, Last bull-run ATH and strong demand zone. Watch it closely.
If This Channel Break Plays Out Fully…
As a Technical Analyst, I can’t sugar-coat the math.
When a multi-year channel breaks, the natural downside targets usually align with major Fibonacci retracement zones:
Deep Retracement Targets (Bear Case)
0.5 Fib: $44,193 (~60% probability)
0.618 Fib: $34,500 (~30% probability)
0.718 Fib: $24,250 (~10% probability)
These aren’t fantasies. They’re standard TA outcomes after this type of structural failure.
Important: This Is Not Panic
I’m not here to spread fear.
I’m here to state what the chart is objectively signaling.
Markets don’t move on hope, They move on structure, liquidity, and trend mechanics.
If price goes into that 0.5–0.718 Fib zone, it would be painful short-term…
but also a once-in-cycle accumulation window for long-term holders.
CryptoPatel Note:
Believe me, I want BTC at $1M+ in the future.
But wanting isn’t analysis.
My job is to map both paths: bullish and bearish, Before they happen.
Save this post. Mark the levels. Trade safe.
Because when a 3-year support breaks, the market doesn’t whisper, it screams.
NFA & DYOR
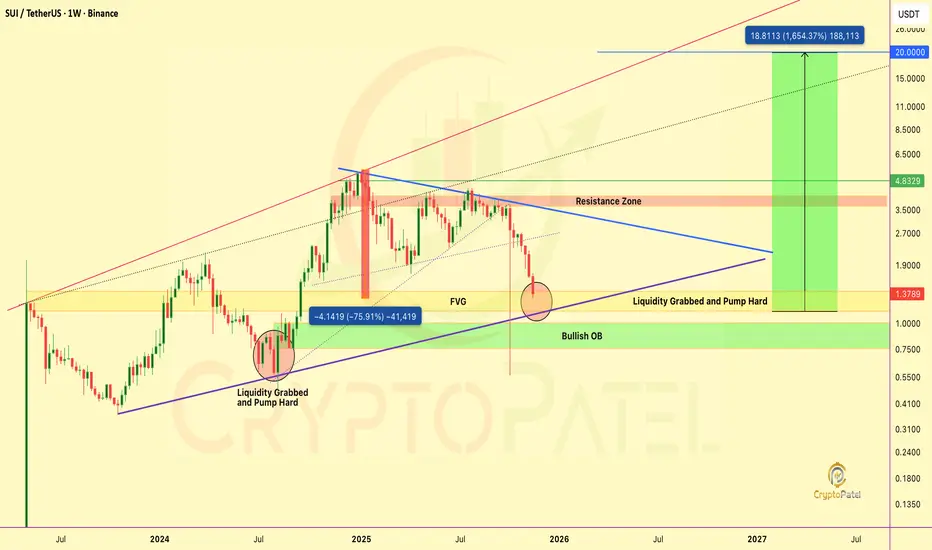
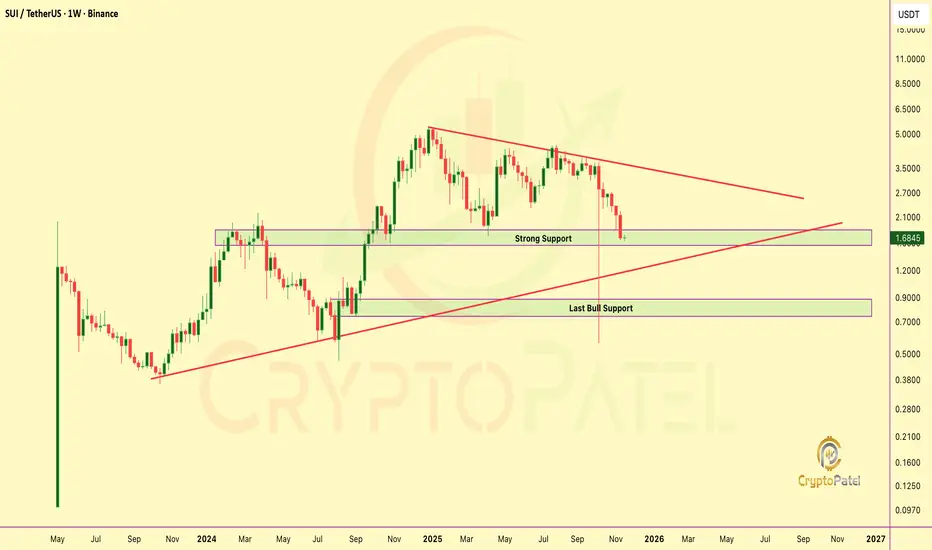
$SUI JUST ENTERED ITS DO-OR-DIE ZONE CRYPTOCAP:SUI JUST ENTERED ITS DO-OR-DIE ZONE AND THE WEEKLY CHART IS SCREAMING A REVERSAL SETUP
Everyone is panicking at the dump…
But nobody is seeing what actually happened on the HTF:
🔹 Massive Liquidity Grab Completed — identical to the 2024 bottom pattern.
🔹 Price nuked directly into FVG + Bullish Order Block.
🔹 Strong rejection wick = smart money accumulation confirmed.
🔹 Macro trendline STILL intact. Structure STILL bullish.
But let’s be Honest:
👉 Market condition is extremely worst right now.
👉 All altcoins dumped hard.
👉 CRYPTOCAP:SUI is –75% down from its Jan 2025 ATH… 10 months of pure bleeding.
Still, the chart is loading something big.
Here’s my IMO approach:
🔹 Accumulation Zone 1: $1.35 – $1.15
🔹 Accumulation Zone 2: $0.90 – $0.75
⭐ Don’t try to buy once.
⭐ No one knows the exact dip.
⭐ Smart way = accumulate slowly inside these zones.
Strong bounce potential sits exactly from the FVG → Bullish OB confluence.
If SUI breaks $4.8 resistance?
Targets: $5 → $10 → $20
IMO one day CRYPTOCAP:SUI will hit $20 easily.
But of course, Not financial advice. DYOR before investing.
XVG Was pumped 13000000% in 2015-2017 so what Next?Crypto History Reminder:
SGX:XVG was one of the most explosive rallies of the 2015–2017 cycle, a 13,000,000% (13M%) move in under two years. Despite the noise, it still trades +296,000% above its 2015 baseline.
OGs know the John McAfee era was a major catalyst, but the market is no longer driven by personalities, it’s driven by structure.
Technically:
As long as XVG holds the $0.004 support, trend bias remains bullish on higher-timeframe structure.
Cycles repeat. Narratives change. Price action doesn’t lie.
NFA & DYOR

$BTC STANDING ON ITS LAST SUPPORT: READ THIS BEFORE YOUR TRADEBITCOIN TECH UPDATE — FRESH LEVELS, FRESH PAIN
CRYPTOCAP:BTC just dumped to $80,641, making a new low since 12 April 2025.
That’s almost -30% from my Short + Exit levels.
Those who Rode the Short, Enjoy the profits.
Those who avoided chasing above $120k, capital saved again.
Where We Stand Now
Bitcoin is sitting exactly on the 0.786 Fib ($83,300), the strongest bullish support left on the chart.
This level = Bulls’ last hope.
If daily candle doesn’t close below $83,300, then expect a relief rally into upside inefficiencies:
Upside Targets (If 0.786 Holds)
$88,600 → major unfilled FVG
$93,000 → bearish Order Block (high probability fill)
$98,000 → another upside FVG waiting to be delivered
Watch how price behaves at these levels — next macro move will be decided there.
If 0.786 Fib Breaks…
Be ready.
Next liquidity pools: $73,000 / $66,000
Both zones have massive bullish orderflow waiting.
If 0.786 support holds → BTC still has high probability to push for a new ATH.
Summary:
Trend still bearish, but BTC is now at a critical support.
Hold → relief rallies + possibly new ATH.
Break → $73k–$66k incoming.
Stay sharp. Watch the levels. Trade with intention.
NFA &" DYOR

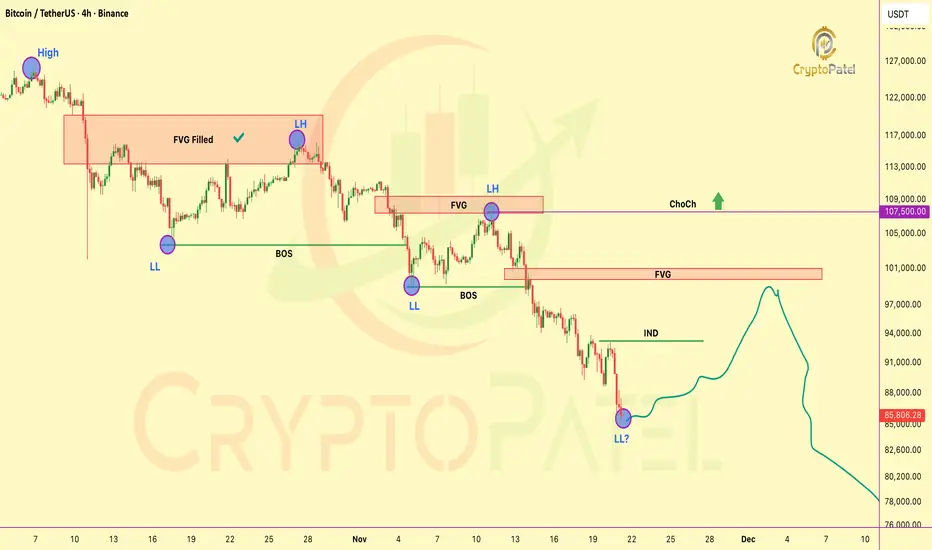
$BTC Just Printed Another LL: Next Draw Is Locked InCRYPTOCAP:BTC Just Printed Another LL: Next Draw Is Locked In
Market is maintaining a clear bearish orderflow with continuous LH → LL sequence.
Structural Notes
🔹 Previous major FVG (distribution zone) has been fully filled and delivered downside.
🔹 Multiple BOS events confirm continuation of the bearish leg.
🔹 Recent sweep followed by another LL shows sellers still in full control.
🔹 INDUCEMNET zone rests around $93160, high-probability inefficiency for short-term retracement.
🔹 Major unmitigated FVG remains at $100800, acting as a premium draw if price seeks liquidity.
Expectations
🔹 Retracement likely into nearby inefficiencies:
🔹 IND @ $93160 → high-probability mitigation
🔹 FVG @ $100800 → medium-probability mitigation (only if deeper pullback unfolds)
🔹 Trend remains bearish until market delivers a ChoCh above $107.5K.
Current Bias: Bearish
Short-Term Draw: IND (mid-range inefficiency)
Mid-Term Draw: Unmitigated FVG (premium zone)
Invalidation: ChoCh above $107.5K
NFA & DYOR
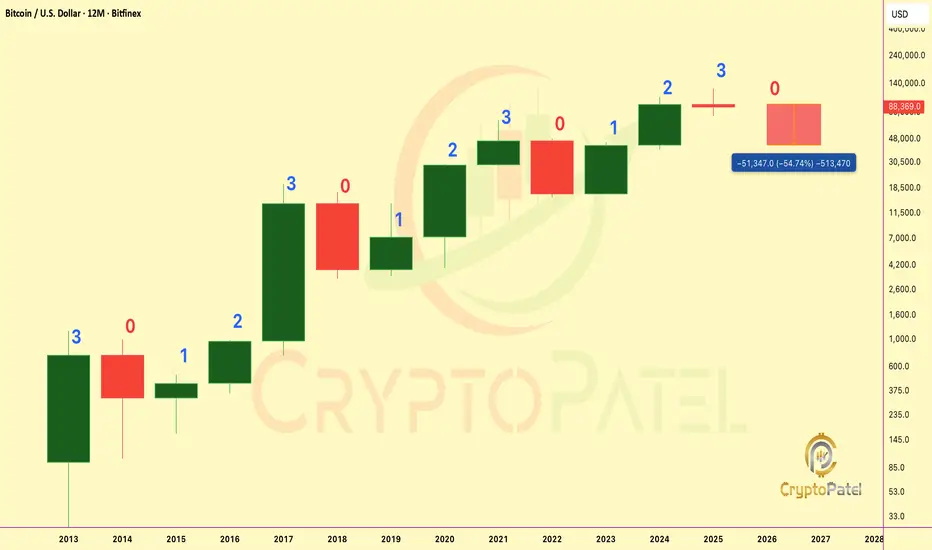
Bitcoin Most Critical 40 Days of the Entire Cycle🚨 Bitcoin Most Critical 40 Days of the Entire Cycle 🚨
CRYPTOCAP:BTC Yearly Fractal is clear: RED → 3 GREEN → BIG RED.
2025 = Candle 3, historically the strongest and always breaks ATH.
Bitcoin can hit a new ATH ONLY this year.
If BTC does not break ATH in the next 40 days, history shows it never breaks the 3rd candle high the following year: Meaning 2025 becomes the cycle top, and 2026 turns into a 50–70% retracement year ($30k–$40k).
✔ Break ATH → $150k–$180k
❌ No ATH → Biggest Correction of the Cycle in 2026
NFA & DYOR
$PEPE BREAKDOWN: 70% Dump? SMC Says YESCRYPTOCAP:PEPE BREAKDOWN (READ THIS BEFORE YOU SCROLL): 70% Dump? SMC Says YES
Price has broken the long-term support at $0.0000059 and that level is now strong resistance.
Until PEPE reclaims this zone, trend stays bearish.
SMC Structure
HTF Demand swept + Weekly FVG filled
Liquidity taken below multi-month lows
Support → Resistance flip at $0.0000059
Below this = continuation sell-side liquidity hunt
Downside Expectation
If price rejects from the new resistance, PEPE still has room for 60–70% downside.
That drop would hit the HTF Accumulation Zone → $0.00000178
(High-value area where Smart Money positions.)
Fractal Outlook
Last time PEPE entered this structure → 4650% bull run.
Same HTF pattern forming again.
If PEPE drops 40%–70%, that’s where long-term money accumulates for the next big move.
Reclaim $0.0000059 = bullish reversal
Stay below = deeper accumulation incoming
HTF structure is not bearish forever, It’s preparing the next expansion. Watch the reclaim.
NFA & DYOR

$ETH UPDATE – FVG FILLED & STRUCTURE CLEANEDCRYPTOCAP:ETH UPDATE – FVG FILLED & STRUCTURE CLEANED
CRYPTOCAP:ETH just bounced perfectly from the $2,880 FVG and the entire downside imbalance is now fully filled, meaning no remaining bearish FVGs below.
Structure is clean… Ethereum is now technically READY for upside continuation.
Only one concern:
👉 Bullish OB zones: $2,622 & $2,256
If we dip into these OB levels → that’s the BEST accumulation zone for a $10K–$15K ETH target in the next cycle.
Don’t miss any major dip on Ethereum imo.
Smart money accumulates when the chart is clean and now it is. 🚀
NFA & dYOR

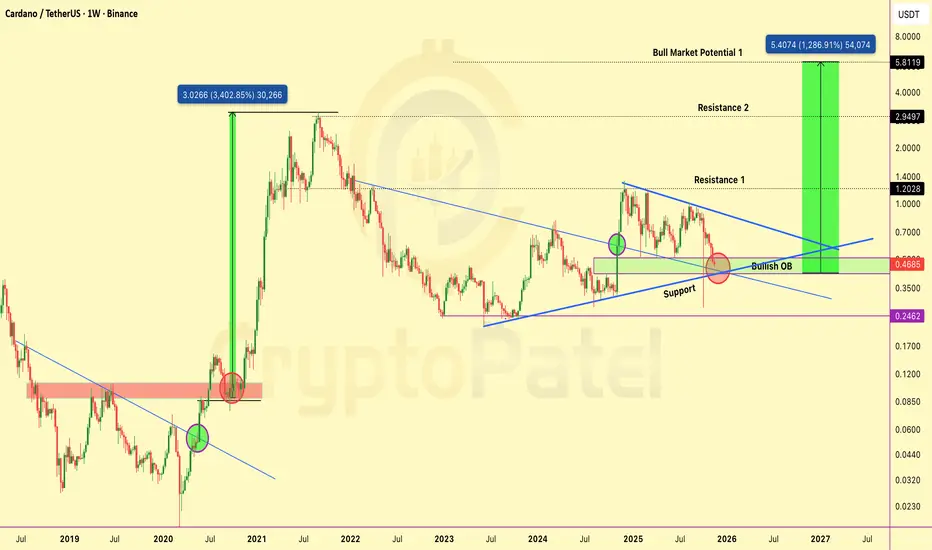
$ADA Retested THE Level That Triggered Its Last Parabolic RunCRYPTOCAP:ADA Just Retested THE Level That Triggered Its Last Parabolic Run: History About to Repeat?
Cardano is again retesting the same multi-year $0.46–$0.35 bullish order block inside the descending wedge that triggered its last explosive cycle. The structure is almost identical, only bigger.
Market Structure:
3+ years of compression tightening toward the apex
Price holding the institutional accumulation zone
Volatility squeeze signaling a high-probability breakout window
Upside Levels: $1.20 → $2.95 → $5.80+
Last time ADA broke this pattern, it didn’t move 30%… it moved 3,000%.
Asymmetric setup. Invalidation below $0.35.
Not financial advice. DYOR.
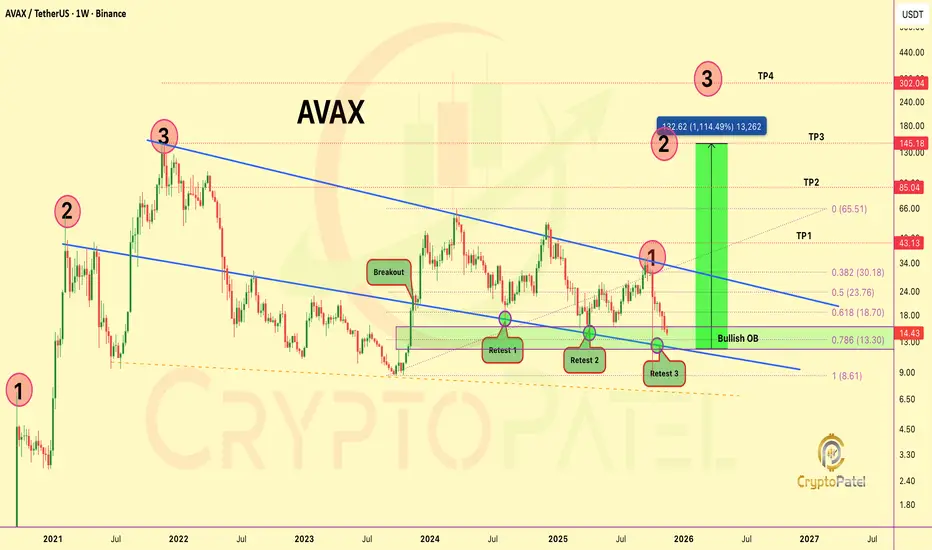
$AVAX IS SITTING ON A MACRO LEVEL YOU CAN’T IGNOREAVAX IS SITTING ON A MACRO LEVEL YOU CAN’T IGNORE
AVAX just Tapped a 4-year Demand Cluster:
Bullish OB + 0.786 Fib + long-term wedge support, the same region that triggered every major reversal since 2021.
This is Retest #3, where high-timeframe structures typically shift from capitulation → accumulation.
Liquidity below the range is cleared. Sellers are exhausted. Volatility is compressed to extremes.
If this Base Holds, the Upside Map is already Defined:
$43 → $85 → $145 → $302 (Full wedge expansion potential: ~1,100%)
This is the kind of level where institutions position quietly while retail exits loudly.
IMO, the Best Long-run Accumulation Range remains $15–$11.
Note: NFa & DYOR
Bitcoin Death Cross AlertBitcoin Death Cross Alert
Over the past year, every death cross on BTC has marked a clean local bottom and triggered strong upside reversal.
But remember 2022: That same signal ignited a full-scale bear market.
A fresh death cross just printed on the chart…
So What are we Looking at this time, Another Bottom Forming, or the start of a deeper Bleed?
NFA & DYOR

#ETHEREUM Technical Update: $3000 Hit Exactly as Mapped#ETHEREUM Technical Update: $3000 Hit Exactly as Mapped
CRYPTOCAP:ETH has tapped the $3000 zone, exactly as projected when price was breaking down from the $4000 bearish breakdown + retest.
We’re now ~30% down from the short-entry region.
If you shorted, you booked heavy profits.
If you didn’t, at least you avoided longing the top above $4000+
This is where the prime accumulation zone begins.
Key levels to watch:
🔵 $3000: First accumulation zone + bullish OB (Possible bounce reaction from here.)
🔽 Next support: $2400
Major Accumulation Zones:
0.5 FIB: ~$2621
0.618 FIB: ~$2255
If ETH sweeps into these FIB/FVG pockets, that becomes the high-discount, prime long-term accumulation zone.
Macro view unchanged: Long-term Target: $10K–$15K
Stay patient. Stick to structure. Accumulate smart, not emotional.
NFA & DYOR

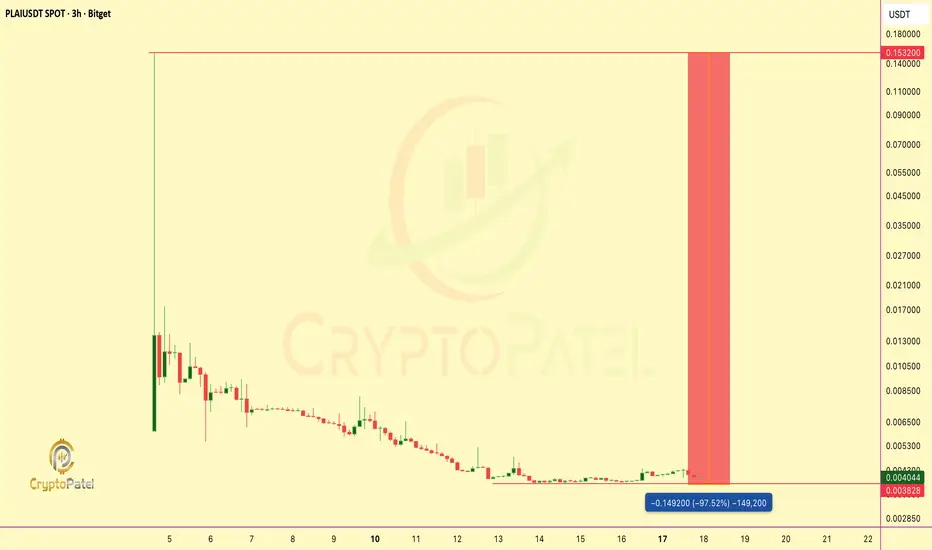
HOW VCs & KAITO FARMED $PLAI INVESTORS FOR EXIT LIQUIDITYSTOP BUYING IDOs: HOW VCs & KAITO FARMED $PLAI INVESTORS FOR EXIT LIQUIDITY
$PLAI launched at $0.153 on Nov 4.
Today? $0.004.
Now Your $10K is $260
That’s -97% in 13 days.
$PLAI went from $70M FDV → $1M market cap.
Not a dip, a detonation.
Why the collapse?
Massive token unlocks
Overpriced $50M–$70M FDV at launch
Low liquidity (small sells nuked price)
Hype ≠ adoption (7.5% retention)
50% IDO unlock at TGE
VCs exiting into retail
Launchpads don’t protect retail.
They protect VC exits.
If you bought high, you got farmed.
This is the risk of shiny AI tokens with weak demand & bad tokenomics.
NFA & DYOR
$SUI $1.66: The Liquidation Event That Just Printed the Next CycCRYPTOCAP:SUI Sharp ~70% Drawdown to the $1.66 zone has triggered broad Capitulation, with sentiment flipping decisively risk-off.
This is market structure: forced liquidity, weak-hand exits, and a reset in positioning after an overextended leg.
But historically, deep corrective sweeps often mark the final stage before trend re-acceleration. The $1.70–$1.00 range is emerging as a high-conviction accumulation pocket for investors with longer time horizons.
Should liquidity rotate back into high-beta assets later this cycle, a re-pricing toward the $10 region stays firmly on the Table.
In Crypto, Volatility Punishes Impatience and Rewards Discipline.
NFA & DYOR
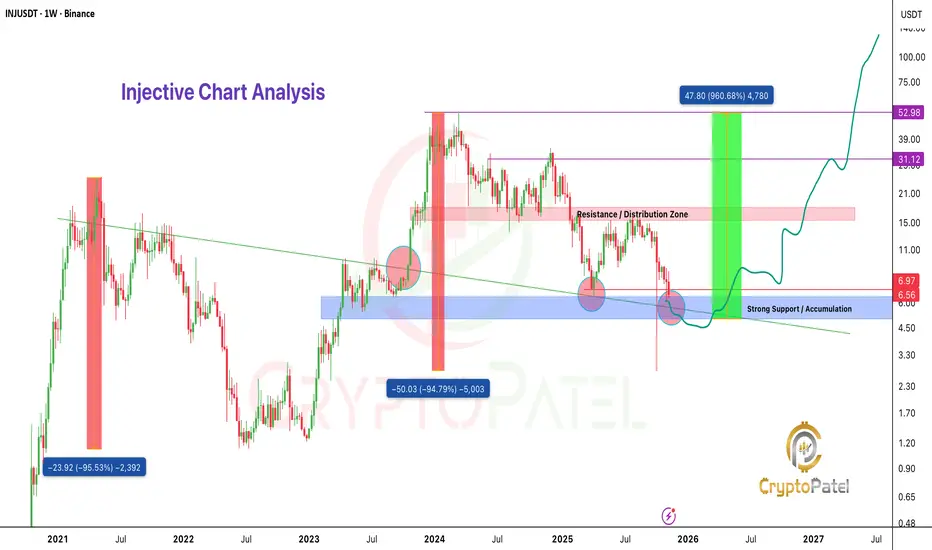
$INJ Is Repeating the 2021 Fractal: The Next 4,000% Move?CRYPTOCAP:INJ Is Repeating the 2021 Fractal: The Next 4,000% Move?
2021 Cycle Pattern:
🔹 Impulse: $0.65 → $25
🔹 Corrective Phase: -95% → $1.12
🔹 Expansion: +4,500% → $53 ATH
2024 Structure Mirrors 2021:
🔹 Impulse: $7 → $53
🔹 Corrective Phase: -94% → $2.74
🔹 Price now sitting inside historical Post-Cycle Reaccumulation Zone.
Accumulation Zone: $6–$4
Upside Targets: $15 / $30 / $50 / $70 (HTF liquidity clusters)
Invalidation: Break of structural low based on individual risk.
If 2021 fractal continues to play out, CRYPTOCAP:INJ is entering its highest-probability expansion window.
NFA & DYOR
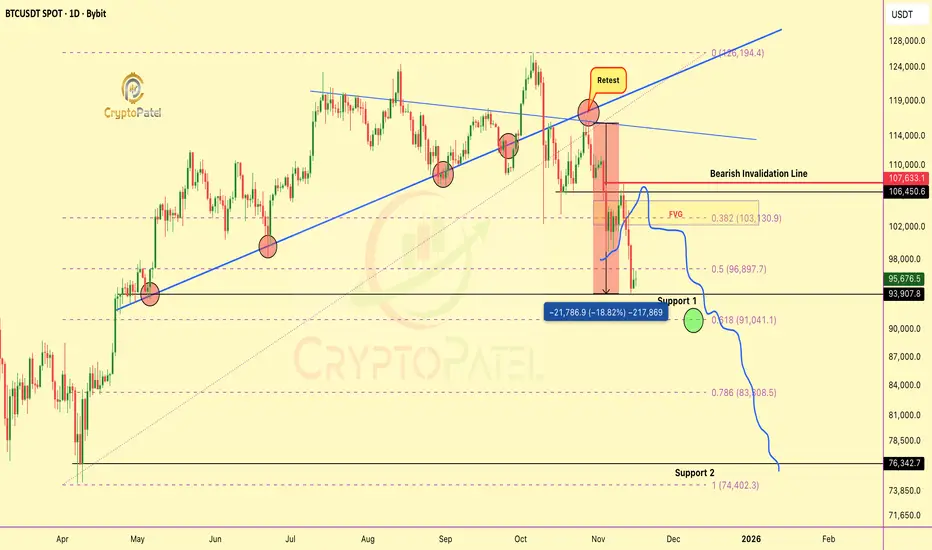
#BTC Technical Update: Structure Playing Out With Precision#BTC Technical Update: Structure Playing Out With Precision
CRYPTOCAP:BTC has tapped the $95K zone, completing the corrective leg projected when price was rejecting the $115K–$110K range.
Key downside levels already reached:
➡️ $105K ✔️
➡️ $93K ✔️
As long as price fails to break and close above $107,500, the bearish structure remains intact and the next liquidity target becomes: $73K
A confirmed close above $107.5K invalidates the bearish leg and reopens the path toward a new ATH.
Critical zones to watch:
➡️ 0.5 FIB — structural reaction level
➡️ 0.618 FIB — high-probability reversal pocket
🔻 Bearish below $107.5K
🔺 Bullish above $107.5K
Price is respecting structure with accuracy.
Charts > emotions. Levels > noise.
NFA & DYOR
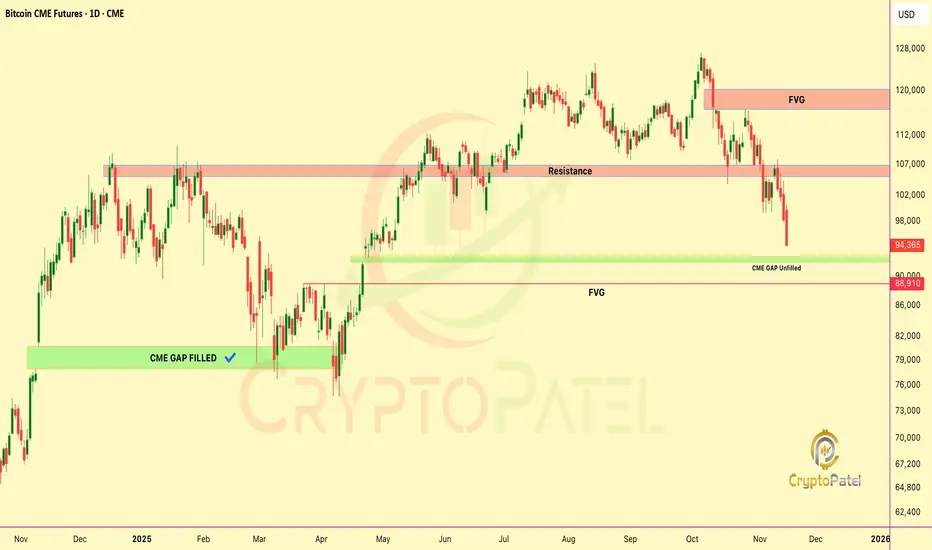
Bitcoin Next move $70k or $120k?CRYPTOCAP:BTC Is About to Bounce From the Level Everyone Is Ignoring
CME Gap 👉 $91,170
FVG below 👉 $89,020
Both zones = liquidity magnets.
No upside CME gaps left… only 1 upside FVG at $120,370
My view:
Fill → Sweep → Strong bounce expected from $89K–$91K range.
Next major draw = $120K FVG.
NFa & DYOR