Will $ONDO Potential to hit $5?#ONDO Has Been In A Brutal ~90% Drawdown From Its ATH ($2.15) Over The Last 14 Months But This Is Where Generational Entries Are Made.
Price Is Sitting At A HTF Fibonacci Demand Zone With Strong Accumulation Structure Forming 👇
✅ ATH: $2.15 (14 Months Ago) & Current ~90% From ATH
✅ Price Sitting Inside Strong Bullish OB: $0.19–$0.24
✅ Deeper Demand / 0 Fib Retracement: $0.171
✅ HTF Market Structure Valid Above $0.170
✅ Turn Fully Bullish Above $0.47 (Structure Flip Zone)
✅ Classic Wyckoff Accumulation Phase In Play
⚠️ Breakdown Below $0.171 = Final Support Invalidated
Upside Targets (If Structure Flips Bullish): $1.00 (5x) ➔ $2.15 (ATH 10x) ➔ $5.00+ Full Cycle Expansion (2500%+)
Pro Positive Point:
Do You Know Trump’s World Liberty Financial (WLFI) Bought LSE:ONDO At $1.374 And You’re Getting It Around $0.20, Which Is ~85% Down From Trump’s Entry.
WLFI Holdings: $470,000 Invested For ~342,000 ONDO Tokens.
Thesis:
RWA Narrative Leader Trading At A High-Confluence Demand Zone – Fibonacci + Bullish OB + HTF Support All Stacking.
If Structure Flips Above $0.47, This Sets Up For A Multi-Leg Parabolic Move.
IMO: LSE:ONDO Is Currently On Sale With A ~90% Discount.
TA Only | NFA | Always DYOR
💬 Your LSE:ONDO Target? 👇
❤️ Like + RT + Bookmark
Altseason

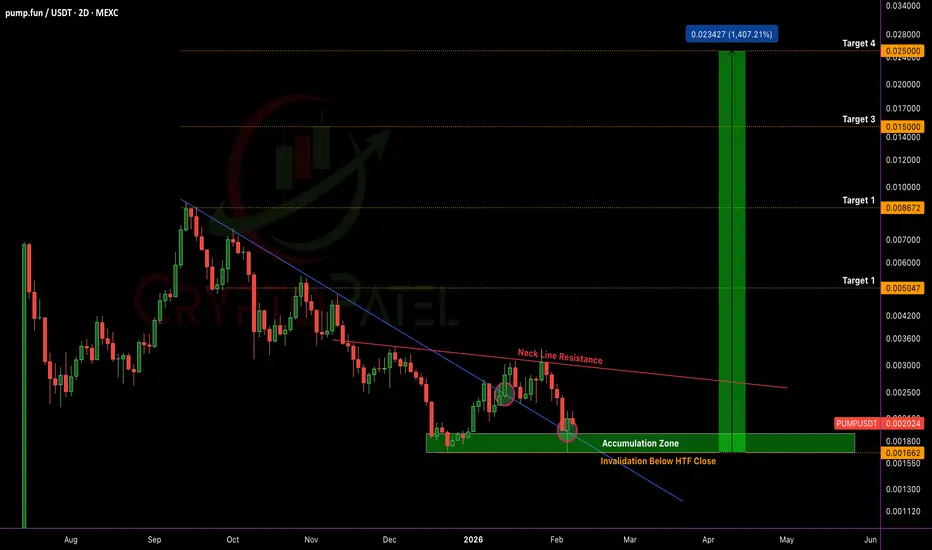
$PUMP PRICE PREDICTION | 15x UPSIDE POTENTIAL IF HTF BASE HOLDSNYSE:PUMP PRICE PREDICTION | 1,500% UPSIDE POTENTIAL IF HTF BASE HOLDS
#PUMP is trading inside a HTF Accumulation Zone after completing a long-term descending wedge, signaling a potential macro trend reversal.
Technical Structure Overview:
✅ Multi-month descending wedge breakout confirmed on 13th January 2026
✅ Breakout and Retest successfully completed ($0.0025 → $0.0017)
✅ Current retest zone aligns with HTF demand, offering a favorable entry area as per the chart
✅ Strong Accumulation holding Above $0.0015
✅ Structure Remains Bullish above $0.0015 Support (HTF hold)
✅ Sustained acceptance above Accumulation = Continuation
CryptoPatel Expansion Targets: $0.00504 → $0.00867 → $0.01500 → $0.02297+
Altseason Confirmation: A decisive break and hold above $0.0030 would confirm strength and mark real Alt Season Entry for NYSE:PUMP
Upside Potential:
If price holds above $0.0015 support, PUMP/USDT Carries 1,500%+ upside potential in the near future based on HTF expansion.
❌ Invalidation:
HTF close below $0.0015 invalidates the reversal structure and opens downside risk.
TA only. Not financial advice. ALWAYS DYOR.
$ADA ALTSEASON SETUP | 4,500%+ EXPANSION IF SUPPORT HOLDSCRYPTOCAP:ADA ALTSEASON SETUP | 4,500%+ EXPANSION IF SUPPORT HOLDS
#ADA Is Trading Inside A HTF Bullish OB After A ~93% Corrective Move From Its Local Macro High, Positioning Price At A Critical Accumulation Vs Invalidation Zone.
Technical Structure
✅ Previous Cycle ATH At $3.1 (+1,300% Expansion)
✅ BIG Correction PHASE: −78% From $1 Local High Within Last 6 Months
✅ Multi-Year Strong Support Holding Above $0.24 Level
✅ HTF Bullish OB Active At $0.18–$0.13
✅ Structure Remains Bullish As Long As $0.13 Holds (HTF Close)
✅ Strict STOP LOSS For High Risky Trader: $0.0755 (HTF Close)
Historical Context:
2021 Bull Run: +3,400% Expansion To $3.10
2021-2026 Correction: -92.89% Decline Into Accumulation Phase
HTF Demand Zone: $0.18–$0.13 (Accumulation & Liquidity Absorption)
Reclaim Zone: $0.4374 (Trend Confirmation Area)
Bull Market Expansion Targets: $1.20 → $3 → $5 → $10+ (Full Cycle Expansion Projection)
This $0.18–$0.13 Zone May Be The Last Accumulation Opportunity For ADA Bulls Before The Next Parabolic Phase.
Invalidation: Weekly Close Below $0.13
Disclaimer: This Is TA Only. Not Financial Advice. Always Do Your Own Research And Manage Risk.

$DOGE at the EXACT Level That Triggered 17,000% Pump - Repeat?CRYPTOCAP:DOGE at the EXACT Level That Triggered 17,000% Pump - History About to Repeat? 🚀
They Laughed at $0.003
They Sold at $0.10
They’ll FOMO above $1.00+
This Weekly / 2W Chart is Screaming Accumulation:
✅ Macro Demand Zone Holding at $0.10–$0.06
✅ Price Respects a Multi-Year Strong Support (Since 2021)
✅ -87% Down From ATH - Classic Cycle Reset
✅ Every Previous Touch of This Zone Led to a Parabolic Expansion
Historical Proof:
2021 Rally: +17,000%
2024 Rally: +600%
Current Phase: Re-Accumulation Before Expansion
CryptoPatel CRYPTOCAP:DOGE Targets: $0.50 → $1.50 → $4.00 (Full Cycle Extension ~5,500%)
❌ Invalidation: Weekly Close Below $0.06
Smart Money Accumulates When Sentiment Is Dead.
Retail Buys When Price Is Vertical.
LONG-TERM FUNDAMENTAL CATALYST (DON’T IGNORE THIS) 🚀
Elon Musk has Confirmed that SpaceX Plans to Send a Literal Dogecoin to the Moon 🐕
How Many #DOGE Believers See $1+ This Cycle? 👇
❤️ LIKE if You’re Bullish
🔁 SHARE if You’re Holding
💬 COMMENT “DOGE” if You’re Not Selling 🚀
ALWAYS DYOR, This is Not Financial Advice
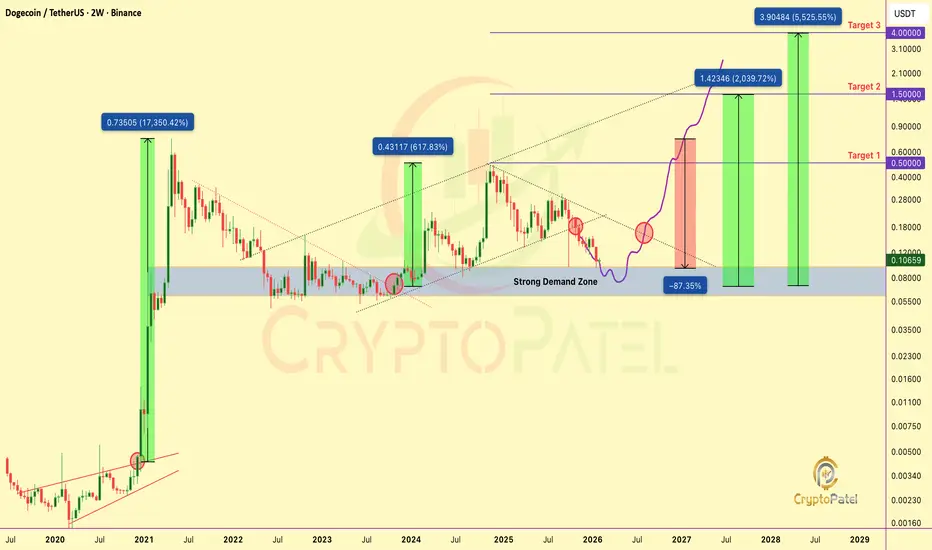
Chart Nobody Is Watching: BTC.D Could Trigger Biggest AltseasonThe Chart Nobody Is Watching: BTC.D Could Trigger The Biggest Altseason
Bitcoin Dominance (BTC.D) is currently trading at a major HTF distribution zone after printing a cycle high near 66%. Price faced a strong rejection from a Bearish Order Block + Fair Value Gap, confirming supply presence and bearish structural shift.
Technical Structure (HTF):
Cycle high formed at 66% (HTF supply zone)
Clear rejection from Bearish OB + FVG
Support trendline broken
Bearish retest completed near 60%
Structure remains bearish below 60–62%
BTC.D Downside Projection:
50–48% (first expansion zone)
44% (major HTF support)
40% (historical altseason peak zone)
A sustained move toward the 44–40% region has historically aligned with aggressive capital rotation from Bitcoin into altcoins, often marking the beginning of major altcoin expansion phases.
Invalidation: HTF close above 66%
This analysis is based purely on market structure and HTF supply/demand dynamics.
Just my personal view. Not financial or investment advice. Always do your own research.

POL/USDT MACRO SETUP | 1700%+ POTENTIAL IF HTF STRUCTURE HOLDSPOL is currently trading within a major higher-timeframe accumulation zone after a prolonged downtrend from the 2024 highs. Price is building a long-term base inside a falling wedge / descending channel, a structure that often precedes macro trend reversals.
Technical Structure
• HTF demand holding at $0.13 – $0.10
• Price compression near multi-year lows, indicating seller exhaustion
• Falling wedge approaching maturity (bullish reversal pattern)
• Macro structure remains valid above 0.097 (HTF close)
• A break and acceptance above ~0.17 is required for bullish confirmation
Expansion Targets (HTF): $0.286 / $0.435 / $0.704 / $1.20 / $2.00+
This presents a high risk-to-reward positional setup if HTF demand continues to hold and a confirmed breakout occurs with volume.
Invalidation: HTF close below $0.097
This analysis is for educational purposes only.
Not financial advice. Always do your own research.

$SAND MACRO SETUP | 7,800%+ CYCLE EXPANSION IF HTF DEMAND HOLDSCSE:SAND Is Trading At A Major HTF Accumulation Zone After A ~99% Decline From ATH, Forming A Long-Term Base Inside A Multi-Year Descending Channel.
Technical Structure:
• Strong Demand Holding At $0.14 – $0.11
• Price Reacting From HTF Trendline Support
• Structure Remains Valid Above $0.10 (HTF Close)
• Break Above $0.22 – $0.26 Required For Bullish Continuation
Expansion Targets (HTF): $0.65 → $1.50 → $3.50 → $8.48+ (ATH Zone)
This Remains A High R:R Macro Setup If HTF Demand Holds And Price Breaks The Descending Channel.
Invalidation:
HTF Close Below $0.10 Opens Downside Toward $0.05 – $0.035, The Last Major Bullish Order Block.
TA Only. Not Financial Advice. DYOR.

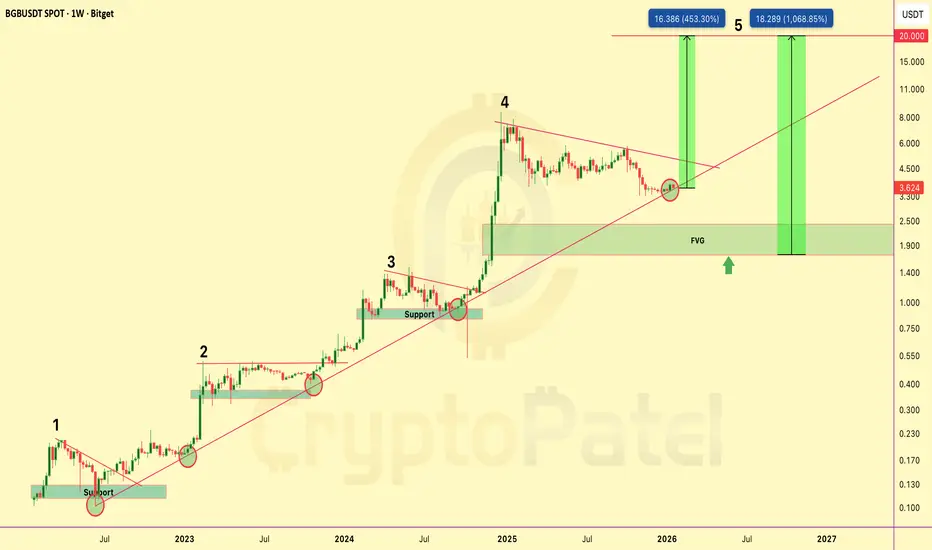
$BGB PRICE PREDICTION | 450%–1000% POTENTIALBGB is trading inside a well-defined long-term rising channel on the weekly timeframe, respecting bullish market structure since 2022.
Price has completed a full accumulation → expansion cycle and is currently undergoing a healthy corrective phase before the next impulsive move.
Technical Structure
Long-term ascending trendline remains intact
Clear 5-wave Elliott structure on HTF
Wave 4 correction following a strong impulsive expansion
Price reacting from dynamic channel support
HTF Fair Value Gap (FVG): $2.40 – $1.70
Bullish structure maintained above $3.40
Upside Targets (Wave 5 Extension)
$10
$15
$20
Alternative Scenario
If price breaks below $3.40 and an HTF candle closes below this level, there is a high probability of a move toward the $2.00 support and HTF FVG zone, which would represent a strong long-term accumulation area rather than trend invalidation.
Bias & Invalidation
As long as BGB/USDT holds above the rising channel support, the macro bullish bias remains intact.
Invalidation: Weekly close below the rising channel.
Technical analysis only. Not financial advice. DYOR.
$ASTER PRICE PREDICTION | HTF ACCUMULATION | 2400% MACRO POTENT?SEED_WANDERIN_JIMZIP900:ASTER is currently trading inside a high-timeframe accumulation base after a prolonged downtrend.
Price compression near major demand suggests trend exhaustion and a potential volatility expansion ahead.
Market Structure Overview
✅ Prolonged downtrend → exhaustion phase
✅ HTF accumulation forming
✅ Descending trendline pressure building
✅ Volatility compression → expansion setup
SEED_WANDERIN_JIMZIP900:ASTER is already ~78% down from its September 2025 ATH, significantly improving risk–reward for long-term positioning.
Key Accumulation Zones
Zone 1: $0.70 – $0.60 ✅ (Filled – bounce expected)
Zone 2 (Macro flush scenario): $0.45 – $0.35
→ Strong long-term accumulation zone if broader market weakness persists
Upside Targets (CryptoPatel View)
$1.50 → $2.00 → $5.00 → $10.00 → $20.00
Macro extension: $20 – $30 (long-term, high-risk / high-reward)
Invalidation: Loss of HTF demand structure → High-risk hold
Market Talk
As per public disclosures circulating on 2 Nov 2025, CZ was reportedly exposed to SEED_WANDERIN_JIMZIP900:ASTER below ~$0.91, holding approximately 2.09M ASTER.
While not a signal, this adds sentiment confidence to the long-term accumulation narrative.
Long-Term Thesis
This phase appears to be early accumulation, not confirmation.
If HTF demand holds and structure flips bullish, $5–$10 becomes realistic, with $20+ as a full-cycle expansion scenario.
Disclaimer:
This is technical analysis & market discussion only — not financial advice.
Always manage risk and do your own research.

Altseason 2026 Will Be Bigger Than 2017 & 2021 Combined Altseason 2026 Will Be Bigger Than 2017 & 2021 Combined 🚀
OTHERS/BTC (Altcoins Vs Bitcoin) Is Back At The Same Support Level That Triggered Every Major Altcoin Cycle.
2017: +423% Rally
2021: +503% Rally
2026: ~702% Projected Move
Every Cycle This Ratio Bounces, Small Caps Go Parabolic And 10x–100x Opportunities Are Born.
The Only Question That Matters Now:
Are You Early Or Too Late?
NFa & Always DYOR

$TON BREAKOUT SETUP | MACRO CHANNEL TARGET $30 | CRYPTOPATELLSE:TON / USDT: Weekly Price Forecast | CryptoPatel
TON is trading at a major HTF support confluence on the weekly timeframe after a prolonged corrective move from the 2024 highs.
Technical Structure:
Price continues to respect a macro ascending channel in play since 2022. Within this structure, TON has been correcting inside a descending channel from the ~$8 high, indicating a controlled correction rather than trend failure.
The current price is reacting from the lower boundary of the descending channel, which also aligns with long-term ascending trendline support — a key accumulation zone historically.
Key Levels & Confirmation:
• Weekly close above $2.70 = descending channel breakout
• Reclaim of $3.50 = bullish trend resumption
• Measured move projects toward $28–$30 zone (upper macro channel)
Targets: $3.50 → $7 → $15 → $30+
Invalidation: Weekly close below $1.20
This is a high time-frame accumulation setup with asymmetric risk-reward, best suited for spot and long-term positioning.
TA Only. Not Financial Advice. Always Manage Risk.

ETH UNDER PRESSURE - BREAKDOWN Ethereum slipped below the $3,000 support, following heavy selling in spot ETH ETFs. Net outflows hit $224.7M in a single day, the largest exit in weeks, extending total ETF selling to $286.5M over the past three days. Notably, BlackRock and Grayscale led the withdrawals, with zero inflows recorded across funds.
This breakdown triggered a liquidation cascade, wiping out nearly $168M in ETH long positions and driving price down toward the $2,895 zone.
📉 Technical View:
ETH remains under bearish pressure, forming a bearish flag while a confirmed death cross keeps downside risk elevated. Unless price reclaims resistance near $3,170, the structure points toward a potential move to the $2,620 support zone.
⚠️ Market Takeaway:
Momentum favors the downside for now. Bulls need a strong reclaim of key resistance to shift sentiment — otherwise, volatility remains skewed against longs.

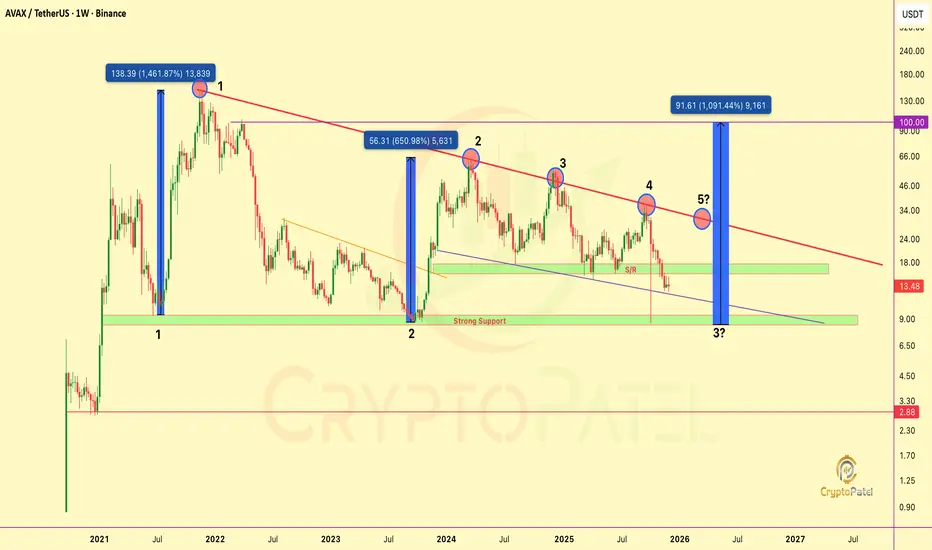
$AVAX on the Edge — $100 Breakout or $3 Crash?CRYPTOCAP:AVAX Is Approaching a Critical Technical Turning Point: Here’s What the Chart Really Shows
#AVAX is currently trading in a bearish market structure, but the chart is setting up for a major decision zone that could define its long-term trajectory.
Major Resistance Pressure Building
AVAX has tapped the Red trendline resistance 4 times, creating a historically strong barrier.
However, repeated tests have weakened the level, and the next approach, the 5th attempt near the $30 region, carries a significantly higher probability of a breakout.
A confirmed breakout here could shift momentum aggressively, opening the path toward the $100 zone.
Bearish Structure Still Dominant
Price has already lost key support and continues to trade below the $16–$17 zone, which has now flipped into resistance.
This is the first structure level bulls must reclaim to regain momentum.
High-Probability Accumulation Zone
The $10–$8 support zone remains the most critical area on the chart:
👉 June 2021: +1461% rally from this zone.
👉 September 2023: +650% rally within six months.
If AVAX revisits this zone again, it would represent the 3rd historical test, which has previously acted as a powerful accumulation region and could offer strong long-term upside potential.
Critical Breakdown Level
A loss of the $8 support would invalidate the bullish structure and expose AVAX to a potential freefall toward $3–$2, where no major historical support exists.
This is a pure technical-analysis view. Not financial advice. Always DYOR.
$BCH hasn’t hit a new ATH since 2017: Dead or Utimate Sleeper?SET:BCH hasn’t hit a new ATH since 2017: Dead or the Utimate Sleeper?
SET:BCH ATH: $4,212 (Dec 2017)
CRYPTOCAP:BTC ATHs: $19,800 (Dec 2017), $69,000 (2021), $126,000 (2025)
Observation:
SET:BCH hasn’t touched a new ATH since 2017.
CRYPTOCAP:BTC surged 6x+ after 2017 ATH, but SET:BCH stalled.
Is SET:BCH dead ❓
Key TA Levels:
🔹 Strong accumulation zone: $465 – $375
🔹 Critical support: $375 (holding this is essential)
🔹 Potential upside: $2,000 – $4,000 if momentum returns
Eyes on these levels. SET:BCH could be a sleeper play if it reclaims support.
Pro Tip: Patience + volume confirmation = key before any breakout.
NFA & DYOR

Biggest Altseason 10x-20x Loading for 2026?If You're Panicking Right Now, You're About To Miss The Easiest 5x-20x Of Your Life
The Total Market Cap (excluding BTC & ETH) just painted a picture we've seen before...
HISTORICAL CONTEXT:
Last bull run → 1200% pump after breakout & retest
Current situation → Long-term trendline support broken
This looks like a classic liquidity sweep before the next major leg up.
KEY LEVELS TO WATCH:
🔴 Strong Support: $750B - $600B
🟡 Strong Resistance: $1.1T
🟢 2026 Target: $4.25T
THE MATH:
If we hit that Target, we're looking at a 5x on total alt market cap
Individual Altcoins could Easily do:
Quality projects: 5x-10x
High potential gems: 10x-20x
Moonshots: Beyond 20x
MY TAKE:
This current "Crash" is NOT the beginning of a Bear Market. It's a shakeout. Big money is accumulating while retail panics.
The setup is almost identical to previous cycles:
✅ Panic selling at support
✅ Fear at maximum levels
✅ Long-term holders getting shaken out
This is exactly when you want to be positioning for the REAL altseason ahead.
RISK MANAGEMENT:
DCA at support zones ($750B-$600B)
Don't go all-in at once
Keep some powder dry for further dips
Focus on fundamentally strong projects
The biggest gains come to those who stay calm when others panic.
Are you ready for what's coming? 🚀
Not financial advice. DYOR. Manage your risk.

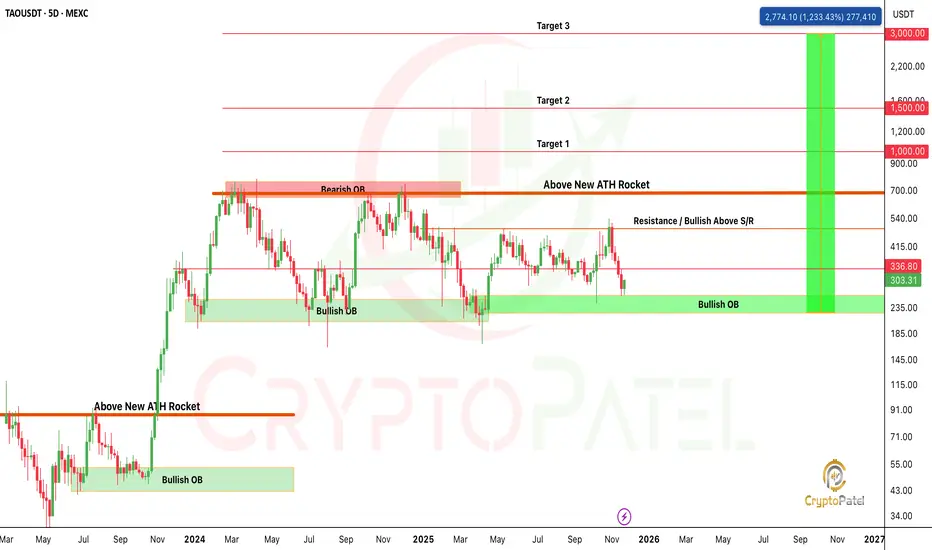
$TAO HTF SMC: Who’s Ready for the $1,000+ Expansion?GETTEX:TAO HTF SMC: Who’s Ready for the $1,000+ Expansion?
Price continues to respect the HTF Bullish Order Block (OB) at $235–$185, which remains the primary demand zone maintaining bullish order flow. Each mitigation of this OB has previously generated strong displacement to the upside, confirming active institutional interest.
The current range is defined by:
🔹 HTF Demand (Bullish OB): $235–$185
🔹 Mid-Range S/R: $540
🔹 HTF Supply (Bearish OB): $640–$700
A decisive close above $540 S/R will shift the internal structure bullish and validate a premium re-pricing phase targeting the HTF Supply at $640–$700.
A clean break of structure (BOS) above $700, combined with a displacement candle, will confirm HTF trend continuation and open up extended liquidity targets:
Target 1: $1,000
Target 2: $1,500
Target 3: $3,000
As long as price maintains the $235 Bullish OB, the HTF narrative remains bullish, with expectation of a sweep of upper-side liquidity and expansion toward unmitigated supply zones.
NFA & DYOR
BITCOIN JUST DID EXACTLY WHAT WE DISCUSSED: CURRENT UPDATEBITCOIN JUST DID EXACTLY WHAT WE DISCUSSED: CURRENT UPDATE
CRYPTOCAP:BTC bounced perfectly from the 0.786 Fib ($83,308), The FINAL bullish support.
Now trading above $86,500, already +5–6% up from the exact level I alerted.
As long as BTC holds $83,308, upside relief rally remains active:
$88,000 (FVG)
$93,000 (Bearish OB)
$98,000 (FVG inefficiency)
But… if BTC loses $83,000, say hello to the $66,000 demand zone, The next real bullish orderflow.
For now: Structure is bullish above 0.786, cautious below it.
(NFA / DYOR)

$PEPE BREAKDOWN: 70% Dump? SMC Says YESCRYPTOCAP:PEPE BREAKDOWN (READ THIS BEFORE YOU SCROLL): 70% Dump? SMC Says YES
Price has broken the long-term support at $0.0000059 and that level is now strong resistance.
Until PEPE reclaims this zone, trend stays bearish.
SMC Structure
HTF Demand swept + Weekly FVG filled
Liquidity taken below multi-month lows
Support → Resistance flip at $0.0000059
Below this = continuation sell-side liquidity hunt
Downside Expectation
If price rejects from the new resistance, PEPE still has room for 60–70% downside.
That drop would hit the HTF Accumulation Zone → $0.00000178
(High-value area where Smart Money positions.)
Fractal Outlook
Last time PEPE entered this structure → 4650% bull run.
Same HTF pattern forming again.
If PEPE drops 40%–70%, that’s where long-term money accumulates for the next big move.
Reclaim $0.0000059 = bullish reversal
Stay below = deeper accumulation incoming
HTF structure is not bearish forever, It’s preparing the next expansion. Watch the reclaim.
NFA & DYOR

Bitcoin Death Cross AlertBitcoin Death Cross Alert
Over the past year, every death cross on BTC has marked a clean local bottom and triggered strong upside reversal.
But remember 2022: That same signal ignited a full-scale bear market.
A fresh death cross just printed on the chart…
So What are we Looking at this time, Another Bottom Forming, or the start of a deeper Bleed?
NFA & DYOR

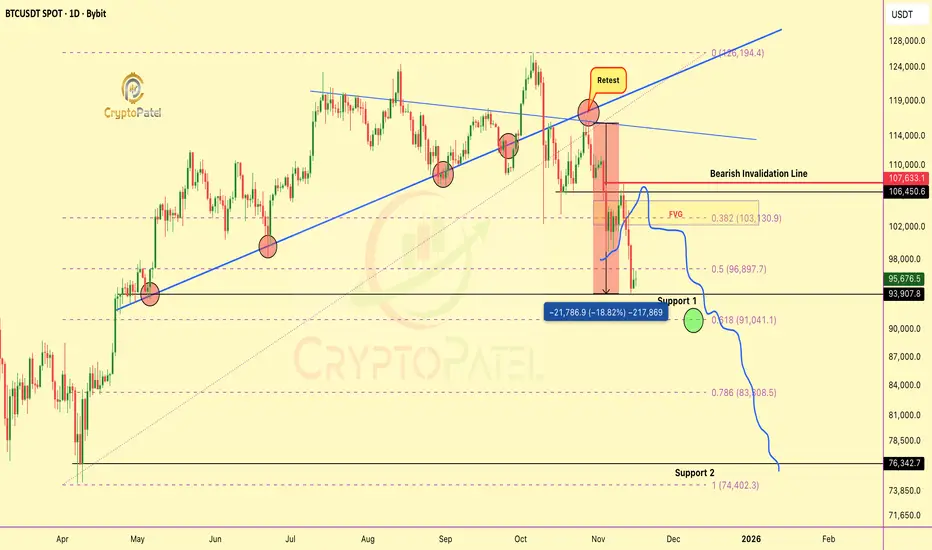
#BTC Technical Update: Structure Playing Out With Precision#BTC Technical Update: Structure Playing Out With Precision
CRYPTOCAP:BTC has tapped the $95K zone, completing the corrective leg projected when price was rejecting the $115K–$110K range.
Key downside levels already reached:
➡️ $105K ✔️
➡️ $93K ✔️
As long as price fails to break and close above $107,500, the bearish structure remains intact and the next liquidity target becomes: $73K
A confirmed close above $107.5K invalidates the bearish leg and reopens the path toward a new ATH.
Critical zones to watch:
➡️ 0.5 FIB — structural reaction level
➡️ 0.618 FIB — high-probability reversal pocket
🔻 Bearish below $107.5K
🔺 Bullish above $107.5K
Price is respecting structure with accuracy.
Charts > emotions. Levels > noise.
NFA & DYOR
THETA Monthly Chart Just Entered Its Most Dangerous ZoneTHETA Monthly Chart Just Entered Its Most Dangerous Zone
THETA is testing one of the most crucial zones on the entire macro structure. After a long decline from the 2021 high of 15.686, the market is pressing into levels that will determine whether a major reversal or deeper downside unfolds.
*Major Resistance Zones*
🔹 0.60 to 0.80 acting as a heavy supply region
🔹 Long term descending trendline still suppressing price
🔹 Monthly EMA cluster maintaining strong overhead pressure
🔹 These levels continue to reject any attempt at reclaiming momentum.
*Key Support Zones*
🔹 0.40 to 0.47 acting as the immediate defense
🔹 0.30 to 0.20 forming the most important macro support
🔹 0.25 to 0.35 also aligning with strong historical demand
🔹 This lower block is the zone that can define the next multi month trend.
*Price Action Snapshot*
🔹 The 0.60 to 0.80 zone has fully flipped into resistance
🔹 Current bullish order block invalidated and structure remains weak
🔹 Monthly candle is down more than 8 percent with fading volume
🔹 Sellers remain in control while buyers show limited strength
🔹 The market is in distribution below resistance and drifting toward major demand.
*Potential Bullish Scenario*
If THETA holds the deeper order block at 0.30 to 0.20, a large upward rally becomes possible.
A strong bounce from this zone opens upside targets toward 1 to 2.
If price later holds above 2, the macro structure supports a long term push back toward the 15 region.
This makes the 0.30 to 0.20 range the most critical accumulation zone on the entire chart. Keep close attention to how price behaves here.
*Directional Bias*
🔹 Bearish while below 0.60
🔹 Break of 0.40 confirms continuation into the deeper demand.
Bullish only with a monthly close above 0.60
Reclaiming that level begins a structural shift.
*Risk Note*
This is a high impact decision zone. Market reaction here will determine the next major leg. Manage exposure with discipline. NFA. DYOR.

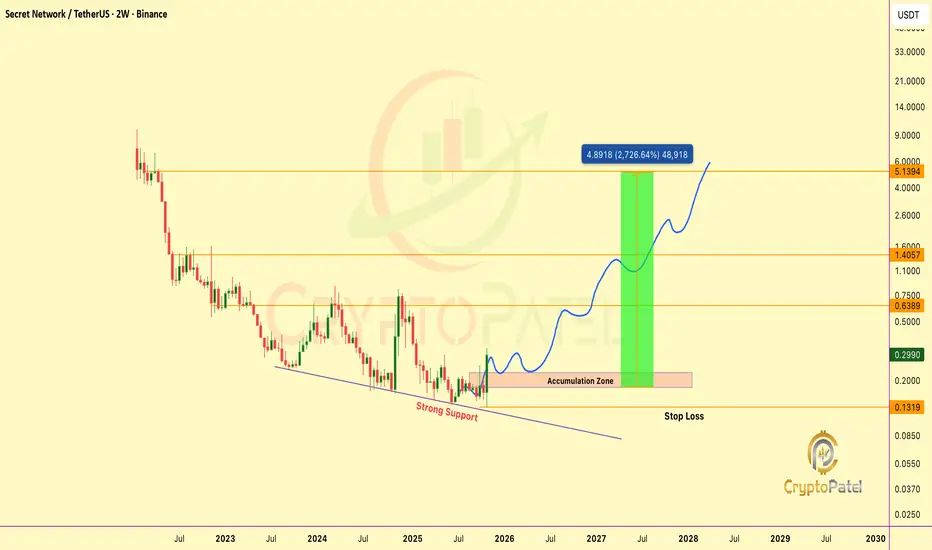
The calm before the storm… $SCRT is getting ready to flyThe calm before the storm… $SCRT is getting ready to fly
#SCRT is showing a strong technical reversal from its multi-year support, forming a clean accumulation base that signals smart money loading up.
Best Accumulation Zone (IMO): $0.24 – $0.18
Once this range holds, we could see a massive breakout kicking off a new macro bull cycle.
Targets:
$0.64 → $1.40 → $5.13+ 🚀
If momentum builds and the team keeps delivering, $5–$10 is possible in the future. This setup is low-risk, high-reward, but always manage your risk, charts show probability, not guarantees.
Smart accumulation today could turn into huge gains tomorrow.
⚠️ Not financial advice. Always DYOR & manage your risk.
Will ICP/USDT hit $50 in current but market Like ZEC?CRYPTOCAP:BTC & CRYPTOCAP:ETH are dumping, but CRYPTOCAP:ICP is quietly printing history in the making.
Strong support $3, next target $50 if it holds.
Repeating 2022–2023 patterns, but bigger & faster. Could rival CRYPTOCAP:ZEC ’s moon run 🚀
NFA & DYOR
