Ambuja Cement Chart Analysis with Confirm Targets 2025 Cement Industry: A Strong Pillar of India’s Growing Economy
India remains the world’s second-largest cement producer as of 2025, and the pace of its growth continues to accelerate.
The demand for cement has surged due to infrastructure development projects such as housing construction, road expansion, railways, metro projects, and Smart Cities initiatives.
To boost infrastructure development, the Indian government has announced an interest-free assistance package of approximately ₹1.5 lakh crore.
Schemes like "Housing for All" and rural-urban housing programs have intensified construction activities across the country.
In this dynamic environment, the cement sector is receiving solid support and is expected to grow significantly in the coming years.
Ambuja Cement Company Profile
Ambuja Cements is one of India’s leading cement companies, established in 1983. It is now a part of the **Adani Group, a diversified and rapidly expanding conglomerate. The company primarily manufactures and sells grey cement and ready-mix concrete (RMC).
As the Smart City Mission, metro rail networks, expressways, flyovers, and industrial corridors progress rapidly, cement consumption continues to rise. Several large-scale cement road and railway infrastructure projects are underway across the country, expected to sustain the sector’s momentum over the next few years.
Ambuja Cement Technical Analysis
Major Resistance Zone: ₹590 – ₹700
₹590 acts as a strong resistance level, where the stock has previously faced multiple rejections.
A weekly candle closing above ₹590 would signal a strong bullish breakout.
Once this level is breached convincingly, the stock may **quickly move towards ₹700, testing its previous all-time high.
Trading Plan:
1.If the stock gives a weekly close above ₹590, it could be a buy signal.
2. The next potential target would be ₹700** based on the breakout confirmation.
Strong Demand Zone: ₹450 – ₹460
Significance of this zone:
1.The range of ₹450–₹460 has consistently shown bounce-back behavior, indicating strong buying interest.
2.Swing traders and investors** can consider accumulating when the stock nears this zone, as historical data shows this level has acted as **strong support**.
Stop-loss Strategy:
If any **weekly candle closes below ₹445, it could indicate a breakdown of support, and exiting the position would be advisable.
Support Zone Trading Plan
If the stock drops to ₹450–₹460 and **buying volume** increases, it could present a good buying opportunity.
Short-Term Potential Targets
First Target: ₹578
Second Target: ₹640
Manoj Strengthen Support – ₹413.50
The level of ₹413.50 is recognized on the chart as a strong psychological and emotional support, named “Manoj Strengthen Support.”
Why is this level important?
1. In case of a sudden market correction due to war, global recession, or political instability, this level may act as a temporary strong support.
2. It may prevent further decline and hold price levels in such events.
Investor Tip:
1. If the stock declines but this level holds, it becomes a **critical risk-management zone**.
2. Investors can look for potential **bounce-back** opportunities and strengthen their conviction around this level.
Ambuja Cement Long-Term Targets (2025–2028)
The long-term structure of Ambuja Cement appears bullish, and based on technical charts, the following major targets have been identified:
First Target: ₹700
Expected during 2025–26 if the stock gives a strong closing confirmation above ₹590.
Second Target: ₹840
If the stock decisively breaks above ₹700 (its all-time high), this target could be achievable in 2026.
Third Target: ₹1040
In the long term, if the stock sustains above ₹840, a move towards ₹1040 is likely by 2027–2028.
This analysis is based on technical breakouts, price action, and support-resistance principles, and can serve as a strategic guideline for long-term investors.
Ambujacements

Ambuja Cements - Levels to watchAs market mood is choppy and result season is approaching soon
Its important to note the upcoming important levels for Ambuja Cements
Recently the stock gave a good rally but is now approaching towards its first strong resistance level of 590
Post that it has 2 more strong upside resistance at 610 and 635
Downside right now the nearest and strongest support levels are at 530 - 515 - 485
Take confirmation bias from lower Tf before entering any trade & play accordingly

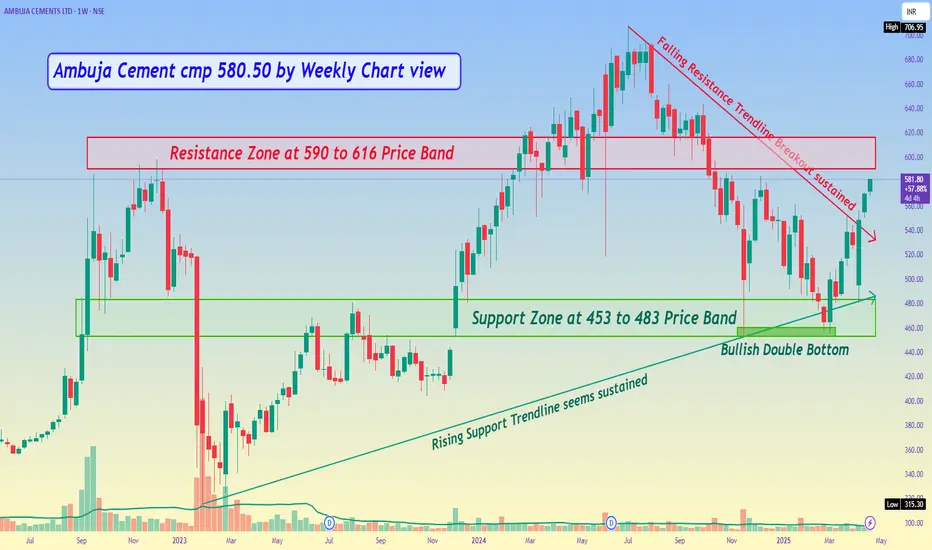
Ambuja Cement cmp 580.50 by Weekly Chart viewAmbuja Cement cmp 580.50 by Weekly Chart view
- Support Zone at 453 to 483 Price Band
- Resistance Zone at 590 to 616 Price Band
- Rising Support Trendline seems sustained
- Bullish Double Bottom formed at Support Zone
- Falling Resistance Trendline Breakout is sustained
- Volumes are getting in close sync with avg traded quantity
- Bullish Rounding Bottom in completion stage at Resistance Zone neckline with Support Zone as base
*Ambuja Cement cmp 634 by Monthly Chart views since listed* *Ambuja Cement cmp 634 by Monthly Chart views since listed*
- Add the stock to your watchlist and Keep it on radar for new ATH Milestone in the making process
- *A Blast from the past to ponder upon. Is it like History going to repeat itself with the Rising Parallel Price Channel continuation ?*

AMBUJA CEMENTS 1H TFLooking good for short opportunities once the trendline is broken can give a nice momentum as it's been a buying trendline.
Please do follow me for more such trades nd do check out my previous analysis.

AMBUJA CEMENTS | GOOD INVESTMENT BETAmbuja Cement looks a good bet for investment, we saw a great rally in Cement Stocks but this couldn't perform because of Adani Saga.
To motivate us, Please like the idea If you agree with the analysis.
Happy Trading!
InvestPro India Team

AMBJUA CEMENT #LONG As you can see, the Red candle that formed today didn't have many sellers to drive the stock down. & it maintained right on the top side of the trendline, hinting for a higher breakout chance.
Wait for Adani to break out, and this will stock will too!

Ambuja cementAmbuja cement
415 above sustain 10 minutes candle then buy intraday
(why buy logic SL HUnting Technic many seller stop loss put above 415 above market break Then buy)
+ trendline support,okh
Condition Apply only 415 above

AMBUJACEM @ 349 - Analysis on 20-Feb-2023AMBUJACEM @ 349 - Analysis on 20-Feb-2023
As long as 271/132 holds support, We can see 586, 777-823, 1089-1133 in the long run.

Ambuja CementCompany's Strength :-
Effectively using its capital to generate profit - RoCE improving in last 2 years
Effectively using Shareholders fund - Return on equity (ROE) improving since last 2 year
Efficient in managing Assets to generate Profits - ROA improving since last 2 year
Company with Low Debt
Strong cash generating ability from core business - Improving Cash Flow from operation for last 2 years
Annual Net Profits improving for last 2 years
Company with Zero Promoter Pledge
Company with decreasing Promoter pledge
FII / FPI or Institutions increasing their shareholding
indicates Strong Financials
3 year CAGR growth
Revenue 3.5%
NetProfit 8.5%
OperatingProfit 15.7%
Promoters released all pledges in Dec 2022 qtr.
Promoters holding remains unchanged at 63.22% in Dec 2022 qtr
Mutual Funds have increased holdings from 7.37% to 7.79% in Dec 2022 qtr.
Number of MF schemes increased from 44 to 46 in Dec 2022 qtr.

AMBUJA CEMENTS - 14.11.22 - DAY CHART - BAHAVAN CAPITAL AMBUJA CEMENTS as per day chart analysis Stock ABOVE 587 TARGET 600.
Happy profitable trading to all...

AMBUJA CEMENTS -DAY - 27.10.22 - BREAKOUT - BAHAVAN CAPITALAMBUJA CEMENTS as per day chart has given a breakout and Above 534 then Target 544.
Happy Profitable Trading to all...

Ambuja Cement giving a break down of Head and Shoulder.The stock has given a nice break down of the Head and shoulder pattern.
The markets are in the negative and the stock has given 40% (approx) returns in 30-35 days time.
Stock has broken the neck line of the of the pattern and closed below it.
The stock has closed below its 50% Fibonnaci levels.
Wait for the stock to retest the price level of the neck line and watch for the price action near the levels for shorting the stock.
The targets and Stop loss are mentioned in the chart.
An intraday and swing trade can be initiated in the stock.
Wait and watch the candlestick pattern for carrying on the trade.

Ambuja Cements - Weekly Chart Add on a weekly close above 465. Further strong if we get a monthly close above this level.

Ambuja Cements is looking bullish and getting ready for breakoutAmbuja Cements is looking bullish and getting ready for breakout.
Expecting 420/460 levels in coming sessions

AMBUJACEM : Triangle patternAMBUJACEM : Triangle pattern
its trading at triangle patter on daily time frame. also given breakout of Hourly triangle.
Its good to me near retest level of hourly TF & near support. Risk reward ratio is favaroble.
I will wait for bullish Candle near support.
Like, Share, Comment for regular updates.
Disclaimer
I am not sebi registered analyst
My studies are Educational purpose only
Please consult with your Financial advisor before trading or investing


Ambuja Cement Chart Analysis !!📈 Ambuja Cement Ltd. 📉
My Findings :-
1. Breakout from a Swing High.
2. Close Above March 2022 High.
Bias - Long
Target - 350, 383, 408, 431 and 442
SL - 292
RR- 1:4
All Important Supports and Resistances are drawn in chart. All levels are on closing basis.
Please have a look and revert back if you need some more study on it.
Disclaimer : Consult Your Financial Advisor Before Taking Any Decision On This Analysis.

AMBUJACEM Blast, further level marked !!NSE:AMBUJACEM
#NSE:AMBUJACEM level shared @ 340 and now trading @ 365, 8% up move registered,
marked further levels for practice.
Happy LEarning !!
Check my signature column for all the charts shared today, and the practice was damn good with blasting results.
Trust me, you will not regret for checking these charts.
We also welcome your feed back on my direct chat available in below signature column 👇 down side to this chart.
If you feel good analysis don’t hesitate to like and share.

Simple Trade Setup | AMBUJACEMENT | 23-09-2021NSE:AMBUJACEM
Trade Setup for Date 23-09-2021:
1) Don't Jump in to trade at the beginning of the market. Let it get settle for 15-20min first and judge the price action.
2) Everything is mentioned on the chart. I hope it is easy to understand.
3) All the levels will work as support, resistance, entry and exit w.r.t price action near that level.
4) Avoid gap up or gap down chase. Wait and trade between levels.
Please refer below chart for levels.
Hope I made it easy to understand it.
Do comment your doubt or suggestion.
Note: Trade with Strict SL. It may or may not hit all the levels. So one can book profit / loss at respsective level considering how price action works near that level.

AMBUJACEM trend analysis AMBUJACEM
bullish price move
expect to minor target first when break the minor target and histroical primary resistanceline goto all time high histroical target

Simple Trade Setup| AMBUJA CEMENT | 30-08-2021NSE:AMBUJACEM
Observations:
1) On Daily time frame it reversal and break 21DMA and closed above it. But it is below it's nearest resistance range of 410-415.
Please refer below chart : daily time frame.
2) On 1hr time frame, you can see this resistance range 410-415 giving resistance multiple time and only one time it has broke it but couldn't able to stay above it.
And now it is critical moment for this, if it breaks this range then it will be good upmove but if it fails then again there will be down move.
Please refer below chart: 1hr time frame.
-------------------------------------
Trade Setup for Date 30-08-2021:
1) Don't Jump in to trade at the beginning of the market. Let it get settle for 15-20min first and judge the price action.
2) Everything is mentioned on the chart. I hope it is easy to understand.
3) All the levels will work as support, resistance, entry and exit w.r.t price action near that level tomorrow.
Please refer below chart for levels.
Hope I made it easy to understand it.
Do comment your doubt or suggestion.

AMBUJA Short Sell Retest. NSE:AMBUJACEM has formed a triangle and gave a breakdown. It has again come for retest now. Has good risk to reward.
