Aditya Birla Sun Life AMC-Built to Compound, Poised to BreakoutNSE:ABSLAMC
🔹 Fundamental Overview
Business Strength—One of India’s leading asset management companies, part of the Aditya Birla Group; operates across mutual funds, PMS, and AIF segments.
Financial Health – Debt-free balance sheet with excellent profitability and high cash reserves.
Profitability Metrics – ROE around 28%, ROA near 25%, and net margins above 50%, indicating strong operational efficiency.
Growth Trend – Revenue and net profit are both growing at ~20–25% YoY, supported by rising AUM and stable fee income.
Valuation—Trades near 24× P/E and 6–7× P/B; premium valuation justified by brand strength and consistency, but limits margin of safety.
Dividend Policy – Moderate yield (~1.5–1.7%) with regular payouts; good for long-term income seekers.
Key Positives—Strong parentage, scalable business, high ROE, and steady market share gains.
Key Risks—Market-linked revenues, fee compression risk, and competition from passive products and fintechs.
🔹 Technical Overview
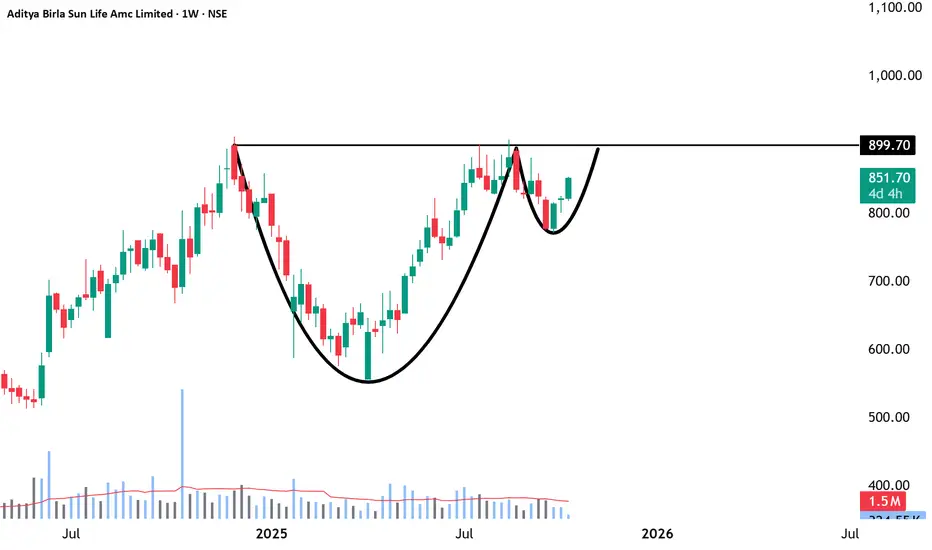
Trend Bias—The long-term trend remains bullish, with the price comfortably above the 50-DMA (₹838) and 200-DMA (₹748).
Momentum – RSI around 55–60, neutral to mildly positive; no overbought signs.
Trend Strength – ADX below 20 shows consolidation; potential for trend expansion if volume picks up.
Crucial Support Zone – ₹ 815 – ₹ 830; strong base for accumulation.
Resistance Zone – ₹ 854 – ₹ 860; a breakout above this range may trigger a sustained rally.
Long-Term Projection – 2,500+++ possible over 3–5 years in favorable market conditions.
Risk Control – Maintain stop-loss below ₹ 810 for long positions; trail profits once above ₹ 900.
🔹 Investor Takeaway
Outlook—Fundamentally robust, financially sound, and technically poised for breakout after consolidation.
Strategy—Ideal for gradual accumulation on dips and adding on confirmed breakouts above ₹ 860.
Time Horizon – Best suited for 1–5 year investors seeking stable compounding from a high-quality financial business.
========================
========================
⚠️ Disclaimer:
This analysis is for educational and informational purposes only.
We are not SEBI-registered analysts or advisors.
This is our personal view based on available data and market trends.
Please consult your SEBI-registered investment advisor before making any investment or trading decisions.
You are solely responsible for any financial decisions you make based on this content.
========================
Trade Secrets By Pratik
========================
AMC
UTI AMC - Trendline BreakoutCan go Long if the immediate resistance (Previous Gap) is taken out.
Or can wait for re-tracement and then go Long.
This is only for analysis.

XAUUSD Down Trend.!#XAUUSD Looking for Sell trade setup as I mentioned in the Chart.!
Keep Supporting LIKE, COMMENT And FOLLOW.!
Thank You.!

CADJPY Down Trend.!#CADJPY Looking for Sell trade setup as I mentioned in the Chart.!
Keep Supporting LIKE, COMMENT And FOLLOW.!
Thank You

25/04/2022 Research Report For ABSLAMCDisclaimer:
I am not SEBI registered person and this is not an investment advice and also please note this is only for education purpose. Also note we can use this research in my own portfolios. So don't influence yourself by this research. Please note before investing according to this educational research, please do own research and also do take advice from your financial adviser. Your any profits and loss are totally your liability. No one is liable for that. Also, please note we will not never compensate your any loss. So before investing any single rupee, please do your own research according to your risk taking capacity and after that do invest and book profits on right time.
Buy @ C.M.P (Current Market Price)
Target 1: More Then 1100
Compare ABSLAMC's Chart With UTIAMC's This Chart

HDFC AMC Right time to investmentHdfc amc is ready for up move
This week if break and close above 2490 then it purely ready for short-term investment
holding time may be 3 to 6 month for achieving target
Disclaimer : I am not recommend to buy, my prediction is based only technical,
all of them only educational purpose only

AMC Possible Continuation week of 11/29We have a breakout of the long term wedge and while that should have been enough to draw people in and propel the next leg up, volume lacked with an astounding 70% off-exchange volume percentage average for the week. Algorithms appear to be running the stock and I believe we will be repeating a breakout similar to the late August run to $52, in the coming trading days. Just an observation, NFA, I am long and holding with Diamond Hands.


18/10/2021 Research Report For HDFCAMCDisclaimer:
I am not SEBI registered person and this is not an investment advice and also please note this is only for education purpose. Also note we can use this research in my own portfolios. So don't influence yourself by this research. Please note before investing according to this educational research, please do own research and also do take advice from your financial adviser. Your any profits and loss are totally your liability. No one is liable for that. Also, please note we will not never compensate your any loss. So before investing any single rupee, please do your own research according to your risk taking capacity and after that do invest and book profits on right time.
Buy Below 2970
Target 1: 3267
Target 2: 3320


AMC price action analysisAMC's stock price corrected drastically after reaching all-time highs.
The bearish shark pattern correction seems to be completed and the hurdle is to break the trendline with huge volumes bouncing off of the demand zone.
The idea is neutral because there is a chance for collapse also. The breakdown below the demand zone completes descending triangle pattern. For the short covering move, it must cross and sustain the 48 price mark.
Patience is the key here. Wait for the confirmations to go long or short. For both long and short positions, targets are mentioned on the chart. Consider exiting at cost.
Happy trading.
This is not investment advice, Please consult your financial advisor before consulting.

Using the Trend-Based Fib Extension ToolThe Fibonacci ratios are widely used among traders to help identify potential areas of reversal in the movement of price action.
The Trend-based Fibonacci Extension tool utilizes three points on a previously identified trend in order to draw the Fib ratios on the chart.
In the chart above, price was rejected twice forming a double top which is a fairly strong reversal pattern. To help identify potential areas of support and resistance we have drawn a Trend-Based Fib Extension.
Using the double top patterns High, Low, and High as the three points for the Trend-Based Fib Extension, the Fibonacci ratios are drawn on the chart.
In this example, you can see that price action respected these levels very well until finding strong support at a potential bottom that corresponds with the 200% extension level.
But, notice the region in the yellow box on this chart. There seems to be no identified areas where the Fibonacci ratios show support or resistance.
While retrospectively we can tell that the area of support found at ~ $12 (141.4%) in mid-November 2017 did not produce a new bull market. At the time there was a potential reversal at that region resulting in higher highs and therefore we could have pulled a NEW Trend-Based Fib Extension as shown below.
As the new Trend-Based Fib Extension is identifying areas of a new uptrend, we see that these ares are shown in a way that they were not in the previously drawn Trend-Based Fib Extension.
However, price was rejected at the 61.8% level and continued downward until the 0% extension level was broken, thus invalidating this Trend-Based Fib Extension.
While the upward price trend did not continue, there was a local high that was made and thus could be utilized to create another Trend-Based Fib Extension to further identify areas of reversal for the continuing downtrend as shown below.
Looking at this newly created Trend-Based Fib Extension, we see that the areas moving down to the 78.6% extension level are very well respected, at which time the price found support, creating a triple bottom reversal pattern.
It is interesting to note that the 78.6% extension on this Trend-Based Fib Extension pull is at $1.82, and the 200% extension level from our first Trend-Based Fib Extension pull was at $1.95, a mere $0.13 difference in price.
This area where the two levels of a Trend-Based Fib Extension or Retracement group together is know as a Fib cluster and indicates areas of strong support or resistance.
With price forming a triple bottom and reversing from this level, is it possible that this is the bottom of this downtrend?
Could a new Trend-Based Fib Extension now be pulled from a new Low/High/Low to identify potential areas of support and resistance?
Give it a try and see what you find!

AMC can shoot till 26-28, this is in Wave3 of Wave3 of EWAs per Elliott waves, this is in wave3 of wave3, long way to go in this. Can buy and hold for targets. We might see AMC at 25-26 in short-term of 4-6 weeks of time.

AMC Long Idea Cup and Handle with Fib RetracementsAMC Consolidation on lower time frames has developed a nice Cup and handle Pattern on the Daily Chart. Looking to hold above the 0.5 for confirmation to see the 0.618 @ $13.31. Lots of options to keep an eye on this coming week with the sentiment leaning bullish. There is also news of Los Angeles AMC theaters opening Monday 3/15/2021, which can give AMC a push higher. AMC beyond the noise has risen a 100% in price within the last 30 day period. I would be looking for volume and price action Monday with a push higher. Dips will come but the potential long idea looks good. DD is important but not always factual. Please do not take this as trading advice, just my analysis based on chart pattern. Thank You and all feed back is welcome!

HDFC AMC v3As clearly analysed, it has been working and close to target 3 and finally 4. Please Hold patiently. i will update soon where are accumulation Phase

HDFC v3 FinalMy final targets are levels of 2000. Please short it and enjoy deep fall and if you have earned profit ftom my call all i need is a comment and a like! Lets see how it follows!


HDFC AMC , whats next ??? cooking up ???? Click to check HDFCAMC lower volumes as not before !
Need to wait before making any position but
CAN BE A SIP STOCK FOR SURE AS IT A AMC LEADER.

Motilal entring into side way trendI found this stock was falling from high value almost a year, the fundamentals are strong, this is a good stock for holding. If it bounce back and trades above 823 with a stable candle then the trader can enter into buy position.
