UPDATE ON "XAUUSD" BULLISH IDEA Symbol + Timeframes: XAUUSD— HTF (Daily) & ITF (H4)**
Bias: Bullish (as long as price holds above key DAILY FAIR VALUE GAP)
Structure: – Higher lows intact on HTF and SHORTS LIQUIDATED
– Intermediate pullbacks respecting demand zones
Key Levels: – Support: 4820.360
Context: – Price reacting to confluence (fair value gap + structural support)
Plan: – Look for corrective pullback to support for continuation setups , current buy setup would be inbetween 4820-4815.
– Targets based on structural levels - (I) 5090.890 (ii) 5567 (iii) 5599
This is analysis, not trade advice.
Analyse

XAUUSD ANALYSISI am posting a chart of XAUUSD this is the possible outcomes of the wave as per myview
3rd wave is completed and the current xauusd is in correction we can see abc correction on longterm as per trukit last wave now we can see trendline liquidity is need to be taken and in upcoming days we can see gold around 3820 from we can see 4-5wave as per my view.
Thanks

OVERVIEW GOLD CHART H1 11/21 🧭 1. CURRENT MARKET CONTEXT
Gold remains in a downtrend on the H1 timeframe, despite a minor rebound after the NFP release.
A sharp drop to 4,039 created a new low, followed by a weak recovery and sideways movement during the Asian session.
When the London session opened, price broke below the consolidation zone, confirming that sellers are still in control of the market.
Key highlights:
• The market remains bearish as long as price stays below 4,052–4,060
• Volume Profile shows VAL at 4,052 turning into a new resistance
• Intraday structure continues to form lower highs → maintaining the main downtrend
⸻
🔍 2. TECHNICAL ANALYSIS – H1
🔹 Trend overview
• H1: Clear bearish pattern with consecutive LL – LH.
Breakout from the Asian session sideways confirms the continuation of the downtrend.
🔹 Price action
• Asian session: Price consolidates after the sharp drop
• European session: Break below the sideways range → sellers continue to push
• All upward moves are just retracements – not a reversal
⸻
📌 3. IMPORTANT PRICE ZONES
🔥 Resistance zones (SELL priority)
• 4,040 – 4,052 → Strong intraday resistance
– Confluence of VAL, supply zone, and downtrend line
• 4,060 – 4,070 → For deeper pullbacks
🟩 Support zones (downside targets)
• 3,995 – 4,005 → Stronger support – extended target if selling momentum increases
⸻
🎯 4. TRADING SCENARIOS
🔻 Scenario 1 – Most important (priority)
SELL on pullback
If price retraces to 4,040 – 4,052 and shows rejection signals (M5/M15):
Sell zone: 4,040 – 4,052
TP: 4,025 → 4,010 → 3,995
SL: Above 4,060
🔻 Scenario 2 – Continuation after breaking the low
If price breaks 4,028 with a strong H1 candle close:
Sell continuation
TP: 4,010 → 3,995
SL: 4,045
🔻Scenario 3 – Only trigger on reversal structure
If price breaks & closes above 4,060, the structure weakens:
➡️Quick Buy: up to 4,075 → 4,092
(Only trade with strong signals – this is a counter-trend setup)
⸻
🥇 5. CONCLUSION
• Main trend: Down – SELL is preferred
• Best entry zone: 4,040 – 4,052 (strong confluence)
• Only Buy on a clear break above 4,060

Option Chain AnalysisChapter 1: Basics Refresher
1.1 What is an Option Chain?
An option chain (or option matrix) is a tabular display of all option contracts for a particular stock or index. It is split into two halves:
Left side → Call Options (CE)
Right side → Put Options (PE)
Middle → Strike Prices
For each strike, the chain shows data such as Open Interest (OI), Volume, Last Traded Price (LTP), Bid/Ask, Change in OI, and Implied Volatility (IV).
1.2 Why Do We Analyze It?
Option chain analysis provides traders with:
Market sentiment (bullish, bearish, or neutral).
Probable support and resistance levels.
Identification of fresh positions vs unwinding.
Volatility expectations.
Clues for strategy selection (directional or non-directional).
Chapter 2: Core Components in Option Chain Analysis
2.1 Open Interest (OI)
Represents outstanding contracts not yet squared off.
High OI at a strike → strong trader interest.
Change in OI indicates new positions or unwinding.
👉 Key use in analysis:
Highest Put OI → Likely support.
Highest Call OI → Likely resistance.
2.2 Volume
Shows contracts traded during the current session.
High Volume + Rising OI → New positions building up.
High Volume + Falling OI → Unwinding/covering.
2.3 Implied Volatility (IV)
Reflects expected volatility of the underlying.
High IV → Options expensive; suitable for option writing.
Low IV → Options cheaper; suitable for buying strategies.
2.4 Price (Premium) Movement
If premiums rise with OI → trend continuation.
If premiums fall with OI → trend weakening.
2.5 Put Call Ratio (PCR)
Formula: Total Put OI ÷ Total Call OI.
PCR > 1 → More puts → bullish bias.
PCR < 1 → More calls → bearish bias.
Chapter 3: Interpreting Option Chain Data
3.1 Support & Resistance Identification
Support: Strikes with highest Put OI (buyers willing to defend).
Resistance: Strikes with highest Call OI (sellers capping upside).
Example:
If NIFTY is at 20,000:
19,800 Put has highest OI → Support.
20,200 Call has highest OI → Resistance.
3.2 OI and Price Analysis
Price ↑ + OI ↑ → Long Build-up.
Price ↓ + OI ↑ → Short Build-up.
Price ↑ + OI ↓ → Short Covering.
Price ↓ + OI ↓ → Long Unwinding.
This is one of the most powerful interpretations for intraday and positional trading.
3.3 IV Analysis
Rising IV + Rising Premiums → Traders expect big moves.
Falling IV + Rising Premiums → Unusual demand-driven move.
Chapter 4: Techniques of Option Chain Analysis
4.1 Strike-Wise Analysis
Look at individual strikes for OI and volume changes.
Identify where traders are adding fresh bets.
4.2 ATM (At-the-Money) Analysis
ATM strikes reflect the most balanced and sensitive positions.
Changes in ATM OI provide clear sentiment direction.
4.3 OTM (Out-of-the-Money) Analysis
Helps identify speculation and event-based positioning.
Example: Traders buying far OTM Calls before results → Bullish bets.
4.4 PCR Interpretation
Overall PCR for market view.
Strike-wise PCR for specific zones.
Chapter 5: Option Chain Analysis for Strategies
5.1 Directional Strategies
Bullish sentiment → Buy Calls, Sell Puts, Bull Call Spread.
Bearish sentiment → Buy Puts, Sell Calls, Bear Put Spread.
5.2 Neutral / Range-Bound Strategies
If highest Put OI and Call OI are close → sideways view.
Strategies: Iron Condor, Short Straddle, Short Strangle.
5.3 Volatility-Based Strategies
High IV → Option writing (Iron Fly, Short Straddle).
Low IV → Option buying (Long Straddle, Long Strangle).
Chapter 6: Practical Example (NSE NIFTY)
Imagine NIFTY trading at 20,000.
Highest Put OI at 19,800 → Support.
Highest Call OI at 20,200 → Resistance.
PCR = 1.3 → Slightly bullish.
Interpretation:
NIFTY likely to trade between 19,800–20,200 for now.
Strategy: Iron Condor within the range.
Chapter 7: Institutional vs Retail Approach
Retail traders: Focus on LTP, volume, ATM strikes.
Institutions: Focus on OI buildup, hedging positions, volatility skew.
Market makers: Use Greeks + IV to balance exposures.
Chapter 8: Advanced Insights
8.1 Option Chain + Technical Analysis
Combining chart support/resistance with OI data makes levels stronger.
8.2 Option Chain Before Events
Earnings, Fed meetings, budget → OI shifts + IV spikes.
Typically, IV crashes after event (“IV crush”).
8.3 Skew Analysis
Sometimes far OTM puts have higher IV than calls → sign of bearish protection demand.
Chapter 9: Mistakes Traders Make
Blindly following “highest OI” without context.
Ignoring IV while analyzing premiums.
Trading illiquid strikes (low OI/volume).
Misinterpreting PCR extremes (can signal contrarian trades).
Over-relying on option chain without considering news/technical charts.
Chapter 10: Step-by-Step Guide for Beginners
Open NSE Option Chain for the underlying.
Note the spot price.
Identify ATM strike.
Look at highest Put OI (support).
Look at highest Call OI (resistance).
Check PCR for sentiment.
Track OI + Price changes intraday for direction.
Select a strategy (buy/sell options, spreads, or non-directional).
Chapter 11: Benefits of Option Chain Analysis
Provides real-time market sentiment.
Identifies key support/resistance zones.
Helps in strategy selection.
Useful for hedging positions.
Assists in intraday, swing, and positional trading.
Chapter 12: Limitations
Works best in liquid instruments (NIFTY, BANKNIFTY).
Can give false signals during low volume sessions.
Sudden news/events can override OI patterns.
Requires constant monitoring (dynamic data).
Conclusion
Option Chain Analysis is a trader’s X-ray machine—it reveals what the surface charts don’t show. By analyzing open interest, volume, IV, and PCR, traders can spot where the market is placing its bets. This helps identify support/resistance levels, predict short-term trends, and craft strategies suited for directional, range-bound, or volatile markets.
For beginners, the option chain may initially look complex. But with practice, patterns emerge, and it becomes one of the most reliable tools for decision-making. For professionals, it’s an indispensable part of daily trading.
In the end, option chain analysis is not just about numbers—it’s about reading the collective psychology of market participants and positioning oneself accordingly.

Gold Today Intraday TradeDear Trader I,m Analysis
Gold has recently hit fresh highs around $3,700/oz, but now there’s profit-booking and resistance in that zone.
Support is seen near $3,640–$3,630/oz, which has acted as a demand zone in recent dips.
Some indicators are overbought (like RSI / Williams %R) or showing signs that upside momentum could be weakening unless price breaks certain resistance levels.
There is a possible bearish bias now if gold fails to clear resistance—to the upside, a breakout above ~$3,700+ could trigger further gains
---
📈 Key Levels to Watch
Level Type Approximate Price ($/oz)
Strong Resistance ~ $3,700–$3,707
Near Resistance ~$3,678–$3,680
Strong Support ~$3,640–$3,630
Deeper Support ~$3,600

XAUUSD Gold Trading Strategy September 15, 2025XAUUSD Gold Trading Strategy September 15, 2025: Weekly trend outlook, gold still has enough conditions for the possibility of continued price increases.
Basic news: After surpassing the 3670 USD/ounce mark, the highest level in history, the gold price has entered a correction phase, in the context of the market focusing on monitoring the policy moves of the US Federal Reserve (Fed). According to CME's FedWatch tool, investors are almost certain that the Fed will cut interest rates by 25 basis points, bringing the margin to 4 - 4.25%. However, the scenario of the Fed cutting 50 basis points is still considered, because this could cause the USD to plummet and push gold to skyrocket.
Technical analysis: The sideway range of 3600 - 3660 is still holding. Currently, we will wait for trading points at the 2 edges of the sideway range, but the priority is still mainly trading according to the trend.
Important price zones today: 3600 - 3605 and 3660 - 3665. Today's trading trend: Sideway.
Recommended orders:
Plan 1: BUY XAUUSD zone 3600 - 3602
SL 3597
TP 3605 - 3615 - 3635 - 3665 - OPEN.
Plan 2: BUY XAUUSD zone 3618 - 3620
SL 3615
TP 3623 - 3630 - 3650 - 3665.
Plan 3: SELL XAUUSD zone 3663 - 3665
SL 3668
TP 3660 - 3650 - 3640 - 3630 (small volume).
Wish you a new week of safe, effective and profitable trading.🥰🥰🥰🥰🥰

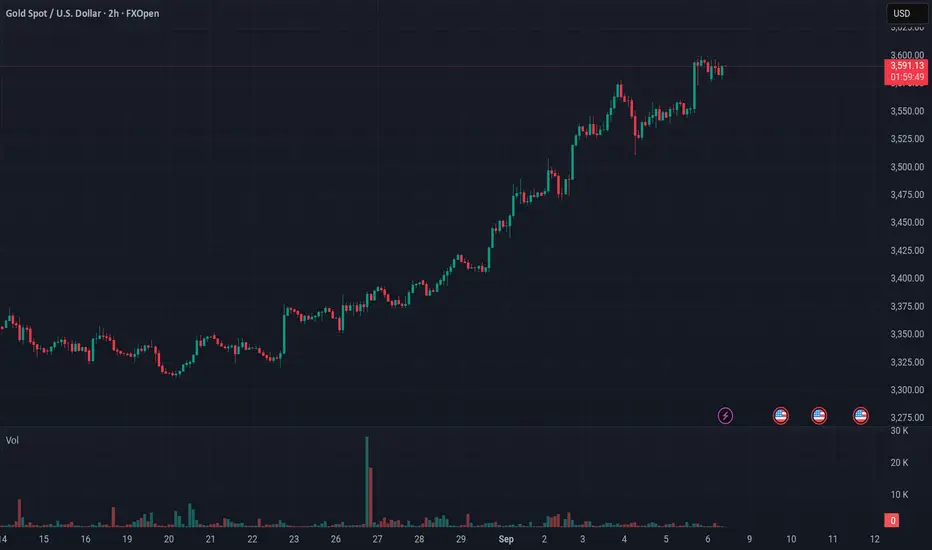
Gold sentiment Here is a detailed technical and sentiment analysis for gold incorporating RSI, MACD, Ichimoku, and Volume, based on the charts and data you provided, followed by a concrete trading strategy.
Overall Sentiment: Bullish Exhaustion at a Critical Juncture
The market is in a state of powerful bullish momentum fueled by weak economic data (NFP) but is showing clear technical signs of exhaustion and overbought conditions. This creates a high-risk environment where a significant pullback is increasingly probable before any next leg up.
---
Technical Indicator Analysis
While your charts don't show the indicators directly, we can infer their likely state based on the price action and standard settings.
1. Relative Strength Index (RSI - Typically 14-period):
· Likely Reading: On the Daily (1D) and 4H charts, the RSI is almost certainly in overbought territory (above 70, likely even above 80).
· Analysis: This confirms the market is overbought. The minor pullbacks on the 2H and 4H charts (shown by the small red candles) are likely causing the RSI to dip from extreme levels, but it remains elevated. This is a classic warning sign of a potential reversal or consolidation.
2. Moving Average Convergence Divergence (MACD - Typically 12,26,9):
· Likely Reading: On all timeframes, the MACD is above its signal line and at or near extreme highs.
· Analysis: This supports the strong bullish momentum. However, on the shorter timeframes (2H, 4H), we should be watching for bearish divergence (price making equal or higher highs while the MACD makes lower highs). This would be a strong short-term sell signal. The current consolidation increases the probability of this divergence forming.
3. Ichimoku Kinko Hyo:
· Price vs. Cloud (Kumo): The price is ** dramatically above the Senkou Span (Cloud)** on the daily chart. This indicates an extremely strong bullish trend but also a massive extension from its mean, suggesting a pullback towards the cloud is a high probability.
· Tenkan-sen (Conversion Line) vs. Kijun-sen (Base Line): The Tenkan-sen is almost certainly far above the Kijun-sen, confirming the strong trend. A crossing below would be a strong short-term bearish signal.
· Future Cloud: The cloud is likely bullish (green) and thinning, suggesting underlying trend strength but potential for volatility.
4. Volume:
· Analysis: The COT report is a form of volume analysis. The ** surge in open interest (+49,148 contracts)** from the 09/02 report, driven by new speculator longs, represents a massive influx of volume and commitment. However, this often marks climactic buying, not a sustainable pace. In the price charts, the consolidation near the highs on declining volume would be a bearish sign, indicating a lack of new buyers at these levels.
Synthesis of All Factors
Factor Analysis Implication
Fundamental (NFP) Very Bullish. Weak data = weak USD, dovish Fed. Long-term trend is UP.
COT (Speculative Sentiment) Extremely Bullish (Overheated). Record net long positioning. High short-term risk of a sharp pullback.
Price Trend Bullish but Stalling. Consolidating at all-time highs. Indecision; potential exhaustion.
RSI Overbought on higher timeframes. Suggests a correction is due.
MACD Bullish but potential for bearish divergence. Momentum may be waning.
Ichimoku Price extremely extended from Cloud. Suggests a pullback is likely.
Volume (via COT) Climactic buying. Often marks a short-term peak.
---
Trading Strategy for Today
Core Principle: The trend is still up, but the risk/reward for new long entries at the current price is very poor. The optimal strategy is to wait for a technical correction to buy into strength or prepare for a reversal signal.
Scenario 1: Wait for a Pullback to Buy (Highest Probability & Prudence)
· Idea: Use the overbought signals and Ichimoku analysis to anticipate a pullback to a stronger support zone.
· Entry Zone: $3,480 - $3,520. This area aligns with previous resistance (now support) and a potential pullback towards the rising Tenkan-sen or Kijun-sen on the 4H chart.
· Confirmation: Look for bullish reversal candlesticks (hammer, bullish engulfing) and an RSI pulling back towards 50 (but not oversold).
· Stop Loss: A daily close below $3,450.
· Target: A move back towards the highs at $3,580 - $3,600.
Scenario 2: Breakout Trade (Lower Probability, Higher Risk)
· Idea: If the bullish momentum ignores all overbought signals.
· Entry: A sustained 4H or daily close above $3,610.
· Confirmation: The MACD should make a new high (avoiding divergence) and volume should increase on the breakout.
· Stop Loss: Below $3,590.
· Target: $3,650 - $3,680. Use a trailing stop.
Scenario 3: Aggressive Fade (For Experienced Traders)
· Idea: Fade the extreme bullish sentiment using bearish divergence and overbought RSI.
· Entry: On a clear bearish divergence on the 4H MACD (price makes a new high, MACD makes a lower high) AND a rejection from the $3,590 - $3,600 resistance level.
· Stop Loss: A close above $3,610.
· Target: $3,520 - $3,540.
Key Risk Management Note:
· NFP Event Risk: The next NFP release is TODAY (Sep 09, 19:30 GMT). This will cause massive, unpredictable volatility.
· Action: DO NOT enter new positions before this release. The market's reaction to the news will dictate the next major direction. If you are in a position, strongly consider reducing size or hedging.
Summary Table for Action
Strategy Entry Stop Loss Target Confidence
Pullback Buy $3,480 - $3,520 < $3,450 $3,580 - $3,600 High
Breakout Buy $3,610 < $3,590 $3,650 - $3,680 Low
Aggressive Fade ~$3,595 + Divergence $3,610 $3,520 - $3,540 Medium
Final Conclusion: The technical indicators (RSI, MACD, Ichimoku) all align with the COT data to scream "Overbought!" The fundamental driver is strong, but the market needs to cool off. The best trade is no trade until after the NFP news or a pullback into support. Patience will be rewarded with a much better risk-to-reward entry.
NIFTY Analysis – 21 july 2025 ,morning update at 9 amNIFTY Price Levels:
Expected Opening:-- Near 24985 (flat)
Upside Watch: May test 25035
Downside Trigger: If Nifty fails to hold 24985, potential fall towards:
24896 (Support 1)
24807 (Support 2)
nifty support -24897, 24807, 24722
Resistance -25035, 25122, 25219
Wait for Pattern Confirmation:
Bottleneck patterns often result in fakeouts, so avoid premature entries.
Use BOD or SOR Strategy
BOD (Buy on Dip): Only if strong bounce from support with volume.
SOR (Sell on Rise): If price fails to sustain above resistance zones.
Scalping Opportunity:
Due to bottleneck formation, expect a narrow range
Opening near 24985, range-bound likely due to bottleneck.
Upside capped near 25035 unless breakout on volume.
Watch 24896 and 24807 for bounce or breakdown.
Prefer scalping or small quantity BOD/SOR trades post 9:30 AM
Nifty is opening flat near 24985 (inside this range).
Bearish Bottleneck pattern means price is getting compressed (low volatility).
Both buyers and sellers are active inside this tight band but no clear breakout yet.
Scalping is best strategy in sideways zones, with small targets and stop-loss.

XAUUSD SHOWING A GOOD DOWN MOVE WITH 1:5 RISK REWARD XAUUSD SHOWING A GOOD DOWN MOVE WITH 1:5 RISK REWARD
DUE TO THESE REASON
A. its following a rectangle pattern that stocked the market
which preventing the market to move any one direction now it trying to break the strong resistant lable
B. after the break of this rectangle it will boost the market potential for break
C. also its resisting from a strong neckline the neckline also got weeker ald the price is ready to break in the outer region
all of these reason are indicating the same thing its ready for breakout BREAKOUT trading are follws good risk reward
please dont use more than one percentage of your capitalfollow risk reward and tradeing rules
that will help you to to become a bettertrader
thank you

"Analyzing Nifty 50: Support, Resistance, and Trade Insights"Let's take a look at the Nifty 50 chart to analyze current support and resistance levels, and whether it's a good time to consider a bullish trade or if the market might drop further.
Currently, the Nifty 50 is showing a downtrend, forming lower highs and lower lows. This suggests that the market is struggling. However, there is a bottom trend line that supports the index quite well. Despite this, recent heavy selling by Foreign Institutional Investors (FIIs) means we haven’t seen a clear reversal pattern yet. Right now, the market is consolidating near this trend line.
For the Nifty to turn bullish, we would need to see a strong buying moment . We hope the index doesn’t fall below this trend line, but if it does, we could see a drop of several hundred points.
At this point, it might be wise to hold off on making any trades until we have clearer confirmation of market direction. For those considering a bullish position, a sensible stop-loss would be below 22,700 .
Please remember, this is for educational purposes only. Make sure to do your own analysis before making any trades and don't just follow someone else's advice blindly.

GOLD NFP TRADING POIN UPDATE > READ THE CAPTAINBuddy'S dear friend 👋
Gold Trading Signals 🗺️🗾 Update Gold Traders SMC-Trading Point still holding it down trand target 2615 least analysis setup Hit 🎯 profits 2670+ 80 Now gold take resistance level pullback dow👇 today have USD monthly big New 🆕 NFP I 💬 NFP. Show it good for USD. 110: 00 Gold back down 👇 trend 📉 2630 2615 Entry take 2680 + 84 90
Small target 2690
Analysis target 2615
Mr SMC Trading point
Support 💫 My hard analysis Setup like And Following 🤝 me that star ✨ game 🎮

EUROUSD TRADING POINT UPDATE > READ THE CAPTAI NBuddy'S dear friend 👋
Euro USD Trading Signals 🗺️🗾 Update Euro USD Traders SMC-Trading Point ☝️ looking back up trand now 1H candle. Follow a small trade entry technical analysis setup
Small target we'll see 1.03808
Mr SMC Trading point
Support 💫 My hard analysis Setup like And Following 🤝 that star ✨ game 🎯

RSI & ADXRSI: Used to determine overbought/oversold conditions. ADX: Measures trend strength. Keltner Channels: Provides dynamic support/resistance levels and helps identify breakouts
The average directional index (ADX) is a technical indicator used by traders to determine the strength of a financial security's price trend. It helps them reduce risk and increase profit potential by trading in the direction of a strong trend
The Moving Average Convergence Divergence (MACD) and Relative Strength Index (RSI) can work well together to give you insights into market momentum and potential reversals. Use the MACD to check the trend direction, and the RSI to find good entry and exit points based on whether the market is overbought or oversold.

Trend line broken, and good reversal seen. Gold prices fell today due to several factors, with a primary driver being the strengthening U.S. dollar and rising U.S. Treasury yields. A stronger dollar makes gold more expensive for holders of other currencies, reducing demand.

GOLD SHOWING A GOOD DOWN MOVE WITH 1:10 RISK REWARD XAUUSD SHOWING A GOOD DOWN MOVE WITH 1:10 RISK REWARD
DUE TO THESE REASON
A. its following a rectangle pattern that stocked the market
which preventing the market to move any one direction now it trying to break the strong resistant lable
B. after the break of this rectangle it will boost the market potential for break
C. also its resisting from a strong neckline the neckline also got weeker ald the price is ready to break in the outer region
all of these reason are indicating the same thing its ready for breakout BREAKOUT trading are follws good risk reward
please dont use more than one percentage of your capitalfollow risk reward and tradeing rules
that will help you to to become a better trader
thank you

#RELIANCE
#RELIANCE ready for a new high.
Currently taking support of Demand Zone.
CMP -2744
TARGET - 2970 - 3050 3100 3150 +
—
—
SL 2700

XAUUSD SHOWING A GOOD DOWN MOVE WITH 1:10 RISK REWARDXAUUSD SHOWING A GOOD DOWN MOVE WITH 1:10 RISK REWARD DUE TO THESE REASON
A. its following a rectangle pattern that stocked the marketwhich preventing the market to move any one direction now it trying to break the strong resistant lable
B. after the break of this rectangle it will boost the market potential for breakC. also its resisting from a strong neckline the neckline also got weeker ald the price is ready to break in the outer region
all of these reason are indicating the same thing its ready for breakout BREAKOUT trading are follws good risk reward
please dont use more than one percentage of your capitalfollow risk reward and tradeing rules that will help you to to become a bettertrader
thank you

SUNDRAM FASTENERSSUNDRAM FASTENERS is near the weekly support area of 1300.
BUY at 1300
STOP LOSS at 1200
TARGET 1500


Sensex Monthly expire AnalysisFor the Sensex monthly expiry on 28th March 2024, I anticipate a bullish trend driven by positive economic indicators and corporate earnings. Continued government stimulus measures and favorable global market conditions are likely to support investor sentiment. Key sectors such as technology, healthcare, and renewable energy could outperform, while stable inflation and interest rates may further bolster market confidence. However, cautiousness regarding geopolitical tensions and potential regulatory changes remains prudent. Overall, I expect the Sensex to exhibit resilience and potentially reach new highs during this expiry period, reflecting the underlying strength of the Indian economy.

rpsg ventures: 1100 inn 2025?The stock is a holding company that holds RPSG Ventures, which is present in the BPM industry through its subsidiary Firstsource Solutions Limited (FSL), where it holds ~54% of the stake. FSL provides transformational business process solutions leveraging its ‘Digital First, Digital Now’ approach to create value across segments like banking and financial services, healthcare and communications, media, and technology.
Revenue Mix: FY22
Sale of FMCG Products: 5%
Rendering of Services: 91%
Mall Operations: 1%
Others - 2%
The Co. has a presence in the FMCG business through its wholly owned subsidiary, Guiltfree Industries Limited (GIL). In April 2017, GIL launched packaged snacks under the brand ‘TOO YUMM!’. Towards the end of FY22, the company forayed into the personal care segment with a limited launch of its skin and hair care products under the brand ‘Naturali’. A complete national brand launch is slated for 2022–23. GIL also has a 70% stake in Rajkot-based Apricot Foods Private Limited (AFPL), which markets snacks under the brand name ‘Evita’.
The Co. is present in the Ayurveda industry through its wholly owned subsidiary, Herbolab India Private Limited. Herbolab has a 150-year legacy with over 100 proprietary ayurvedic formulations across multiple categories. Its products are marketed under the brand ‘Dr. Vaidya’s’, which has emerged as one of India’s largest Ayurvedic brands in the direct-to-consumer (DTC) space. Total revenue during FY22 stood at ~Rs. 19 crore, versus ~Rs. 21 crore in FY21
The company's wholly owned subsidiary, Quest Properties India Ltd. (QPIL), owns 'Quest' Mall in Kolkata.
Revenue Mix: FY22
Sale of FMCG Products: 5%
Rendering of Services: 91%
Mall Operations: 1%
Others: 2%
The company's venture fund has made 10 investments so far in various startups such as The Souled store, MCaffeine, ShopG, Incnut Lifestyle, IncNut Digital, etc


varroc engineering chart is in uptrnd . we can take entry here by taking small stoploss
Disclaimer:- Invest at your own risk,, i am not register with Sebi.. This chart is according to my technical analysis which i learnt from past years
