XAUUSD Bullish Continuation Setup 📊 Chart Overview:
Asset: Unspecified (likely XAUUSD or a crypto asset).
Timeframe: Looks like 4H or Daily.
Tools Used:
EMA 50 (🔴 Red Line) — 3,283.978
EMA 200 (🔵 Blue Line) — 3,185.603
Resistance & Support Zones (🔴 Highlighted boxes)
Price: 3,335.415
🔍 Technical Analysis:
🟩 Trend Direction:
📈 Uptrend Confirmed: Price is above both EMA 50 and EMA 200 → Strong bullish momentum.
✅ Golden Cross: EMA 50 is above EMA 200, confirming long-term bullish bias.
📌 Key Levels:
🧱 Main Support Zone (🟥 Bottom Box - ~2,950–3,050):
Historical strong bounce zone.
Acts as a bullish base in case of a deeper pullback.
🔄 Mid Resistance/Support (~3,180–3,260):
Now acting as support after price bounced above it.
Also aligns with EMA 200 ➕🟦 – adds confluence.
📌 Main Resistance Zone (~3,300–3,380):
Current area of consolidation.
If broken, price likely to retest upper resistance.
🚧 Top Resistance Zone (~3,450–3,500):
Target area if bullish breakout continues.
✈️ Next take-profit zone for bulls.
🧭 Market Forecast:
🔁 Retest Expected: Price might pull back slightly to the main resistance area (~3,300), retesting previous resistance as support.
🚀 Upside Potential: Upon successful retest, price is projected to head toward the upper resistance (~3,480).
📉 Bearish Scenario: If price breaks back below 3,260 and EMA 50, expect a dip toward 3,180 or even the main support zone.
📈 Summary:
Bias: ✅ Bullish
Watch for:
🔍 Retest of 3,300 zone
✅ Breakout above 3,380
❌ Breakdown below 3,260 invalidates bullish scenario
Analysis

"Silver – Bearish Move Toward Support"🧠 Market Overview:
Instrument: Likely Silver (based on file name).
Chart Context: The price is currently trading below both the 50 EMA (red) and 200 EMA (blue), indicating bearish momentum and a possible shift in market structure.
📊 Key Technical Components:
🔹 Exponential Moving Averages (EMA):
50 EMA (32.614) is above the 200 EMA (32.526) but both are above the current price.
This crossover is recent and could indicate the beginning of a larger downtrend if confirmed by continued price action below both EMAs.
🔹 Market Structure:
POI (Point of Interest) marks a previous swing high where selling pressure emerged.
The chart shows internal liquidity (INT.LQ) sweeps both above and below consolidation areas, hinting at smart money manipulation to grab liquidity before making a move.
🔹 Resistance Zone:
Clearly defined between approx. 33.4–34.0, where price was rejected after a failed attempt to break higher.
Multiple rejections from this zone show strong selling pressure.
🔹 Support Zone:
Sitting between approx. 30.8–31.2.
Price previously consolidated here before a bullish move, making it a likely target for a return test or a potential bounce.
📉 Bearish Scenario & Projection:
The price broke below a short-term structure and failed to hold above EMAs.
The current price action shows a bearish pullback likely to form a Lower High (LH).
The projected path shows a pullback to previous support-turned-resistance, followed by a breakdown targeting the support zone.
✅ Bias:
Short-term bias: Bearish
Medium-term bias: Bearish, unless price reclaims the 200 EMA and consolidates above the resistance zone.
🔍 Confluences Supporting Bearish Outlook:
Price below EMAs (dynamic resistance).
Failed higher highs with liquidity sweeps (indicating smart money selling).
Clear market structure shift to the downside.
Anticipated retest of support zone around 30.8–31.2.

How to gwt success ?To achieve success, define your goals, cultivate a growth mindset, and prioritize your health. Build strong relationships, embrace continuous learning, and be adaptable. Celebrate your achievements, seek feedback, and stay committed to your long-term goals.
Elaboration:

Management and Psychology Trading psychology is the emotional component of an investor's decision-making process, which may help explain why some decisions appear more rational than others. Trading psychology is characterized primarily by the influence of both greed and fear. Greed drives decisions that might be too risky.

Swing TradingSwing trading is a trading technique that traders use to buy and sell stocks when indicators point to an upward (positive) or downward (negative) trend in the future, which can range from overnight to a few weeks.

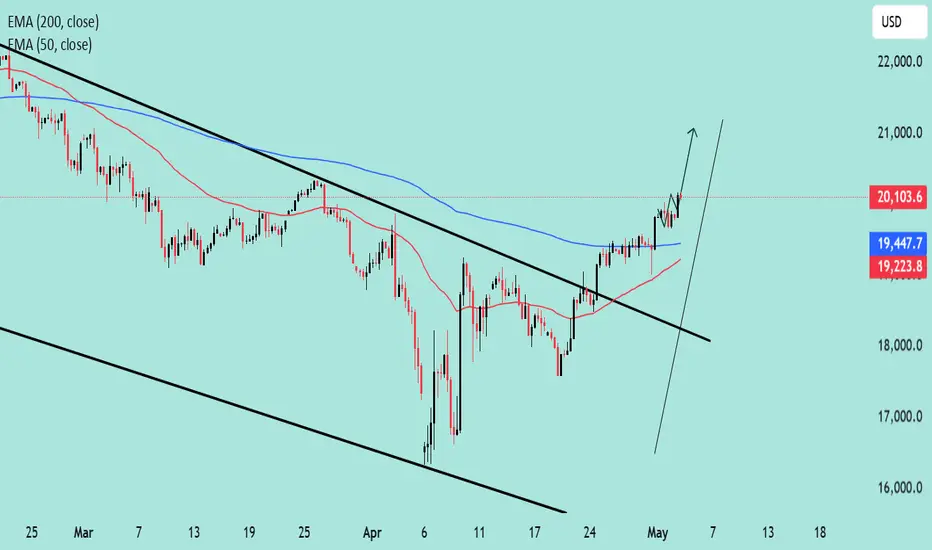
NASDAQ Eyes Higher Highs Bullish Reversal in Play 📈 NASDAQ Outlook: Bullish Momentum Builds Up
✅ Breakout Confirmed: Price action has broken above the descending channel, signaling a reversal from the previous downtrend.
📊 EMA Crossover: The 50 EMA is crossing above the 200 EMA (a golden cross), historically a bullish indicator.
🔼 Momentum Strong: Price is accelerating above EMAs with a steep upward trajectory, suggesting buyers are in control.
🔮 Potential Target: With sustained momentum, price could aim for the 21,000+ region in the short term.
If the price sustains above the 19,500 zone, dips could be considered buying opportunities in the current bullish structure.
"EUR/AUD Bearish Channel with Key Support Ahead"📉 Market Structure Analysis (Bearish Bias)
Current Trend:
The pair is trading within a well-defined descending channel, indicating a bearish trend. Price action is forming lower highs and lower lows, adhering to the channel boundaries.
Moving Averages (EMA):
EMA 50 (Red) at 1.77491 is above the price, acting as dynamic resistance.
EMA 200 (Blue) at 1.73338 is close to current price, likely to act as a support area in the short term.
The bearish crossover between the 50 EMA and current price supports the continuation of downward momentum.
🔍 Key Zones:
Weak Resistance Zone:
Located around 1.7740 – 1.8000, previously a support area, now acting as resistance.
Price rejection from this zone multiple times indicates sellers' strength.
Support Zone:
Located around 1.6950 – 1.7100, where demand may return.
This zone coincides with the lower boundary of the descending channel, making it a likely reaction zone.
📊 Forecast / Expectation:
The chart projects a bear flag / corrective pullback before another leg downward toward the support zone.
If price breaks and sustains below the EMA 200, it will likely accelerate bearish pressure.
The descending channel suggests potential continuation to the downside unless price breaks out of the upper boundary with momentum.
✅ Trade Implications:
Bearish Setup:
Look for short opportunities on intraday pullbacks near the resistance or EMA 50.
Bullish Invalidations:
A breakout above the descending channel and sustained move above 1.7800 would invalidate the bearish outlook.
Conclusion:
This chart presents a technically clean bearish setup. The confluence of a descending channel, EMA rejection, and defined resistance/support zones suggests the EUR/AUD may continue lower, especially if it loses the 1.7300 level decisively.

XAU/USD Market Outlook – Key Levels & Scenarios (May 2025)📊 Market Overview
Asset: XAU/USD (Gold vs. USD) – likely
Timeframe: 🕒 4H or Daily
EMAs:
🔴 50 EMA = 3,281 (short-term trend)
🔵 200 EMA = 3,179 (long-term trend)
🧱 Key Zones
🔺 Main Resistance Zone (🚫 Supply Area)
📍 ~3,320–3,400
🔍 Observation: Strong rejection zone with multiple failed attempts. 🚧 Price struggles to break and hold above here.
⚖️ Mid Support & Resistance Zone
📍 ~3,200–3,250
🧭 Current Action: Price is consolidating here. This is a key decision zone. A bounce or breakdown will likely decide the next big move. 🤔
🟦 Main Support Zone
📍 ~2,980–3,030
🛑 Observation: Major demand zone. If price falls here, it might attract buyers 👥 for a potential rebound.
📉 EMA Analysis
🔴 50 EMA is above 🔵 200 EMA → Trend still technically bullish ✅
🟡 BUT: Price is currently below 50 EMA, showing short-term weakness ⚠️
⚡️ 200 EMA is nearby (~3,179): Acting as dynamic support — a critical bounce zone! 🛡️
🔮 Scenarios
🐂 Bullish Path
✅ If price bounces from 3,200 support zone and reclaims 🔴 50 EMA:
🎯 Target: Retest of 3,320–3,400 🔺 zone
📈 Confirmation: Strong candle closing above 3,281 🔴 EMA
🐻 Bearish Path
🚨 If price breaks below 3,200 & 200 EMA:
🕳️ Expect drop towards 2,980–3,030 🟦 zone
📉 Confirmation: Candle closes below 3,179 with weak retest
✅ Conclusion
📍 Key Level to Watch: 3,200
⚖️ Market Sentiment: Neutral → Bearish bias unless price reclaims 50 EMA
🔒 Risk Tip: Avoid longs until price confirms bullish structure again 🔐

How to Find any Top or Bottom in Stocks or Index with Data A call option writer stands to make a profit if the underlying stock stays below the strike price. After writing a put option, the trader profits if the price stays above the strike price. An option writer's profitability is limited to the premium they receive for writing the option (which is the option buyer's cost).

Learn Intestinal Level TradingIf you're looking for a simple options trading definition, it goes something like this: Options trading gives you the right or obligation to buy or sell a specific security on or by a specific date at a specific price. An option is a contract that's linked to an underlying asset, such as a stock or another security.
Several factors contribute to this high failure rate: Lack of Knowledge and Education: Many traders enter the options market without a thorough understanding of how options work. Options can be complex financial instruments, and trading them without proper education can lead to significant losses
Option trading is largely a skill requiring knowledge of market trends, strategies, and risk management techniques. While there is an element of uncertainty in the markets, successful traders rely on analysis, planning, and discipline rather than luck.

Option and Database TradingOptions data providers collect specific data points that can later be used to determine price movements over time. These price changes in the stock market help investors and brokers decide which stocks might be ideal to sell or buy given current market conditions.

Meaning of RSIRSI stands for Relative Strength Index. It's a technical indicator used in trading and financial analysis to measure the speed and magnitude of price movements. Essentially, it helps traders gauge whether an asset is overbought or oversold.

Technical Concept part 2A 'Technical Concept' in Computer Science refers to the idea of measuring and assessing data packages within a server, computer, or web page to analyze and report the services provided via the Internet.

GOLD - Will FOMC and Tariff Talks Decide the Next Big Move?💥 GOLD WEEKLY OUTLOOK – Will FOMC and Tariff Talks Decide the Next Big Move?
As we head into a critical trading week, gold is at a crossroads, navigating through conflicting macro signals and important structural levels. Last week’s developments — ranging from strong US NFP data to China’s unexpected SGX:40B tariff waiver — have significantly reshaped sentiment in the precious metals market.
🌐 Macro Backdrop – Shift in Global Risk Tone
🔹 China’s Tariff Waiver on selected US goods hints at improving trade ties. This eases geopolitical risks and reduces the urgency for safe-haven assets like gold.
🔹 Stronger-than-expected NFP (Nonfarm Payrolls) further solidifies a hawkish bias for the Fed. A robust labor market may push the Fed to maintain higher rates for longer.
🔹 DXY & Bond Yields are holding firm. A stronger USD and rising yields typically weigh on gold — unless major risks re-emerge.
📌 FOMC Meeting This Week – Traders are now watching the Fed’s next move closely. Any dovish tone could fuel gold’s rebound. A surprise hawkish tone? Expect further selloffs.
🔍 Technical Landscape (H4 + Daily Focus)
Gold is currently forming a descending wedge pattern, with lower highs and solid support holding around the 3,224 – 3,204 zone.
Last week’s rejection at the 3,277 resistance aligns with macro-driven selling pressure. However, price continues to respect key Fibonacci levels and internal trendline dynamics, suggesting a potential for large breakout movement after FOMC.
🔺 Key Resistance Levels:
3,240
3,250
3,264
3,277
3,311
🔻 Key Support Levels:
3,224
3,210
3,204
🎯 Trade Plan – Week of May 6th, 2025
🔵 BUY ZONE A: 3,204 – 3,202
SL: 3,198
TP: 3,208 → 3,212 → 3,216 → 3,220 → 3,225 → 3,230
🔴 SELL ZONE: 3,276 – 3,278
SL: 3,282
TP: 3,272 → 3,268 → 3,264 → 3,260 → 3,250 → 3,240
⚠️ Key Risks to Monitor This Week:
🏛 FOMC Statement & Powell’s Press Conference
→ Any hint of rate cuts = Gold bullish
→ Any reaffirmation of higher for longer = More downside
💼 Trade Developments (US–China)
→ Further easing of tariffs = Negative for gold
→ Any new friction = Potential rebound
📉 DXY & Bond Yields
→ Keep an eye on Dollar strength. If DXY breaks above 106.5, gold may face deeper pressure.
🧠 Final Thoughts:
The gold market is no longer driven by one-sided risk-off flows. As macro tensions ease, gold is transitioning into a more range-bound, news-driven phase.
This week is all about reaction, not prediction.
Let the market come to your zone. Wait for confirmation before executing. The best trades come from discipline — not prediction.
📌 Follow this account for real-time updates during FOMC and Friday’s CPI preview.

EUR/USD at Key Inflection Point🔥 EUR/USD at Key Inflection Point – NFP Looms, Volatility Incoming?
The euro is pushing back after three days of losses, bouncing from the 1.1265 area with strength — but make no mistake, this is more than just a technical move. With Eurozone CPI holding and US Nonfarm Payrolls (NFP) right ahead, EUR/USD is poised at the edge of serious volatility.
🧭 Macro Overview – Diverging Paths?
Friday’s Eurozone inflation numbers surprised slightly to the upside:
Headline CPI YoY: 2.2% vs. 2.1% expected
Core CPI YoY: 2.7% vs. 2.5% expected
These numbers suggest ECB might not be in a rush to slash rates, despite growing dovish commentary from policymakers. Yet, the market still prices in a likely 25bps cut in July.
Meanwhile in the US, expectations are building for a soft NFP print – 130K vs. 228K prior. This, along with recent weak growth data, has fueled speculation of multiple rate cuts from the Fed in 2025. The USD has paused after a 3-day rally — and that makes today’s NFP extremely sensitive.
🔍 Technical Picture (H1 Outlook)
Price action shows EUR/USD reclaiming ground above 1.1300 after defending the key 1.1265–1.1279 support zone. A potential short-term reversal pattern is forming, but the move remains fragile until we see confirmation above 1.1350 and 1.1372.
Bearish structure remains valid unless bulls can take out 1.1419, the high from April 30.
🔺 Key Resistance Levels:
1.13520
1.13730
1.13900
1.14190
🔻 Key Support Levels:
1.13000
1.12790
1.12650
🎯 Trade Plan – Friday 3rd May
🔵 BUY ZONE: 1.12790
SL: 1.12250
TP: 1.13450 → 1.13850 → 1.14250
🔴 SELL ZONE: 1.13750
SL: 1.14300
TP: 1.13250 → 1.12850 → 1.12450 → 1.12400
⚠️ Strategy Notes:
Euro has room to bounce, but momentum will likely depend on the US jobs report.
A soft NFP could weaken the dollar further, triggering a break above 1.1372.
On the flip side, strong jobs numbers + hawkish White House language could reinforce bearish continuation below 1.1300.
📣 Final Thoughts:
EUR/USD is stuck in macro limbo. Both sides have valid narratives — sticky inflation in Europe, softening labour data in the US.
📊 Today’s close will likely define next week’s tone.
🧠 Be selective. Don’t chase. Let the data lead.
💬 What’s your take ahead of NFP? Breakout or fakeout?
Drop your chart ideas below 👇👇👇

NFP & White House Comments to Spark Heavy Volatility?🚨 Gold Pauses at Crossroads – NFP & White House Comments to Spark Heavy Volatility?
Gold is entering the US session with a quiet rebound after an intense selloff phase. Following its historic rally to $3,500/oz, the yellow metal has come under significant pressure — not from fundamentals alone, but from massive profit-taking across Asia, especially from retail investors in China.
Such sharp pullbacks are not abnormal after parabolic runs. Instead, this pullback seems like a healthy technical reset before the market processes two major catalysts later today:
1️⃣ The US Nonfarm Payrolls report (May edition)
2️⃣ Official White House comments on tariffs and trade direction
Together, they’re likely to dictate where Gold is heading next — either a retracement deeper into the demand zones, or a renewed upside attempt toward recent resistance.
📊 DXY & Macro Lens:
The US Dollar Index (DXY) has rebounded strongly from its base near 98.xx, now reclaiming levels near 100.00. Whether it continues higher depends largely on labor data and economic signals from the White House tonight.
For now, traders should remain neutral-biased but responsive — and treat every key level with surgical precision. Use the H1–H2 timeframe for intraday bias and structure-based execution.
🔺 Key Resistance Levels:
3260
3275
3285
3312
🔻 Key Support Levels:
3244
3230
3215
3200
🎯 Trade Plan for Today – May 3rd, 2025:
🔵 BUY ZONE A: 3232 – 3230
SL: 3226
TP: 3236 → 3240 → 3244 → 3248 → 3252 → 3256 → 3260
🔵 BUY ZONE B: 3214 – 3212
SL: 3208
TP: 3218 → 3222 → 3226 → 3230 → 3235 → 3240
🔴 SELL ZONE: 3276 – 3278
SL: 3282
TP: 3272 → 3268 → 3264 → 3260 → 3250
⚠️ Final Notes:
Volatility today could spike sharply during the US session. With nonfarm data + political headlines colliding at once, this is the kind of session where fortunes are made — or lost.
📌 Avoid emotional trades. Let price reach your zones, wait for confirmation, and stick to your TP/SL rules like a professional.
🚀 The real move hasn't happened yet — but it's coming.
Be ready. Be sharp. Trade with discipline.

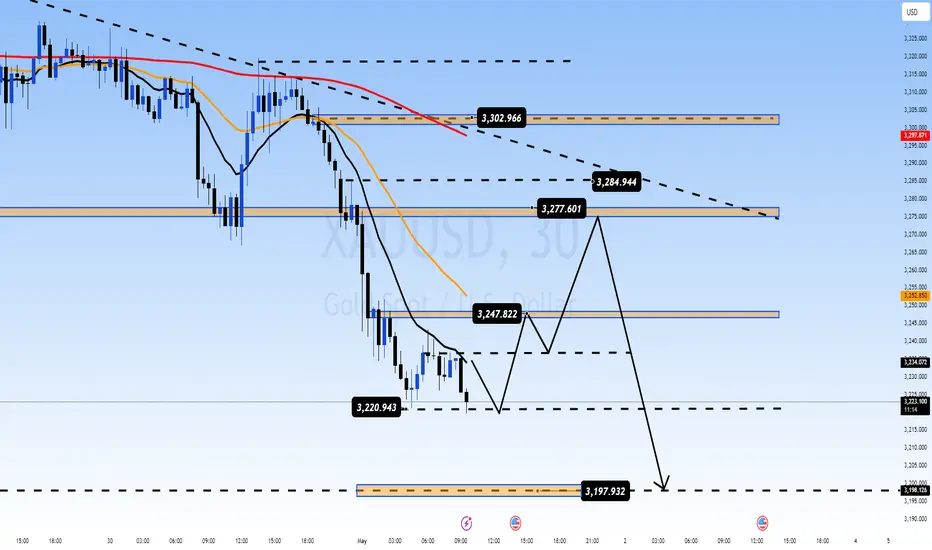
Gold’s Calm Before the US Data Storm – Are You Ready?Consolidation Continues Amid Global Holidays – Is Gold Gearing Up for Another Leg?
🌐 Fundamental Insight:
After last week’s historic rally toward $3,500/oz, gold has entered a cooling phase as markets digest evolving geopolitical developments and economic signals. The recent de-escalation in US-China trade tensions, triggered by President Trump’s plan to ease tariffs on auto parts and imports, has reduced immediate risk sentiment.
China’s response — lifting retaliatory duties on select US goods — further eased tensions, leading to a safe-haven selloff in precious metals. However, with uncertainty still looming ahead of this week’s US labour data (ADP + NFP), investors remain cautious.
Adding to this, today’s Bank Holidays in parts of Asia and Europe are contributing to reduced trading volumes. A sideways market with erratic moves is likely until the US session opens, where higher volume and stronger direction may emerge.
🔍 Technical Picture (H1 – H4 Outlook):
Gold is currently forming a compression pattern between the 3278 resistance zone and the 3196 demand area. Price is holding above key structure support near 3192, indicating buyer interest remains intact.
The market may continue to oscillate in this tight intraday range before US traders step in. All eyes are now on upcoming ADP employment data — often a lead indicator for Friday’s NFP — which could provide the next directional push.
🔺 Key Resistance Zones:
3248
3260
3278
🔻 Key Support Zones:
3230
3225
3215
3196
🎯 Trade Strategy – April 30
🔵 BUY ZONE: 3198 – 3196
Stop-Loss: 3192
Take-Profits: 3202 → 3206 → 3210 → 3215 → 3220 → 3225 → 3230
🔴 SELL ZONE: 3276 – 3278
Stop-Loss: 3282
Take-Profits: 3272 → 3268 → 3264 → 3260
🧠 Note: Short-term traders may consider scalping within the range, while swing traders can wait for a break and retest of either key zone before committing with volume.
⚠️ Things to Watch Today:
Thin liquidity due to Labour Day holidays across Asia & Europe
ADP report release in the US session (potential volatility spike)
End-of-month candle close — watch out for liquidity grabs and false breakouts
US 10Y bond yields and DXY movements will continue to influence gold sentiment
📌 Final Thoughts:
Gold is in pause mode, but not for long. The market is clearly building energy ahead of high-impact US data. With the broader trend still bullish and structure holding above 3190s, we stay cautiously optimistic — but flexible.
Risk management will be critical today. Expect the unexpected during low-volume sessions and be prepared for sharp moves when the US opens.
📈 Stay disciplined. Respect your zones. And let the data lead the way.
RSI Divergence Part 2RSI divergence occurs when the price of an asset and the RSI indicator move in opposite directions. This can signal a potential trend reversal or a weakening of the current trend. There are two main types: bearish and bullish divergence.

Trading Plan – April 28, 2025: GOLD (XAU/USD) Strategy🌟 Daily Trading Plan – April 28, 2025: GOLD (XAU/USD) Strategy
📈 Technical Overview:
After the strong sell-off last week, gold is now consolidating around the key support zone 3260–3270.
Price action is tightening, forming a symmetrical triangle pattern on the M15 timeframe.
The MA 13 – 34 – 200 alignment suggests a short-term bearish trend, but selling momentum is weakening.
The chart indicates a potential retest towards resistance levels before deciding the next major move.
🎯 Key Price Zones to Watch:
Immediate Resistance: 3299 – 3313
Major Support: 3260 – 3268 – 3239
Potential Rebound Target: A retest towards 3299 – 3313 before a possible sell-off resumes.
📌 Trading Scenarios:
Primary Strategy: Look for short-term BUY setups near the 3260–3268 support zone, aiming for a corrective move towards resistance, then watch for SELL signals.
🎯 Detailed Plan:
🔵 BUY Zone: 3260 – 3258
Stop Loss: 3254
Take Profit: 3264 – 3268 – 3272 – 3276 – 3280 – 3290
🔴 SELL Zone: 3299 – 3301
Stop Loss: 3306
Take Profit: 3294 – 3290 – 3286 – 3282 – 3275
📢 Important Notes:
Today's price range could move between 60–80 pips, with no major economic events scheduled.
However, the market remains highly sensitive to geopolitical news, especially concerning India–Pakistan tensions and U.S.–China relations.
Always stick to your TP/SL plans and avoid FOMO during rapid price movements.
✅ Summary:
This is a high-sensitivity period for gold. Prioritize trading high-probability setups: BUY at support – SELL at resistance, and only scale in positions after clear confirmation!

Astral - Looks good to buy at bottomAstral Poly Technik Ltd was established in 1996, with the aim to manufacture pro-India plumbing and drainage systems in the country. It has also forayed into adhesive business over years.
Market Cap: ₹ 36,884 Cr.
Promoter holding: 54.1 %
FII holding: 20.2 %
DII holding:14.6 %
Public holding: 11.0 %
Fundamentals are good. Near breakout level and good to hold for the next 6 months.

Support and Resistance Part 2Support occurs at the point where a downtrend is expected to pause due to a concentration of demand. Resistance occurs at the point where an uptrend is expected to pause due to a concentration of supply. Support and resistance areas can be identified on charts using trendlines and moving averages.

Management and PsychologyManagement psychology explores how psychological principles and theories can be applied to understand and improve organizational performance. It focuses on human behavior, motivation, and decision-making within a workplace context, helping managers develop more effective strategies for leading teams and achieving business goals.

Option TradingIf you're looking for a simple options trading definition, it goes something like this: Options trading gives you the right or obligation to buy or sell a specific security on or by a specific date at a specific price. An option is a contract that's linked to an underlying asset, such as a stock or another security.
