Gold Retreats as Trump’s Trade Talk Flip Sparks CautionGold Retreats as Trump’s Trade Talk Flip Sparks Caution – Friday Volatility Expected 💥📉
🟡 Market Recap & Sentiment
Gold prices jumped over 1% this week, reaching around $3,500/oz, as investors sought safe-haven assets amid a weakening USD and global uncertainty. However, analysts believe this Price surge is driven by greed and needs a healthy correction.
“Gold might consolidate in the near term, but we’re still in a bull market. Dips will be bought,” said analyst Wong.
Meanwhile, the US Dollar and equities are losing their appeal as investors digest contradictory signals from President Trump. He confirmed that US-China trade negotiations are ongoing, while China denied any talks – sending shockwaves across markets and triggering a sharp pullback in gold during the Asian session.
This political flip-flop is adding confusion, and traders are advised to stay cautious before jumping into any positions.
📉 Fundamental Triggers Today
Core Retail Sales (US) – releasing later today during the US session.
It’s also Friday – which means potential for weekly candle closure volatility and liquidity grabs.
Coupled with the ongoing tariff headlines and geopolitical drama, today could be extremely unpredictable.
📍 Key Levels to Watch
Resistance: 3366 – 3384 – 3406 – 3428 – 3445
Support: 3308 – 3288 – 3270
🔹 Trade Setup Suggestion
🔸 BUY ZONE: 3288 – 3286
SL: 3282
TP: 3292 – 3296 – 3300 – 3304 – 3310
🔸 BUY ZONE: 3270 – 3268
SL: 3264
TP: 3274 – 3278 – 3282 – 3286 – 3290
🔻 SELL ZONE: 3384 – 3386
SL: 3390
TP: 3380 – 3376 – 3372 – 3368 – 3364 – 3360 – ???
🔻 SELL ZONE: 3406 – 3408
SL: 3412
TP: 3400 – 3396 – 3392 – 3388 – 3384 – 3380 – 3370 – 3360
⚠️ Risk Management Reminder
Be cautious today – it’s a Friday with major data and geopolitical uncertainty.
✅ Always respect TP/SL levels.
✅ Let the market show confirmation before entering positions.
Sit tight and let the market come to your zone – don’t rush in with FOMO during uncertain sentiment.
Analysis

How we trade in option chain ?To trade using an option chain, you first need to understand its structure and the information it provides. Option chains are organized by strike prices, expiration dates, and whether they are call or put options. You then decide whether to buy (long) or sell (short) a particular option contract, specifying the strike price, expiration date, and quantity. Finally, you submit your order through your brokerage platform.

Explanation of RSIThe Relative Strength Index (RSI) is a momentum indicator in technical analysis that measures the magnitude of recent price changes to assess whether an asset is overbought or oversold. It oscillates between 0 and 100, with values above 70 often suggesting overbought conditions and values below 30 indicating oversold conditions.

Technical TradingIn trading, "technical" refers to the practice of analyzing historical price and volume data to identify patterns and predict future price movements. This approach, called technical analysis, is a way to evaluate securities and forecast their behavior based on charts and statistical data.

Tech Mahindra Q4 Earnings Highlights: #TECHM
Tech Mahindra Q4 Earnings Highlights: #TECHM
• Net Profit: ₹1,166.7 Cr-
Up 18.7% QoQ (vs *983.2 Cr) •
Revenue: *13,384 Cr - Up 0.7% QoQ (vs *13,285.6 Cr)
⚫ EBITDA: *1,378 Cr-Grows 2.1% QoQ (vs *1,350.2 Cr)
⚫ EBITDA Margin: 10.3%, Slightly Up from 10.2% QoQ
Technical Analysis Summary:
The stock made a recent high of ₹1,810.
*1,210.
It was in a downtrend but has reversed from a strong support level at
Currently trading at ₹1,445, the stock has formed a Doji candle, indicating a balance between buying and selling pressure.
A break below *1,430-₹1,425 may signal increased selling pressure and potential downward movement.
Conversely, a break above ₹1,465-₹1,470 may trigger buying momentum
and a potential upward move.

NIFTY - 50 // 4 Hour Support and ResistanceAs of April 24, 2025, the Nifty 50 index is exhibiting a neutral to slightly bullish trend. Here's a summary of the key support and resistance levels based on recent technical analyses:
Newscast India
🔽 Key Support Levels
23,800: Identified as a crucial support level by multiple analysts. A breach below this could lead to further declines.
23,400–23,450: Considered a significant support zone, with the 11 and 20-day exponential moving averages providing additional support.
23,327: Marked as a strong support level, with the index recently reclaiming the 200-day moving average at 23,590.
🔼 Key Resistance Levels
24,500–24,700: This range is viewed as a significant resistance zone, with analysts noting that a breakout above this could lead to further gains.
24,000–24,125: Identified as immediate resistance levels, with 24,100 being a key hurdle for the index.
24,600–24,700: Considered a resistance zone, with the 24,600–24,700 range acting as a significant resistance level.

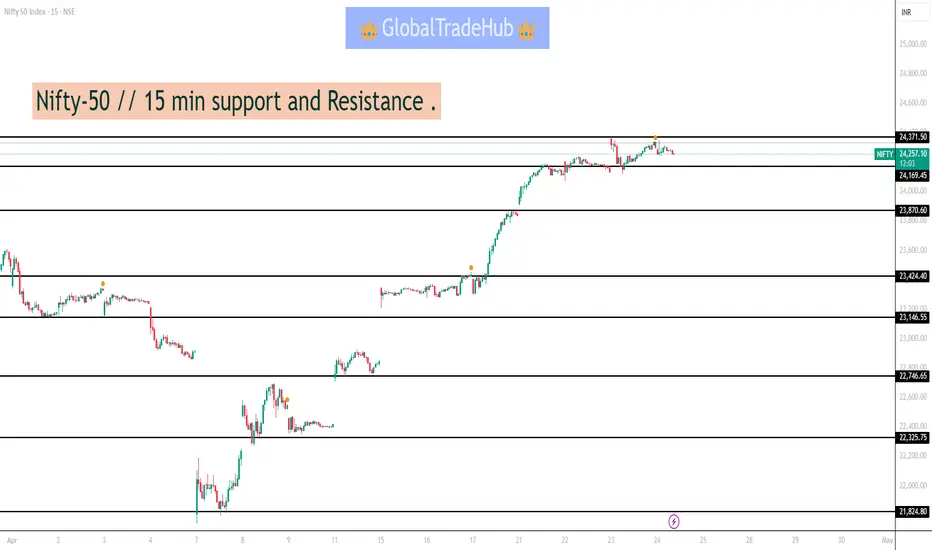
Nifty-50 // 15 min support and Resistance .NIFTY_50 Indicators & signals
Indicator MACD (12,26,9)
23420.22, 23191.53, 96.12
Indicator MACD is in positive zone
Indicator ADX (14)
31.57, 44.62, 23.21
Indicator ADX is indicating that momentum is weak.
Indicator ADX is showing that momentum is towards buying
Indicator RSI (14)
Current RSI is: 53
Indicator RSI is indicating buying momentum and stock might rise.
Gold Surge: 80 Price Bounce from Key Support Gold Surge: 80 Price Bounce from Key Support – What’s Next for the Market? 💰📈
Market Overview:
Gold has surged by 80 pips today, bouncing from the support level at the end of the U.S. session yesterday after liquidity was swept at the 3260 zone. Investors are now looking to buy the dip after the 250+ pip drop in gold over the past few days. Currently, after the strong 80 pip rally, gold is consolidating at the 0.382 Fibonacci retracement zone, with selling pressure mounting.
Key Price Levels to Watch:
Resistance: 3343, 3358, 3376, 3410, 3446
Support: 3210, 3286, 3275, 3230
Market Sentiment:
There’s a strong sell reaction at current levels, which suggests that the price could continue to push lower in both the Asian and European sessions to fill liquidity in the Fair Value Gap (FVG). After the 80 pip rally and 40 pip reaction, the market seems to be consolidating between 3328 and 3320. We expect a price movement range of 80-100 pips today, so caution is advised, especially around key levels at 3376-3378, where a potential sell can be placed.
Next Potential Movements:
If gold fails to break through the 3376-3378 resistance zone, we could see a continuation of the downward move. If the 3376-3378 zone holds strong, this could be a good opportunity to sell.
Should the price break through this zone, we’ll observe the next key resistance around 3410. A break above 3410 could signal a reversal to the upside, turning the trend into a BUY instead of SELL.
Today's Strategy:
For today, the focus will be more on SELL opportunities as gold pushes back to fill the FVG liquidity around 3288. Once we see how the price reacts at these levels, we can start planning for BUY entries.
Watch out for Unemployment Claims data from the U.S. later in the session, as this could trigger volatility. Be cautious when trading around news events, especially in a sensitive market.
Trade Setup:
BUY ZONE: 3230 - 3228
SL: 3224
TP: 3234 - 3238 - 3242 - 3246 - 3250 - 3254 - 3260
SELL ZONE: 3376 - 3378
SL: 3382
TP: 3372 - 3368 - 3364 - 3360 - 3355 - 3350
SELL ZONE: 3408 - 3410
SL: 3414
TP: 3402 - 3398 - 3394 - 3390 - 3386 - 3382 - 3375 - 3370
Risk Management:
It’s important to manage your risk appropriately given the current market conditions. Ensure you’re following your TP/SL levels strictly to protect your capital from market volatility.

MACD Divergence Part 2Moving Average Convergence/Divergence (MACD) The Moving Average Convergence/Divergence (MACD) is a momentum indicator showing the relationship between two EMAs of a security's price.

Advanced Database TradingTrading data is typically collected from stock exchanges such as the New York Stock Exchange (NYSE) or NASDAQ. This can be a useful source for trades that are made over the listed exchanges and can provide many different data poitns, such as trade prices and times.

Technical TradingIn trading, "technical" refers to the practice of analyzing historical price and volume data to identify patterns and predict future price movements. This approach, called technical analysis, is a way to evaluate securities and forecast their behavior based on charts and statistical data.

Divergence SecretsIn the share market, divergence refers to a situation where the price of an asset moves in a direction opposite to what a technical indicator is suggesting. This can signal a weakening trend and potentially a trend reversal. Divergence can be either positive (price moving higher) or negative (price moving lower).

Basic to Advance in TradingMake profits in intraday.
Stock market concepts and workings explained from very basic level.
Learn powerful day trading strategies.
Learn a step by step approach of how to trade in intraday.
Trend Following (Wealth Generation)
Learn the art of minimizing the risk and maximizing the return.

Meaning of Management and Psychology Management and psychology, when combined, explore how understanding human behavior can improve organizational effectiveness. Management is the process of directing and organizing resources (including people) to achieve goals, while psychology studies the mind and behavior. Therefore, management psychology (or managerial psychology) is about using psychological principles to understand and improve managerial practices, decision-making, and leadership in organizations.

Explain Swing Trading Swing trading is a speculative strategy where traders aim to profit from short-term price swings in a financial asset, typically holding positions for a few days to a few weeks. It focuses on capturing gains from the short-term fluctuations within a broader market trend, unlike day trading (which focuses on intraday movements) or long-term investing (which focuses on larger trends).

Gold Faces 200 Pips Drop – Will It Recover or Continue Falling?Gold Faces 200 Pips Drop – Will It Recover or Continue Falling? 🔥📉
Market Overview:
Gold (XAU/USD) saw a sharp drop of nearly 200 pips yesterday, falling from the historic high of around $3500 to $3318. This marks the strongest correction in the recent bullish trend. The market is currently volatile, and the question is whether gold will find support at lower levels or continue its downward movement.
What’s Causing the Drop?:
Fed Rate News: The latest news from the Federal Reserve triggered strong profit-taking, which resulted in the sharp decline.
USD Technical Rebound: The USD has rebounded after significant losses, putting pressure on gold.
Market Sentiment Shift: Investor sentiment changed rapidly, leading to mass sell-offs.
Key Levels to Watch:
Support: 3300-3320 (Critical level for a potential bounce)
Resistance: 3378-3380 (Key resistance area)
Next Steps for Gold:
Support at 3300-3320: If gold holds above this range, a strong recovery could follow.
Break below 3300: A breakdown below 3300 may lead to further declines, potentially towards the next support at 3250.
Trading Strategy:
SELL ZONE:
3378 - 3380
SL: 3384
TP: 3374 - 3370 - 3366 - 3362 - 3358 - 3350
SELL ZONE:
3408 - 3410
SL: 3414
TP: 3404 - 3400 - 3396 - 3392 - 3386 - 3380
BUY ZONE:
3292 - 3290
SL: 3286
TP: 3296 - 3300 - 3304 - 3308 - 3312 - 3316 - 3320
Important Notes:
Risk Management: Due to high volatility, make sure to use appropriate stop losses (SL) and take profits (TP).
Watch for Key Levels: Pay close attention to the 3300-3320 zone for signs of a potential bounce or further breakdown.
Adapt to Market Movement: Given the uncertainty, stay flexible and adjust your strategy accordingly.
Conclusion:
Gold’s market is in a highly volatile phase. Key support and resistance levels will determine the next move. Keep a close eye on market reactions and act accordingly.

RSI Divergence Part 3RSI divergence happens when the price and the RSI move in opposite directions. This signals that the current trend may be losing momentum and could reverse soon. For example, if the price keeps rising but the RSI starts falling, it could mean the uptrend is weakening.

RSI DivergenceRSI divergence happens when the price and the RSI move in opposite directions. This signals that the current trend may be losing momentum and could reverse soon. For example, if the price keeps rising but the RSI starts falling, it could mean the uptrend is weakening.

Explanation of MACDThe Moving Average Convergence Divergence (MACD) is a technical indicator used in trading to analyze the strength, direction, and momentum of a trend. It's calculated using two exponential moving averages (EMAs) and a signal line, helping traders identify potential entry and exit points.

Technical Analysis class1 1Technical analysis is a means of examining and predicting price movements in the financial markets, by using historical price charts and market statistics. It is based on the idea that if a trader can identify previous market patterns, they can form a fairly accurate prediction of future price trajectories.

Technical TradingIn trading, "technical" refers to the practice of analyzing historical price and volume data to identify patterns and predict future price movements. This approach, called technical analysis, is a way to evaluate securities and forecast their behavior based on charts and statistical data.

Database TradingTrading data is typically collected from stock exchanges such as the New York Stock Exchange (NYSE) or NASDAQ. This can be a useful source for trades that are made over the listed exchanges and can provide many different data poitns, such as trade prices and times.

PCR TradingIn trading, PCR, or Put-Call Ratio, is a technical indicator used to assess market sentiment by analyzing the volume of put options (right to sell) compared to call options (right to buy). It helps traders gauge whether the market is leaning towards bullish or bearish trends.
