USD/JPY BREAKS DOWN USD/JPY BREAKS DOWN – SAFE HAVEN YEN STRENGTHENS AS GLOBAL MARKETS REACT
After the latest U.S. tariff announcement, global financial markets went into risk-off mode, with U.S. Treasury yields dropping sharply. As investor fear rises, money quickly rotates into safe-haven assets — and the Japanese Yen is taking the spotlight.
🔻 USD/JPY just hit its lowest level in over 3 weeks, reflecting both global sentiment shifts and domestic tailwinds for the Yen.
🔍 What's Fueling Yen Strength?
Risk-off sentiment:
Global equities declined after the U.S. tariff update. Investors are fleeing risky assets, favoring traditional safe havens like the Yen.
Yield dynamics:
U.S. bond yields fell, dragging the dollar down.
If the Fed begins cutting rates to counteract trade impacts, it would further narrow the U.S.–Japan yield gap, supporting JPY.
BoJ policy outlook turning hawkish:
With inflation on the rise, expectations are growing that the Bank of Japan (BoJ) may continue rate hikes, reinforcing the Yen’s appeal.
Japan’s political stance:
Prime Minister Shigeru Ishiba announced intentions to revisit tariff policy negotiations with the U.S., potentially shaping Japan’s economic roadmap and investor confidence.
📈 Market Outlook:
If trade tensions persist and the Fed moves toward rate cuts, we could see further downside on USD/JPY, with JPY demand accelerating in both fundamental and technical terms.
This setup offers key opportunities for traders watching:
Safe-haven flow dynamics
Central bank divergence (Fed vs BoJ)
Potential macro breakout zones on JPY crosses
💬 What’s your view on USD/JPY heading into the next Fed and BoJ meetings?
Drop a comment and let’s discuss the bias!
✍️ Follow @MoneyMarketFlow for daily macro + technical insights across majors and metals.
Analysis

TRADE WAR STORM BREWING – IS A GLOBAL BIGSHORT COMING?🚨 TRADE WAR STORM BREWING – IS A GLOBAL BIGSHORT COMING?
In the past 24 hours, global financial markets have been rocked by the shock announcement of Trump’s aggressive global tariff policy. This isn’t just a geopolitical maneuver — it’s a potential trigger for massive systemic volatility, affecting everything from U.S. equities to Gold, DXY, crypto, and major global indices in Asia and Europe.
🔍 What Just Happened?
We saw Gold crash over 100 points, a move that caught many traders off guard. Under normal circumstances, a weakening USD would be bullish for Gold. But here’s the twist: the Dollar also dropped sharply, yet Gold was still aggressively sold off.
Why?
👉 A plausible explanation is that major funds and investors liquidated their Gold positions to cover equity losses or to meet margin calls from collapsing positions across other markets.
This is no ordinary move — it may well be the beginning of a “BIGSHORT” phase across global assets.
🧨 This Is Just the Beginning
The market reaction suggests that we are not in a routine correction. Instead, we may be witnessing the early stages of a coordinated risk-off movement — one sparked by fears of a new global trade war with far-reaching implications.
Tariffs on aluminum, steel, manufacturing goods, and industrial inputs have already disrupted entire supply chains. Industry-specific disruptions (e.g. construction, healthcare, utilities, wholesale) are beginning to show — this is not a drill.
📉 U.S. Macro Data Is Getting Worse
The headline inflation data in the U.S. continues to fall, but other economic indicators are flashing red:
ISM Services PMI (Mar): 50.8 (vs. 53.0 expected)
Employment: 46.2 (prev: 53.9) — a sharp drop
New Orders: 50.4
Export Orders & Backlogs: Both declined significantly
👉 The ISM Services sector represents more than 70% of U.S. GDP. A reading this weak suggests that the U.S. economy may be slowing faster than expected.
🧠 Market Sentiment Is Shaky
Fear is back. And worse: FOMO and panic are driving decisions, not logic.
Retail and institutional traders alike are struggling to digest the overlapping risks: tariffs, inflation uncertainty, interest rates, and recession fears.
Tonight brings another major catalyst:
📆 Nonfarm Payrolls (NFP) — a key employment report that could reinforce or break the current narrative.
🏦 Will the Fed Cut Rates Earlier Than Expected?
Here’s what markets are now pricing in:
Rate cuts may start as early as May or June 2025
Probabilities have risen for 2–4 rate cuts this year, compared to 2 cuts expected previously
Odds of a summer pivot are now well above 50%
If the Fed sees continued weakness in labor and services, it may have no choice but to cut earlier — regardless of inflation progress.
⚠️ Strategic Takeaway: Watch, Don’t Chase
Before looking for entries, take a breath.
This is a time when doing nothing might be the smartest trade.
“Sometimes, staying on the sidelines is how you survive the storm.”
Let the volatility play out — and prepare for high-probability setups, not emotional trades.
📊 TECHNICAL LEVELS TO WATCH
🔺 Resistance Levels:
3110 – 3119 – 3136 – 3148 – 3167
🔻 Support Levels:
3086 – 3075 – 3055 – 3040 – 3024
BUY ZONE: 3056 – 3054
SL: 3050
TP: 3060 – 3064 – 3068 – 3072 – 3076 – 3080
SELL ZONE: 3148 – 3150
SL: 3154
TP: 3144 – 3140 – 3136 – 3132 – 3128 – 3124 – 3120
💬 Final Thoughts
The combination of geopolitical tariffs, recession fears, and Fed policy uncertainty has created a perfect storm across global markets.
We’re entering a phase where any careless trade can wipe out weeks of progress. Be cautious. Stay informed. Wait for clarity before going big.
📌 As for Gold:
Are we seeing just a pullback — or is this the calm before an ATH breakout?
Stay sharp. Set clear SL/TP. Follow the macro, respect the chart — and most importantly, don’t trade scared.
🧠 Patience is profit. Let the market come to you.

Gold (XAU/USD) : Bullish Setup with Key Demand Zone🔹 Trend Line & Demand Zone 📈
* The trend line shows an upward trend. 🚀
* The demand zone 🟦 acts as strong support, where buyers are likely to step in.
🔹 Price Action 🔍
* Price is bouncing off the demand zone ➡️ Bullish Signal 📊🔥
* Higher lows forming, indicating potential upward momentum.
🔹 Trade Setup 🎯
✅ Entry Point: Near the demand zone 🟦
❌ Stop Loss: 🔽 3,099.26 (Below demand zone)
🎯 Target Point: ⬆️ 3,148.58 (Key resistance area)
🔹 Expected Movement 🏆
* A slight pullback 📉 before a strong push up 📈💪
* If price holds the demand zone, 🚀 potential rally ahead!
🔹 Risk-to-Reward Ratio ⚖️
* Favorable trade setup ✅ High reward, controlled risk 🎯
🔹 Final Verdict 🔥
📊 Bullish Bias ✅ As long as demand zone holds!
🚨 Warning: If price breaks below 3,099.26, expect further downside!

GOLD ANALYSIS – NEW ATH AFTER TRADE TARIFF SHOCK!📊 GOLD ANALYSIS – NEW ATH AFTER TRADE TARIFF SHOCK!
Former U.S. President Donald Trump has officially announced a comprehensive global tariff policy, targeting multiple countries and regions. This unexpected move triggered strong risk-off sentiment, resulting in:
📉 Massive asset sell-offs
💵 A sharp decline in USD strength
🪙 And another all-time high (ATH) for GOLD
Gold broke out aggressively from a long-standing sideways triangle pattern, confirming strong bullish momentum. The counter-tariff reactions from other countries were far more aggressive than forecast, further fueling gold’s safe-haven appeal.
🔍 Technical Perspective
Yesterday, we successfully identified and traded within the triangle pattern by connecting recent highs and lows. The breakout came exactly as expected, especially nearing the end of the consolidation range — a classic price behavior traders should always watch for!
Now that the breakout has occurred, our focus shifts to BUYING on a retest of the breakout zone. Early entries during the Asian and European sessions are preferred, while we’ll reassess during the U.S. session due to upcoming economic data.
🔔 Note: With major events like Nonfarm Payrolls (NFP) coming soon, stay alert for volatility and unexpected moves.
📌 Key Resistance Levels:
3167 (ATH) - 3175 - 3185 - 3198 - 3206 (psychological/Fibonacci extensions – wait for candle confirmation)
📌 Key Support Levels:
3140 - 3132 - 3120
🎯 Trade Setups
BUY ZONE: 3132 – 3130
Stop Loss: 3126
Take Profits: 3136 – 3140 – 3144 – 3148 – 3152 – 3156 – 3160
SELL ZONE: 3185 – 3187
Stop Loss: 3191
Take Profits: 3180 – 3176 – 3172 – 3168 – 3160
⚠️ Final Notes:
The uptrend is clearly dominant — no need to FOMO sell at current highs. Be patient, wait for the market to reach key resistance zones (psychological or Fibonacci-based), then reassess.
📌 Avoid overtrading or aggressive selling — the tariff announcement is a global macro driver with deep market impact.
We’ll wait for Friday’s NFP to reassess broader sentiment.
As always: Respect your TP/SL levels to protect your capital.
Stay safe & trade smart! 💼📈

GOLD MARKET – Early Asian Spike Meets Resistance Ahead of ADP🟡 GOLD MARKET UPDATE – Early Asian Spike Meets Resistance Ahead of ADP
Gold saw a strong early move during the Asian session, rallying back into the 313x zone — largely supported by consistent buying flow from Asian and Middle Eastern investors, as seen in the bullish momentum early in recent Asian sessions.
However, price quickly reacted to the key resistance zone at 3130–3135, which was highlighted in yesterday’s plan. With selling pressure reappearing at this level, my view remains to look for sell setups in both the Asian and London sessions if price retraces upward again.
📉 Technical Structure:
Gold is approaching the tip of a symmetrical triangle pattern, suggesting an imminent breakout.
→ As always: wait for the breakout, then trade the retest in the breakout direction.
📰 Fundamental Watch:
All eyes will be on tonight’s ADP Non-Farm Employment data from the U.S.
Expectations are fairly optimistic — if the data comes in near or better than forecast, this could strengthen the USD and push gold lower, aligning with my bearish view toward the 308x–307x target zone.
🧭 Key Levels to Watch:
🔺 Resistance: 3128 – 3135 – 3142 – 3148
🔻 Support: 3110 – 3100 – 3080 – 3070
🎯 Trade Setup:
🟢 BUY ZONE: 3102 – 3100
SL: 3096
TP: 3106 – 3110 – 3114 – 3118 – 3122 – 3126 – 3130
🔴 SELL ZONE: 3148 – 3150
SL: 3154
TP: 3144 – 3140 – 3136 – 3132 – 3128 – 3124 – 3120
📌 Caution: Watch out for increased volatility during the US session with ADP release.
In Asia and Europe, stick to the technical zones above and always manage your TP/SL properly to protect your capital.
Good luck, stay sharp.
— AD | Money Market Flow

Option and Database tradingTo study an option chain, focus on the current market price, displayed in the centre. Analyse the built-up data to understand market direction based on recent changes in open interest and price. ITM call options are typically highlighted in yellow, making it easier to distinguish them from other options.
The put-call ratio measures trading volume using put options versus call options. Instead of the absolute value of the put-call ratio, the changes in its value indicate a change in overall market sentiment.

Gold Kicks Off April with a New ATH – Bulls Remain in Control Gold continued its explosive rally during the early Asian session today, printing yet another All-Time High (ATH) after retesting the 3,12x zone overnight.
The U.S. stock market reversed sharply higher in the New York session, and if this bullish momentum continues, gold could see a short-term pullback near current resistance before heading higher again.
However, if equities fail to hold and roll over, gold may push further into uncharted territory, eyeing extended targets around 315x – 317x.
📰 Macro Focus:
Investors seem to have interpreted Trump’s latest trade stance as more "measured" than previously feared.
In his latest comments, he signaled that “tariffs may play a smaller role in the overall economic strategy.”
This has calmed markets slightly but hasn’t slowed down the gold rush.
📈 Price Action & Outlook:
With current momentum and sentiment, gold still looks likely to print fresh ATHs this week.
The next major upside target sits around 316x – 318x, where we may finally see a significant pullback as FOMO cools down.
For now, watch the 312x – 311x zones for potential short setups at local resistance — as marked in AD’s key levels.
🧭 Key Technical Levels:
🔻 Support: 3133 – 3122 – 3111 – 3100
🔺 Resistance: 3158 – 3166 – 3172 – 3180
🎯 Trade Zones:
🟢 BUY ZONE: 3122 – 3120
SL: 3116
TP: 3126 – 3130 – 3134 – 3138 – 3142 – 3146 – 3150
🔴 SELL ZONE: 3170 – 3172
SL: 3176
TP: 3166 – 3162 – 3158 – 3152 – 3148 – 3144 – 3140
📊 What to Watch Today:
Investors will be closely watching ISM Manufacturing PMI and JOLTS Job Openings during the US session — expect volatility spikes.
As gold hovers near new ATHs, stay disciplined:
✅ Respect SL/TP
✅ Manage risk according to your account size
✅ Don’t get caught up in emotional trades
Wishing you a powerful and profitable start to the new month. Let’s flow smart.
— AD | Money Market Flow

RSI and RSI divergenceThe RSI tool measures how fast and strong price movements are, ranging between 0 and 100. Typically, when the RSI is below 30, the asset is considered oversold; when it's above 70, it's seen as overbought. RSI divergence happens when the price and the RSI move in opposite directions

basics of technical anylasisTechnical analysis seeks to predict price movements by examining historical data, mainly price and volume. It helps traders and investors navigate the gap between intrinsic value and market price by leveraging techniques like statistical analysis and behavioral economics.

overview of financial marketsFinancial Markets include any place or system that provides buyers and sellers the means to trade financial instruments, including bonds, equities, the various international currencies, and derivatives. Financial markets facilitate the interaction between those who need capital with those who have capital to invest

GOLD SURGE CONTINUES – FEAR, WAR & END-OF-MONTH VOLATILITYGold opened this week with a strong upside gap, once again reminding us of how unpredictable Mondays can be following highly volatile weekends.
As always, when the market gaps significantly after the weekend, it's best to wait for price to absorb the remaining volume before locking into new setups.
As mentioned in previous outlooks, the current BUY pressure is still high, driven by a global wave of FOMO and fear, caused by:
Rising geopolitical tensions,
Global economic instability,
And even natural disasters now hitting parts of Asia.
Asian stock markets dropped sharply this morning after weekend developments escalated — with the Russia–Ukraine war showing no signs of de-escalation. In fact, new reports suggest a broader regional impact, further boosting risk-off sentiment.
💡 Safe Haven Flows Are Back in Full Force
Right now, gold is the #1 asset investors are paying attention to.
It's being treated as the ultimate flight-to-safety amid global panic and uncertainty.
And with this momentum, new ATHs may still be ahead.
📅 End-of-Month Candle Close – Expect Whipsaws
Today also marks the final trading day of the month, meaning we could see aggressive stop hunts and liquidity sweeps as large players look to close their monthly books.
➡️ Be extra cautious today — sharp moves up or down may occur due to end-of-month positioning.
Whether BUY or SELL, it’s best to trade tight, scalp smart, and respect your SL/TP.
Key Levels for 01/04:
🔺 Resistance: 3116 – 3132
🔻 Support: 3092 – 3085 – 3076 – 3066
🎯 Trade Plan:
SELL ZONE: 3130 – 3132
SL: 3136
TP: 3125 – 3120 – 3115 – 3110 – 3105 – 3100
BUY ZONE: 3066 – 3064
SL: 3060
TP: 3070 – 3075 – 3080 – 3085 – 3090 – 3095 – 3100
Stay sharp and trade with discipline.
End-of-month volatility is not for the weak hands.
— AD | Money Market Flow

GOLD – Unshaken Through Chaos - 50 new all-time highs🟡 GOLD – Unshaken Through Chaos | A Structural Bull Run Backed by Global Repricing
Gold isn’t just rallying — it’s sending a message.
Over the past 12 months, gold has set over 50 new all-time highs, a breakout sequence unmatched in over a decade. This is now officially the longest bullish streak in 12 years, and the third longest in modern history, only behind the volatile 1979–1980 period — a time when the global economy was grappling with runaway inflation, stagnant growth, and widespread unemployment.
But what makes this current bull cycle unique is not just the price action, but the structural shift behind the move.
📈 The Numbers Speak for Themselves:
YTD 2024 performance: +16%
12-month gain: +39%
Price range: From ~$1,200 to nearly $1,600/oz
3rd consecutive bullish year
These gains are not speculative pumps — they are a response to systemic instability. The macro backdrop is screaming uncertainty:
Sticky, structural inflation
Slowing global economic growth
Real interest rates still hovering around zero or negative
Geopolitical risk escalating in nearly every region of the world
This isn’t a short squeeze. It’s a capital migration.
🏦 The Central Bank Bid: The Silent Giant
What separates this rally from past cycles is who’s buying.
Unlike the 2011 gold run — driven heavily by retail FOMO and speculative ETF flows — today’s surge is institutionally anchored.
The strongest force in the current trend? Central banks.
Led by China, Russia, Turkey, and several BRICS nations, central banks have been accumulating gold at a record pace, shifting reserves away from USD exposure and hedging long-term geopolitical and economic risks. This isn't just diversification — it's a statement of monetary sovereignty.
Their consistent demand is forming a strong floor under price, insulating gold from violent retracements even during short-term corrections.
🔍 The Psychology of this Bull Market
This isn’t the kind of rally that fades on CPI noise.
The capital flow is defensive, not aggressive.
Funds are rotating into gold not to chase yield, but to preserve value. In times when fiat devaluation, sovereign debt instability, and political fragmentation are on the rise — gold doesn’t just shine, it leads.
The market is re-pricing systemic risk.
Investors are no longer reacting to inflation headlines. They are positioning for longer-term fragility in global monetary policy. That’s why even when inflation prints soften temporarily, gold still holds ground.
📌 What Comes Next?
Yes, technically, a pullback is healthy — even expected.
Extended breakouts are often followed by short-term consolidations. But the medium- to long-term structure remains intact.
Gold is not in a bubble. It’s in rotation.
In a world full of uncertainty, inflation volatility, and central bank crossfire — gold remains the most trusted asset for capital protection. And this rally? It’s not the end of something.
It’s just the beginning of a new monetary cycle.
— AD | Money Market Flow
📢 Join our community of serious traders.
Let’s grow, learn, and win together inside the MMFlow Trading Channel.
Tap in and be part of the flow.

Gold silver update next Our Spot #Gold Range Prediction from 31/03/2025 to 04/04/2025 is as under.
Gold Spot : 3023$-3126$
Gold INR : 88100-91050
Our Spot #Silver Range prediction from 31/03/2025 to 04/04/2025 is as under.
Silver Spot: 33.44$-35.05$
Silver INR: 98400-103200
It must be remembered that price of precious metal depends on so many world wide factors like inflation, Fed interest rate, trade barrier, geopolitical tension, demand, supply, bond yield, dollar index , GDP, payroll data, CPI, currency fluctuation, debt ceiling , expected tax & duty changes, other commodity price crude oil etc. etc. and hence there can not be any accurate barometer of predicting precious metal price.
Gold INR has been calculated taking Gold Spot international price and converting the same assuming fixed Indian rupee rate. However, this is not accurate method as change in rupee value to dollar can substantially impact Gold INR price. Pl. note that price of commodity doesn't depend upon performence of company but depend upon performence of world economy, hence it is extremely risky to trade in commodities. Commodities market also become more volatile during contract expiry.
These are not a recommendation for buy or sell. This view is only for educational purpose. You are requested to consult your financial advisor before entering in to any trade.

Gold silver update Our Spot #Gold Range Prediction from 31/03/2025 to 04/04/2025 is as under.
Gold Spot : 3023$-3126$
Gold INR : 88100-91050
Our Spot #Silver Range prediction from 31/03/2025 to 04/04/2025 is as under.
Silver Spot: 33.44$-35.05$
Silver INR: 98400-103200
It must be remembered that price of precious metal depends on so many world wide factors like inflation, Fed interest rate, trade barrier, geopolitical tension, demand, supply, bond yield, dollar index , GDP, payroll data, CPI, currency fluctuation, debt ceiling , expected tax & duty changes, other commodity price crude oil etc. etc. and hence there can not be any accurate barometer of predicting precious metal price.
Gold INR has been calculated taking Gold Spot international price and converting the same assuming fixed Indian rupee rate. However, this is not accurate method as change in rupee value to dollar can substantially impact Gold INR price. Pl. note that price of commodity doesn't depend upon performence of company but depend upon performence of world economy, hence it is extremely risky to trade in commodities. Commodities market also become more volatile during contract expiry.
These are not a recommendation for buy or sell. This view is only for educational purpose. You are requested to consult your financial advisor before entering in to any trade.

Good silver next wives Our Spot #Gold Range Prediction from 31/03/2025 to 04/04/2025 is as under.
Gold Spot : 3023$-3126$
Gold INR : 88100-91050
Our Spot #Silver Range prediction from 31/03/2025 to 04/04/2025 is as under.
Silver Spot: 33.44$-35.05$
Silver INR: 98400-103200
It must be remembered that price of precious metal depends on so many world wide factors like inflation, Fed interest rate, trade barrier, geopolitical tension, demand, supply, bond yield, dollar index , GDP, payroll data, CPI, currency fluctuation, debt ceiling , expected tax & duty changes, other commodity price crude oil etc. etc. and hence there can not be any accurate barometer of predicting precious metal price.
Gold INR has been calculated taking Gold Spot international price and converting the same assuming fixed Indian rupee rate. However, this is not accurate method as change in rupee value to dollar can substantially impact Gold INR price. Pl. note that price of commodity doesn't depend upon performence of company but depend upon performence of world economy, hence it is extremely risky to trade in commodities. Commodities market also become more volatile during contract expiry.
These are not a recommendation for buy or sell. This view is only for educational purpose. You are requested to consult your financial advisor before entering in to any trade.

Gold Rallies Ahead of Critical PCE Report – Is a Reversal ComingAs expected, Gold reached a new all-time high (ATH) following the bullish momentum we anticipated yesterday.
However, this upside move seems to have arrived earlier than projected — potentially a pre-positioning move before a major correction triggered by tonight’s PCE inflation data and profit-taking ahead of the weekend.
With current momentum, Gold could easily target $3100 as global stock markets — from the US to Asia — are sharply declining.
This reflects rising concerns over a global economic slowdown, and highlights the growing demand for safe haven assets like Gold.
📰 Tonight’s PCE data will offer key insights into inflation in the current macro context.
If PCE inflation decreases, Gold is likely to continue its rally.
However, if PCE shows higher inflation, we could see heavy sell pressure enter the market — leading to a sharp drop in XAUUSD.
That said, recent CPI and PPI data suggest that inflation may already be easing, supporting the bullish case — or at least explaining the early price surge.
🟡 Strategy for Today:
Look for early BUY entries during Asia & London sessions at key lower supports.
Avoid SELL positions for now — wait for price to reach major psychological resistance levels like $3100 before considering a short setup.
🧭 Key Levels:
🔻 Support: 3064 – 3055 – 3048 – 3040 – 3032
🔺 Psychological Resistance: 3090 – 3100 – 3106 – 3110
🎯 Trade Zones – 29/03:
BUY ZONE: 3056 – 3054
SL: 3050
TP: 3060 – 3064 – 3068 – 3072 – 3076 – 3080 – ???
🔴 SELL ZONE: 3100 – 3102
SL: 3107
TP: 3096 – 3090 – 3086 – 3082 – 3078 – 3074 – 3070
🧠 Final Reminder:
It’s Friday — and PCE inflation data tonight is crucial.
If you feel unsure or your trading psychology is shaky, stay out and wait for clarity post-news.
As always, respect your SL/TP levels and protect your capital at all costs.
Good luck, homies! Let’s trade smart.
— AD | Money Market Flow

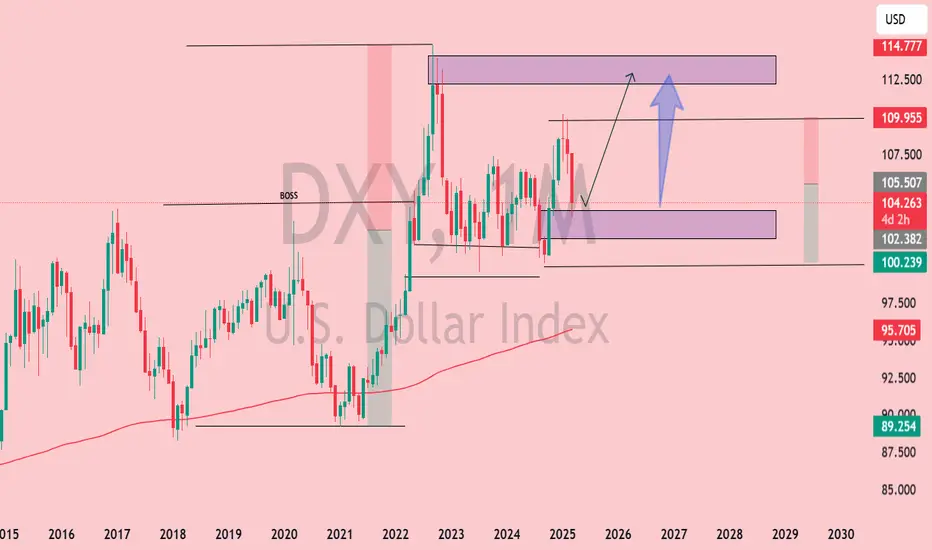
DXY Monthly Analysis: Key Support Holding, Bullish Move Ahead?📊 DXY Monthly Chart Analysis (March 27, 2025)
Key Observations:
Current Price Action:
The U.S. Dollar Index (DXY) is trading near 104.267, with notable resistance ahead.
Price is consolidating within a key demand zone (~102.5–104) after rejecting higher levels.
Technical Levels:
Support Zone: 100.2–104 (Highlighted in purple)
Resistance Zone: 112.5–114.7 (Highlighted in purple)
Major Resistance: 114.77 (Previous high, acting as a supply zone)
200-MA Support: Located below current price, offering a long-term bullish confluence.
Market Structure:
Price remains in a higher time-frame bullish trend but is experiencing a correction.
The "BOSS" level (Break of Structure) suggests a prior bullish breakout.
If the demand zone holds, a bullish continuation towards 112.5–114.7 is possible.
Projected Move:
A bounce from 102–104 could trigger a rally toward the upper resistance zone (~112.5).
A break below 100.2 could indicate a shift in trend and further downside.
Conclusion:
DXY is at a critical decision point. Holding the current support zone (~102–104) could fuel a bullish continuation toward 112–114, while a breakdown below 100.2 would weaken bullish momentum.
Hudco: price analysisHudco respects the resistance of 210 as the continuation of further bearish sentiment. The support of 197 will be the bullish invalidation, which means if the price supports this, then there are chances of reversal and retest of 210 for a breakout and a bull run.
Prices breaking down 197 will continue to fall till 181 and 163.

Gold Awaits – A Major Move Is Just Around the CornerGold has shown consistent structure since the start of this week.
Today, there are no major economic events, so price is likely to continue moving sideways within the current range, as previously analyzed in AD’s plan.
📌 Important Events Coming Up:
🔸 Thursday: US Quarterly GDP data
🔸 Friday: PCE Inflation Report (Key inflation indicator)
👉 These are the two most impactful news releases this week, and essentially wrap up Q1/month-end flows.
→ Global traders will be closely watching Thursday & Friday, so stay extra cautious during these two sessions.
🔄 Today’s Market Behavior:
Gold continues to range within the same channel shared earlier this week.
There is no clear breakout or strong directional move yet.
The market is essentially waiting for Thursday & Friday's data — which could act as the catalyst for a stronger bearish correction, in line with AD’s mid-term outlook.
🔍 Current Trading Strategy:
As shared from the beginning of the week, AD continues to trade reactions at key support and resistance zones.
Without a confirmed breakout, the approach remains:
→ Trade the range. React to both ends of the zone.
🧭 KEY LEVELS TO WATCH:
🔺 Resistance: 3,010 – 3,036 – 3,046 – 3,057
🔻 Support: 3,010 – 3,001 – 2,988
🎯 TRADE ZONES:
BUY ZONE: 2988 – 2986
SL: 2982
TP: 2992 – 2996 – 3000 – 3004 – 3008 – 3015
SELL ZONE: 3045 – 3047
SL: 3051
TP: 3042 – 3038 – 3034 – 3030 – 3026 – 3020
🧠 Final Reminder:
There is no breakout confirmation yet → market is still in accumulation mode.
Be patient, avoid FOMO, and watch price reaction closely at each zone.
➡️ Trade clean levels. Enter only when setups are clear — stay out if not.
Protecting your capital always comes first.
— AD | Money Market Flow

Bitcoin (BTC/USD) 4H Chart Analysis: Bullish Breakout Ahead?📈 Ascending Channel:
🔹 The price is moving upward within a parallel trend channel.
🔹 Blue arrows (🔵) indicate resistance points where the price struggled.
🔹 Red circles (🔴) highlight support areas where the price bounced.
🟦 Fair Value Gap (FVG) Zone:
🔸 The blue-shaded area (FVG zone) suggests a possible retracement before a bullish move.
🔸 If the price dips into this zone, it may find liquidity and bounce back up.
📊 Projected Price Movement:
⚡ Expected pullback → into FVG zone (🔽), then a bullish push (🚀) towards $90,686.72 🎯.
🟡 Yellow arrow shows the anticipated price path.
📉 Support & Resistance Levels:
✅ Support: Around $86,000 - $86,500 (FVG zone).
🚀 Target: $90,686.72 (next major resistance).
📌 Exponential Moving Average (DEMA - 9):
🔹 The blue line (DEMA 9) at $87,414.57 is acting as dynamic resistance.
🔹 A break above this could confirm further upside movement.
💡 Conclusion:
🔸 Bullish bias remains strong 📈.
🔸 Watch for a dip into the FVG zone before a potential rally 🚀.
🔸 If Bitcoin holds support, it may reach $90K+ soon 🎯🔥.

Advanced Technical ConceptOn the other hand, hidden divergence occurs when the price makes a lower low, but the RSI indicator makes a higher low, signaling a potential trend continuation. RSI Divergence occurs when the price movement and the RSI indicator move in opposite directions, signaling a potential reversal in the current trend.
Divergence within RSI through price movements is a powerful indication that there will be reversals in the market. There are two types of divergences: bullish divergences and bearish divergences. 1. Bullish divergence

Financial Markets Financial Markets include any place or system that provides buyers and sellers the means to trade financial instruments, including bonds, equities, the various international currencies, and derivatives.
Some examples: bank or credit unions, for loans or savings accounts. securities markets, such as the New York Stock Exchange or the American Stock Exchange, for businesses to acquire investment capital, mutual funds, or bonds.

Video For Traders Options trading is a type of financial trading that allows investors to buy or sell the right to purchase or sell an underlying asset at a fixed price, at a future date. Options trading operates on the basis that the buyer has the option to exercise the contract but is not under any obligation to do so.
Trading options offers a number of benefits for an active trader: Options can offer high returns and do so over a short period, allowing you to multiply your money quickly if your wager is right. With options, it can cost less to get the same exposure to a stock's price movement than it does to buy the stock directly.
