Gold (XAU/USD) – Possible Reversal from Resistance XAU/USD (Gold Spot vs. U.S. Dollar) on the 1-day timeframe and shows an ascending channel with key price levels and technical annotations.
Key Observations:
Trend Direction:
The price has been in a strong uptrend since late 2024.
It is currently near the upper boundary of the ascending channel.
Liquidity & Market Structure:
INT.LQ (Internal Liquidity): This suggests an area where liquidity is expected to be taken before a potential move.
MB Unfilled (Market Balances Unfilled): These indicate inefficiencies in price movement that the market may revisit.
Projected Price Action:
The chart shows a potential short-term pullback from the upper boundary.
Expected retracement towards the "fair value range" around $2,800–$2,850.
If this scenario plays out, it would align with price rebalancing and a healthier uptrend continuation.
Key Levels:
Resistance: Around $3,050, which aligns with the upper trendline.
Support Zones: Around $2,950 and deeper at $2,800.
Potential Trading Strategy:
Bearish Case: If rejection occurs at $3,050, short opportunities could exist targeting $2,900–$2,850.
Bullish Case: If price retraces and finds strong support in the fair value range, it could resume its uptrend.
Analysis

XAU/USD Analysis: Bearish Pullback Towards $3,000 SupportXAU/USD (Gold Spot vs. U.S. Dollar) Technical Analysis - 1H Chart
1. Price Action & Trend Analysis
The market has been in a strong uptrend, characterized by higher highs and higher lows.
Recently, the price faced resistance near the $3,040 level, leading to a rejection.
A pullback is currently in progress, suggesting a possible retracement to a demand zone.
2. Key Levels
Resistance Zone (Supply Zone): Around $3,040 - $3,045 where price has been rejected multiple times.
Support Zone (Demand Zone): Around $3,000 - $3,005, a previous accumulation area.
Current Price: $3,023.695
3. Market Structure & Expected Move
The price tested the resistance zone, failed to break above, and is now reacting downward.
A bearish projection (as shown in the chart) suggests a potential move toward the $3,000 - $3,005 support zone.
If the price reaches this level and finds buying pressure, we could see a reversal or continuation of the uptrend.
4. Indicators & Confluence Factors
Support-Resistance Flip: The previous support at $3,000 could act as a strong support again.
Bearish Momentum: Short-term price action suggests sellers are gaining control after rejection at resistance.
Liquidity Zones: The highlighted purple zones represent institutional order blocks where significant buy/sell orders exist.
5. Trading Plan & Strategy
Bearish Scenario: If price breaks below $3,000, we could see further downside pressure.
Bullish Scenario: A bounce from $3,000 could provide buying opportunities for another attempt at breaking $3,040.
6. Conclusion
The market is currently retracing from resistance, and a short-term bearish move is expected toward $3,000.
Traders should watch for price reaction at $3,000 to determine if it holds as support or breaks for further downside.

Advanced Swing Trading Strategy with Pcr Part-1So, an average put-call ratio of 0.7 for equities is considered a good basis for evaluating sentiment. In general: A rising put-call ratio, or a ratio greater than 0.7 or exceeding 1, means that equity traders are buying more puts than calls. It suggests that bearish sentiment is building in the market.
The Put-Call Ratio (PCR) is a popular technical indicator used by investors to assess market sentiment. It is calculated by dividing the volume or open interest of put options by call options over a specific time period. A higher PCR suggests bearish sentiment, while a lower PCR indicates bullish sentiment.

Divergence Trading With ProfessionalsDivergence in an uptrend occurs when price makes a higher high but the indicator does not. In a downtrend, divergence occurs when price makes a lower low, but the indicator does not. When divergence is spotted, there is a higher probability of a price retracement.
Divergence signals tend to be more accurate on the longer time frames. You get fewer false signals. This means fewer trades but if you structure your trade well, then your profit potential can be huge. Divergences on shorter time frames will occur more frequently but are less reliable.

Advanced Swing Trading Strategy with Pcr Part-2The Put-Call Ratio (PCR) is a popular technical indicator used by investors to assess market sentiment. It is calculated by dividing the volume or open interest of put options by call options over a specific time period. A higher PCR suggests bearish sentiment, while a lower PCR indicates bullish sentiment.
So, an average put-call ratio of 0.7 for equities is considered a good basis for evaluating sentiment. In general: A rising put-call ratio, or a ratio greater than 0.7 or exceeding 1, means that equity traders are buying more puts than calls. It suggests that bearish sentiment is building in the market.

All Financial MarketIn India, there exists broadly two types of Financial Markets which are further classified : Money Market is a market that deals with short-term funds. The capital market is a market that deals with long-sighted funds. Lenders and borrowers can trade funds through the financial system.
Different types of financial markets include stock markets, bond markets, forex markets, and commodities markets. Stock markets facilitate the buying and selling of company shares, while bond markets deal with debt securities. Forex markets enable currency exchange, and commodities markets trade physical goods.29 Aug 2024

Trading with Professionals Identifying the trend. This is the first step in technical analysis for traders because trading strategies can either follow the trend or go against the trend. ...
Drawing support and resistance levels. ...
Establishing entry and exit points. ...
Position sizing and risk management.
What exactly are the two types of technical analysis? Chart patterns and technical (statistical) indicators are the two main types of technical analysis. Chart patterns are a subjective type of technical analysis in which technicians use certain patterns to indicate regions of support and resistance on a chart.

Gold Outlook – Breakout or Pullback in the Final Week of March?🧠 Final Week of March: Will Gold Break Out or Pull Back? Complete Market Outlook + Trade Plan for XAUUSD
🌐 1. Fundamental Overview – Macro Factors Driving Gold
Gold experienced a sharp $50+ correction last week after printing new all-time highs. The recent price action was shaped by several key macroeconomic factors:
🔸 The Federal Reserve held interest rates steady and delivered a more cautious tone — suggesting no immediate rate cuts, which strengthened the USD and put pressure on gold.
🔸 US Dollar Index (DXY) recovered above the 104 mark, adding bearish momentum for XAUUSD.
🔸 Upcoming US inflation data (PCE this Friday) is the main event of the week — market participants are positioning cautiously ahead of this.
🔸 End-of-quarter fund flows may trigger erratic moves and profit-taking, especially as institutions rebalance portfolios.
Despite this pullback, late-week buying activity suggests that buyers are still defending key zones, and the medium- to long-term bullish structure remains intact.
📈 2. Technical Analysis – Chart Structure & Price Action
✅ Market Context:
Price broke out of the short-term ascending channel but is still respecting the major uptrend structure
Currently testing support zones with potential for either continuation or deeper correction
Key zone around 3,013.67 is holding for now, but volatility is expected
🆕 Monday Opening (March 25, 2025) Update:
Gold opened with weakness after a brief end-of-week bounce
Price is currently stalling at a key Fibonacci retracement area (0.5–0.618) on H1/H2
Buyers have lost momentum, suggesting a consolidation or second leg down may be forming
🔁 Scenarios:
🟢 Bullish Scenario:
Price holds above 3,000 / 2,987 zone
Rebound to test 3,031.80 → breakout → targets 3,046.38 and 3,057.58
🔴 Bearish Scenario:
Failure to hold 3,000 → break below 2,987 → opens downside continuation
Price could revisit deeper demand zones below (e.g., 2,970–2,950)
📌 Key Levels:
Resistance: 3,031- 3,046 - 3,057
Support: 3,013 - 3,000.33 - 2,987
🎯 TRADE PLAN – XAUUSD
BUY ZONE: 3000 – 2998
SL: 2994
TP: 3004 – 3008 – 3012 – 3016 – 3020
SELL ZONE: 3030 – 3032
SL: 3036
TP: 3026 – 3022 – 3018 – 3014 – 3010 – 3000
Trade within reaction zones. Prioritize partial profits and always protect your capital with tight SLs.
✅ Conclusion:
Gold is still technically bullish but in a corrective phase
Market awaits confirmation from either bulls or bears before a clean breakout
News flow + macro data (PCE) will be key catalysts this week
Stay patient, trade the levels, and let price action lead
— AD | Money Market Flow

WHY DO 97% OF TRADERS LOSE MONEY IN THE MARKET?🧠 WHY DO 97% OF TRADERS LOSE MONEY IN THE MARKET?
And what should you truly prepare before you begin?
You’ve probably heard this one before:
“97% of traders lose money.”
Not because they’re not smart.
Not because they lack a good strategy.
But because they enter the market with the wrong mindset and unrealistic expectations.
❌ The market is not a gold mine — not for everyone
Many people step into trading thinking:
“Forex is a money printer. Anyone can just come in and take what they want.”
But here’s the truth:
👉 The market doesn’t hand out profits. It takes money from the unprepared and gives it to the disciplined.
It doesn’t care about your dreams — it only respects your readiness.
💸 You will lose money — and it will sting
Even if you believe your strategy is solid, it will fail at some point.
And when it does, the price you pay is real money — your own money.
And because it’s your hard-earned money, you’ll feel the pain. You’ll get emotional.
You’ll want to get it back. You’ll enter trades impulsively.
And that’s exactly when the market will drag you by the nose.
⚠️ The biggest mistake: thinking a good strategy is enough
Most new traders believe:
“Once I have a working strategy, I’ll be consistently profitable.”
But the truth is:
Every strategy fails sometimes
The market doesn’t follow your logic
A bad entry isn’t what ruins you — refusing to cut the loss is
🧘♂️ So what should you actually prepare before trading?
If you’re about to start trading — or afraid to fail early — make sure to prepare:
✅ A solid foundation of knowledge
✅ A mindset that accepts loss without losing control
✅ The ability to say: “It’s okay to lose a trade — I just need to survive long enough to learn and grow.”
📌 Other people’s strategies won’t make you profitable
Yes, I often share my outlooks, plans, and even potential entry zones.
But always remember:
My view is just a perspective — not a guarantee of success.
Trading is personal.
You’ll only become consistently profitable when:
You trust in a system you’ve practiced yourself
You take trades because you see the logic, not because someone else agrees with you
🔄 Trading is a process: Try – Fail – Learn – Repeat
I’ve lost. I’ve been stubborn. I’ve gotten emotional.
And I learned:
You don’t need to win all the time.
You just need to survive your losses and come back smarter.
A stop-loss isn’t failure.
It’s the most mature decision you can make in a chaotic environment.
🤝 I won’t promise that you’ll make money
The knowledge I share — the views I post —
may not make you rich.
But I believe:
They can help you avoid losing money needlessly.
Don’t believe anyone 100% — not even me.
Take what you learn, test it, and turn it into your own conviction.
That’s how you grow.
❤️ Final thoughts
Trading isn’t a game of prediction — it’s a test of psychology.
You don’t have to be the best trader.
You just need to protect your capital, protect your mindset, and keep showing up.
Wishing you all a peaceful weekend with your loved ones.
Tomorrow, we return to the market — sharper, calmer, and more disciplined.
The market will always be there. The real question is: will you still be here to trade it next month, next year?
— AD | Money Market Flow

Advanced Technical Analysis #DivergenceDivergence is when the price of an asset is moving in the opposite direction of a technical indicator, such as an oscillator, or is moving contrary to other data. Divergence warns that the current price trend may be weakening, and in some cases may lead to the price changing direction.

Trading Management and PsychologyWhat are the components of trading psychology?
In this blog, we’ll examine the essential components of trading psychology and offer techniques for cultivating a winning attitude. 1. The Role of Emotions in Trading 2. The Psychology of Risk Management 3. Overcoming Cognitive Biases 4. Developing a Trading Mindset 5. Dealing with Trading Losses 6. The Role of Discipline and Patience 7.

WEEKLY GOLD OUTLOOK – BIG PICTURE VIEW FOR THE HOMIES!🔍 Let’s take a quick look at Gold on the higher timeframes (W1 & D1) —
The weekly and daily candles are showing long upper wicks, indicating strong rejections from the highs due to last Friday’s correction.
📉 Gold dropped more than 50 points toward the end of the week, but later bounced back with a late-session recovery.
Looking at the W1 and D1 candles, there are early signs of a possible reversal, but momentum still seems not strong enough, as prices retraced over 20 points into the close, making the candle bodies close above 50% of the full D1/W1 range.
🧭 From AD’s perspective, price has now reacted at the all-time high zone, and we need to wait for Monday to confirm whether the bulls can push higher again — only then can we establish a full directional bias for the upcoming week.
We're now stepping back to get a broader view of price action and macro sentiment, reviewing all the latest news & market developments before entering the final week of the month...
📈 Current View from AD:
Gold is still moving inside its main bullish channel on the higher timeframes. However, in order for a true reversal to form, strong selling pressure must come in, triggering larger volumes and pushing price down into low-liquidity zones.
That said, buyers stepped back in near the weekly close, so we’ll need to closely watch:
Possible weekend gaps
Price action around the Sunday night open
This will help us determine the most accurate direction heading into Monday.
⚠️ There’s a chance we’ll see another drop, as this current bullish retracement is reaching the 0.5 – 0.618 zones on H1 and H2.
But like AD said, the real story unfolds on Monday once the leftover weekend volume gets absorbed and clean market structure reveals itself.
📌 Key Levels to Watch:
Resistance: 3025 – 3033 – 3040 – 3046 – 3056
Support: 3014 – 3005 – 3000 – 2993 – 2986
📊 Based on the MA indicators AD uses, short-term moving averages are starting to cross over mid- and long-term MAs, indicating a potential major trend shift on higher timeframes.
💡 If this structure holds into early next week, we might get early SELL opportunities, so stay alert and stick close to candle structure.
📍AD has already marked the key levels on the chart —
These are high-probability zones for entry or breakout traps, so don’t miss out on golden opportunities. Save them. Watch them.
💬 Wishing everyone a warm and joyful weekend with your family and loved ones.
AD will drop a post tomorrow on market psychology — if you’re interested, drop a boost and leave a comment!
GOOD WEEKEND HOMIES! 💛

Gold Analysis -MMF- Profit-Taking Signals Opportunity🚀 Critical Levels Today! 📊
✅ Yesterday’s Recap: Our previous analysis hit around 90% accuracy 🎯, with gold responding perfectly at historical highs, prompting traders to book profits early in the European session. The bearish momentum is continuing into today's Asian session. 📉
📌 Market Sentiment:
Profit-taking is the primary driver at these historic highs. Investors are carefully eyeing lower liquidity zones for re-entry, positioning themselves strategically for future gains as global economies lean towards rate-cut cycles and an era of cheaper money. Historically, such cycles strongly favor gold prices. 🌟💰
📌 Technical View:
Technical signals align closely with fundamentals: reversal signals at recent highs are mild, suggesting cautious profit-taking rather than aggressive short-selling. Gold traders are merely scouting temporary peaks cautiously, not heavily bearish yet. ⚠️🔍
📉 Critical Levels:
🛑 Resistance: 3038 | 3046 | 3056 | 3070
🟢 Support: 3030 | 3025 | 3014 | 3005
Currently, gold has broken the bullish H1 channel, testing immediate support at 3025. A strong breakdown below this level could trigger deeper bearish moves, especially today—Friday volatility could drive intense movements targeting lower liquidity zones. 🔻🔥
🎯 Strategic Trading Zones:
🚨 BUY ZONE: 📈
Entry: 3006 - 3004
Stop Loss (SL): 3000 🛡️
Take Profit (TP): 3010 | 3015 | 3020 | 3025 | 3030 🎯
🚨 SELL ZONE: 📉
Entry: 3056 - 3058
Stop Loss (SL): 3062 🛡️
Take Profit (TP): 3052 | 3048 | 3044 | 3040 | 3035 | 3030 🎯
⚡ Today’s Action Plan:
Focus closely on Asian & European sessions. Updates will be provided ahead of the US session, anticipating high volatility and profit-booking activities. Stay disciplined, strictly adhere to your TP & SL to protect your account! 🙌💼

Advanced Technical Analysis 'Support' and 'resistance' are terms for two respective levels on a price chart that appear to limit the market's range of movement. The support level is where the price regularly stops falling and bounces back up, while the resistance level is where the price normally stops rising and dips back down.
Support is a price point below the current market price that indicate buying interest. Resistance is a price point above the current market price that indicate selling interest. S&R can be used to identify targets for the trade. For a long trade, look for the immediate resistance level as the target.

Advanced Candlesticks Part -2Candlestick patterns provide insight into price action at a glance. While the basic candlestick patterns may provide some insight into what the market is thinking, these simpler patterns often generate false signals because they are so common. Below, we will look at more advanced candlestick patterns that offer a higher degree of reliability.
The Tweezer Top candlestick pattern is a bearish reversal pattern that signals a potential shift from an uptrend to a downtrend, characterized by two consecutive candlesticks with nearly identical highs, suggesting buyers are losing control and sellers are gaining ground.

Technical Analysis Advanced candlesticks These advanced candlesticks are associated with strong price moves, and often gaps, which cause sharp shifts in direction. Traders can participate by noticing these patterns and acting quickly to get in as the price moves in the new direction. Candlestick patterns do not have price targets, which means traders shouldn't get greedy.

GOLD (XAU/USD) Trading Plan: Will Gold Break $3100? 🚀Published by MMFlowTrading on March 20, 2025
Overview 📊
Gold (XAU/USD) is in a strong uptrend on the H1 timeframe, with price action moving within a clear ascending channel 📈. The recent breakout above the $3000 psychological level signals robust bullish momentum 💪. However, key resistance levels are approaching, and upcoming economic events might influence the next move. Let’s dive into the technical and fundamental factors to craft today’s trading plan! 🧠
Technical Analysis 🔍
Ascending Channel:
Gold is trading within a well-defined ascending channel (highlighted in orange on the chart) 📉📈. The price has respected both the upper and lower boundaries, indicating a healthy uptrend. Currently, the price is near the upper channel resistance at $3070.612 🚧.
Key Resistance Levels (VPOC High):
The nearest resistance is at $3070.612, a high-volume node (VPOC) where sellers might step in 🛑.
If this level is broken, the next targets are $3081.053 and $3097.774, with a potential push toward the psychological $3100 mark 🎯.
Key Support Levels:
The closest support is at $3031.774, aligning with the lower channel boundary and a previous VPOC level 🛡.
A deeper pullback could test $3024.254 or even $3017.197, where buyers previously stepped in (marked by yellow circles on the chart) 📍.
Additional Key Levels:
Resistance: $3054 - $3061 - $3070 🚧
Support: $3044 - $3038 - $3031 - $3026 🛡
Fundamental Analysis 🌍
US Dollar Strength:
Gold has an inverse relationship with the USD 💱. On March 20, 2025, the market is awaiting the US Jobless Claims data and Fed speeches, which could impact the USD 📅. If the data indicates a weaker US economy, the USD might weaken, supporting Gold’s rally toward $3100 🚀.
Geopolitical Tensions:
Ongoing global uncertainties (e.g., Middle East tensions, US-China trade talks) continue to drive demand for safe-haven assets like Gold 🛡. This fundamental factor supports the bullish bias in the short term.
Interest Rates:
The Fed’s recent dovish stance on interest rates (as of early 2025) has reduced the opportunity cost of holding Gold, further fueling its uptrend 📉.
Trading Plan 📝
Buy Setup (BUY ZONE: $3032 - $3030) 🟢
Stop Loss (SL): $3026 ⛔️.
Take Profit (TP): $3038 - $3042 - $3046 - $3050 - $3060
Sell Setup (SELL ZONE: $3069 - $3071) 🔴
⛔️Stop Loss (SL): $3075
Take Profit (TP): $3065 - $3060 - $3055 - $3050
Market Note ⚠️
The market has been hitting all-time highs (ATH) after the FOMC storm early this morning 🌪. Traders, please stay cautious and strictly follow your TP/SL to keep your accounts safe! 🛡💡
Conclusion 🏁
Gold is at a critical juncture near $3070. A breakout above this level could pave the way to $3100, driven by strong technicals and supportive fundamentals 🚀. Alternatively, a rejection might lead to a pullback to the $3032 - $3030 buy zone. Stay disciplined and trade smart! 💪
What do you think about this setup? Drop your thoughts in the comments below! 👇 For more daily trading ideas, follow me on TradingView

XAU/USD 1H – Bullish Continuation from Demand Zone?📊 XAU/USD (Gold) 1H Analysis – Bullish Continuation Setup
🔹 Market Structure: Gold has been in a strong uptrend, with price currently consolidating near a key demand zone.
🔹 Key Levels:
🔴 Resistance: $3,050 - $3,060 (Potential target)
🟣 Demand Zone: $3,030 - $3,035 (Support area)
🟠 Deeper Support: $3,025 (Break below weakens bullish bias)
📈 Potential Trade Setup:
1️⃣ A possible pullback into the demand zone could attract buyers.
2️⃣ Price may wick below liquidity before reversing.
3️⃣ If support holds, we anticipate a move toward $3,050+.
✅ Entry Zone: $3,030 - $3,035
🎯 Target: $3,050 - $3,060
🚨 Stop Loss: Below $3,025
⚠️ Watch for price action confirmation before entering. A strong bullish candle from support could signal entry. Let the market show its hand! 🚀✨

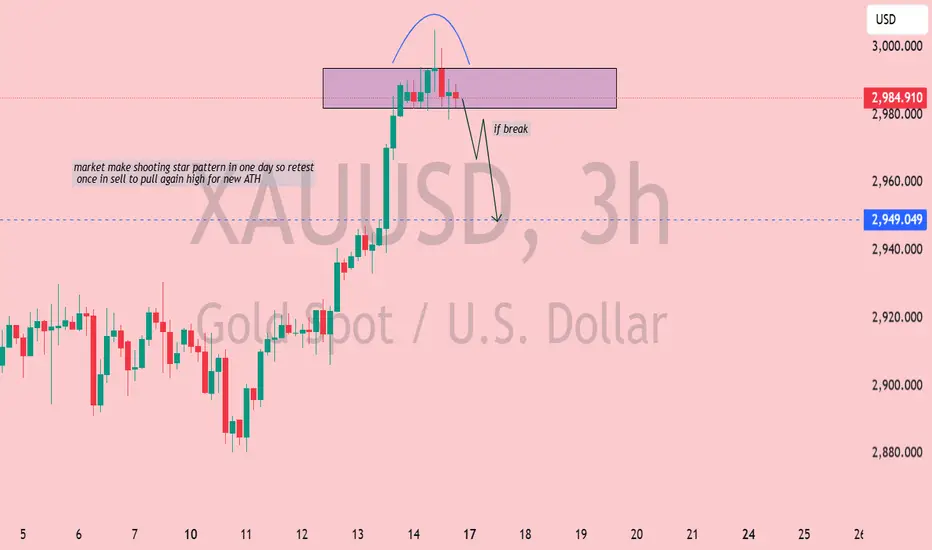
XAUUSD Analysis: Bearish Reversal with Potential for Liquidity📉 XAUUSD (Gold Spot vs USD) Analysis - 3H Chart
🌟 Shooting Star Pattern Detected: The market has formed a shooting star, a bearish reversal candlestick, signaling potential weakness at the top.
📍 Key Resistance Zone (Purple Box): Price action has been rejected from this area, showing strong selling pressure.
🔍 If Break Scenario: Should the price break below the 2,949 support zone (🔵), we can expect a bearish drop 📉 with potential liquidity grab before a pullback for a new all-time high (ATH) 🚀.
🧐 Market Sentiment: Bearish bias for now, but watch for a potential reversal after liquidity is swept.
✅ Trader's Tip: Wait for a clean break and retest before entering a short position. 🎯
XAU/USD Bullish Outlook: Wyckoff Accumulation & Breakout PotentXAU/USD (Gold) - 2H Chart Analysis 🏆📈
🔹 Wyckoff Structure Insight
The chart shows signs of a Wyckoff Accumulation phase.
UTAD (Upthrust After Distribution) at the previous highs suggests a liquidity grab.
Test of the resistance level before a strong rejection downward.
SOW (Sign of Weakness) was observed, but buyers regained control.
🔹 Key Technical Levels
Fair Value Range marked below, showing a potential area of demand.
Unfilled Imbalance (EMB unfilled) signals an area where price might revisit before continuing upward.
Gap below indicates a previous liquidity sweep before the bullish reversal.
🔹 Trend & Price Action
Current price action is showing higher lows and bullish structure development.
Projected bullish move 📈 is expected to test the $2,940+ region.
🔹 Trading Bias: Bullish ✅
A retracement to the EMA or minor pullback could offer re-entry opportunities.
Invalidation level: Below $2,900, where momentum could shift bearish.
🚀 Gold remains strong; watch for breakouts above $2,940!

Bitcoin (BTCUSD) Rejection – Bearish Move Incoming?📉 Key Observations:
Resistance Zone (Purple Box): Price has tested this area and faced rejection.
Bearish Projection (Gray Box & Arrow): The chart anticipates a drop towards the $76,800 - $77,000 range.
Liquidity Grab? Price might consolidate before a sharp decline.
⚠️ Possible Scenarios:
Rejection Confirmation 🔻: If BTC fails to reclaim $84,470, selling pressure could increase.
Breakout Fakeout? 🤔: A deviation above resistance followed by a dump remains a risk.
🎯 Levels to Watch:
Resistance: $84,470 - $85,078
Support: $80,000 and $76,825
🔥 Final Take: If BTC struggles below resistance, a short setup could play out. Confirmation is key!

XAG/USD (Silver) 4H Chart Analysis – Bearish Setup📉 XAG/USD (Silver) 4H Chart Analysis – Bearish Setup 🚨
🔍 Key Observations:
Supply Zone (POI - Point of Interest) 🟪: The price is approaching a strong resistance area around $33.23 - $33.50.
Liquidity Grab (LQ) & Rejection Expected ❌: The previous major liquidity zone (LQ) suggests a possible fake breakout or rejection.
Bearish Projection ⬇️: The chart outlines a potential reversal after reaching resistance, leading to a drop towards $31.00 - $30.50.
📌 Trading Plan:
Short Entry 🎯: Around $33.20 - $33.50 (if price rejects this area).
Target 🎯: Major demand zone at $31.00.
Stop Loss 🚨: Above $33.60 (to avoid fakeouts).
Confirmation Needed 📊: Look for bearish candlestick patterns (e.g., engulfing, wicks, or double top formations).
⚠️ Final Thoughts:
Bearish Bias ⚠️ unless price breaks and holds above $33.50.
Monitor market conditions 🧐—news and fundamentals could shift momentum.
🔥 Trade smart! What do you think?

Database Trading# **Database Trading**
Database trading leverages **historical market data, AI, and quantitative analysis** to identify high-probability trade setups.
✅ **Data-Driven Approach:** Uses past price action, volume, and indicators.
✅ **Backtesting & Optimization:** Tests strategies on historical data for accuracy.
✅ **Automated Execution:** Uses algorithms for fast, precise trading decisions.
### **Conclusion**
This method enhances **consistency, precision, and risk management**, making trading more systematic and efficient. 🚀
