ETHUSDT/BTCUSDT Short idea 11/11/2025Wassup Lads!
This looks like a very enticing short setup simply because
1. Price in a daily bearish fair value gap
2. We have SMT Divergence between BTC and ETH on the daily time frame
Switching over to the H1 time frame I'm clearly seeing price print out a bearish orderflow, I have not yet entered but will look to enter a sell postion on retracement to the H1 Bearish fair value gap, targeting a basic 1 to 2 risk to reward ratio. So basically, if price retraces to the h1 bearish fair value gap I'll look for shorts or I'm happy waiting on the sidelines for a new setup.
As always -
1. Manage your risk
2. Stay disciplined
3. Do your own research
One wrong trade can spoil months of discipline
Keep winning!!
Analysis

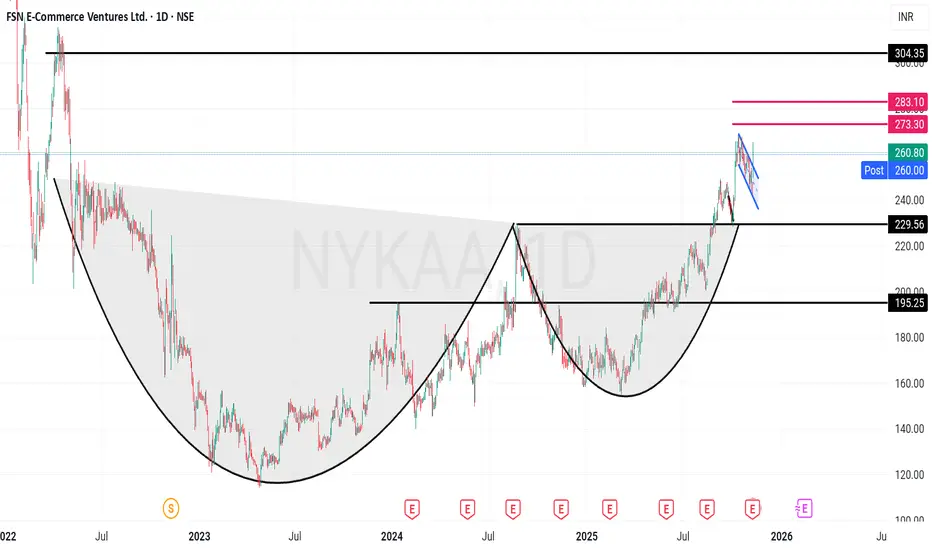
Nykaa - Strong Growth Cup & Handle with Detailed fundamentalsFSN E-Commerce Ventures Limited (Nykaa) – Technical & Fundamental Analysis
Company Overview:
FSN E-Commerce Ventures Limited (Nykaa) is a digitally native consumer technology platform, delivering a content-led, lifestyle retail experience. Since its incorporation in 2012, the company has focused on designing a differentiated brand discovery journey for its consumers. It offers a diverse portfolio of beauty, personal care, and fashion products, including owned-brand products manufactured in-house. Nykaa provides an omnichannel experience to cater to consumer preferences and convenience.
Technical Analysis
Chart Patterns: Cup and handle breakout; Today 1-hour parallel channel breakout
Current Market Price (CMP): ₹260
Targets: ₹301, ₹350
Support Levels: ₹230, ₹195
Recent News & Highlights
✅Q1 FY26 Results: Consolidated net profit surged 142% YoY to ₹23.30 Cr; revenue up 23.4% to ₹2,155 Cr
✅Arbitration Win: Nykaa Fashion received ₹10 Cr compensation from arbitration award
Q1 FY26 Guidance: Management anticipates consolidated net revenue growth at lower end of mid-twenties range YoY
✅Fashion Segment Target: Company expects EBITDA breakeven in fashion by FY26
✅Organic Portfolio Expansion: Aims to increase organic portfolio by 30% annually to reach ₹6,000 Cr GMV
✅Q4 FY25 Performance: EBITDA ₹133 Cr vs ₹93.28 Cr YoY; EBITDA margin improved to 6.47% from 5.59%
✅Corporate Action: NCLT approved merger of Iluminar Media (LBB) into Nykaa Fashion
Analytical Summary
Operational Excellence: Revenue growth of 24.5% YoY with net profit doubling to ₹66.08 Cr demonstrates strong execution and operating leverage. The company is scaling both beauty and fashion verticals while expanding margins.
Capital Structure: Debt increased 41% to ₹961 Cr, but debt-to-equity remains negligible at 0.04, showing conservative leverage. ROE at 5.9% suggests room for improvement in capital efficiency.
Valuation Risk: PE of 675.77 and PB of 40.5 reflect aggressive growth expectations. EV/EBITDA of 117.5 leaves minimal margin of safety, requiring caution for long-term investors.
SWOT Analysis
Strengths (16 Factors):
Rising net and operating cash flows for 2 consecutive years
Strong EPS growth; quarterly profit margins expanding
Improving RoCE, ROE, and ROA
Consistent revenue growth for past 2 quarters
Clean governance; zero promoter pledge
Weaknesses (3 Factors):
Promoter shareholding dilution
Expensive valuation (PE > 40) limits margin of safety
Opportunities (1 Factor):
Increasing FII/FPI shareholding validates institutional interest
Disclaimer
This analysis is for educational and informational purposes only. It does not constitute investment advice. Trading and investing in stocks involve risks, and individuals should conduct their own due diligence or consult with a qualified financial advisor before making any investment decisions. The author is not responsible for any gains or losses arising from the use of this analysis.
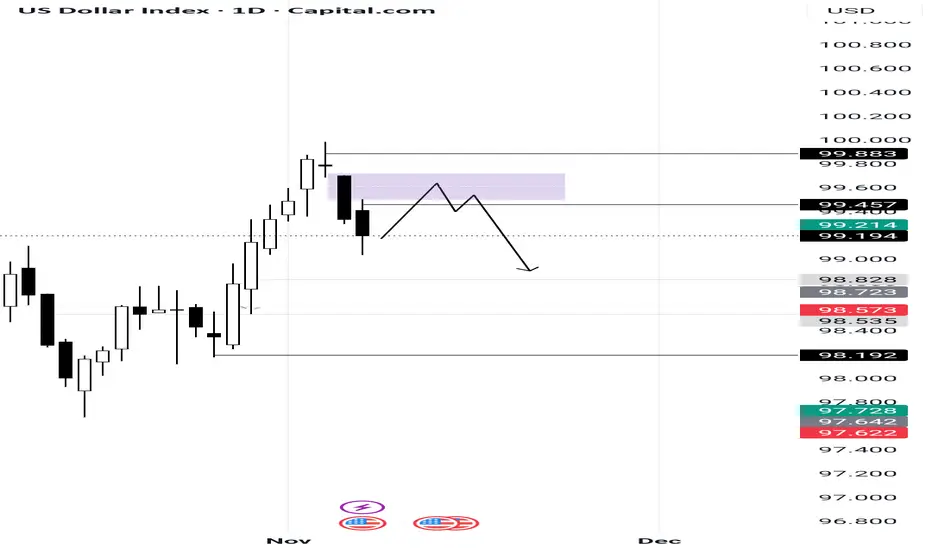
DXY Weekly Outlook 10/11/2025 - 14/11/2025Wassup Lads!
The dollar index has closed sharply into the weekly range and has formed a daily swing point and a strong rejection candle on the weekly time frame. I am expecting dollar to retrace to the bearish daily fair value gap and continue lower.
I recommend you to -
1. Maintain your risk
2. Stay disciplined
3. Do your own research
Let's win the week
Cholamandalam Financial Holdings Ltd (CFHL) Triangle Breakout 1DCholamandalam Financial Holdings Ltd (CFHL) – Triangle Breakout & 1-Year Resistance Breakout 🚀
📊 Technical View:
CFHL has given a triangle breakout along with a 1-year resistance breakout, indicating strong bullish momentum. If Trend continues, The price action also shows a successful retest of the breakout zone, shows trend continuation.
Resistance Turned Support: ₹1650 – previously a resistance, now acting as strong support.
Current Action: Price broke above the ₹1650 range, retested the level today , and is now moving upward again.
Next Resistance Targets Levels: ₹1824 / ₹2004
Support Levels: ₹1536 / ₹1410
🏦 Company Overview:
Cholamandalam Financial Holdings Limited (CFHL), incorporated in 1949, is a part of the Murugappa Group, one of India’s most diversified business conglomerates.
CFHL is a Non-Deposit Taking Systemically Important Core Investment Company (CIC) registered with the Reserve Bank of India (RBI).
The company holds substantial investments in group companies and provides a diverse range of financial products and risk management services to individual and corporate clients through its subsidiaries and group companies.
📈 For educational purpose only. Not a buy/sell recommendation.

Tamilnad Mercantile Bank (TMB) – Update | 3.5% Move from Our Lvl🟢 Tamilnad Mercantile Bank (TMB) – Update | 3.5% Move from Our Level 🚀
Latest Update : Our analysis shared around ₹499 has played out well — TMB made an intraday high of ₹517, gaining nearly 3.5% from the mentioned level.
🏦 Company Overview:
Tamilnad Mercantile Bank Limited is one of the oldest and leading old private sector banks in India. The bank offers a wide range of banking products and services to retail, MSME, agricultural, and corporate customers.
Retail Products: Home loans, personal loans, auto loans, educational loans, business loans, and security-backed loans.
MSME Portfolio: Loans for manufacturing, traders, and service sector enterprises.
Agricultural Loans: Offered to individual farmers, farmer groups, agri-businesses, and agri-corporates.
📊 Technical View:
High Reached: ₹517 (▲3.5%)
Resistance: ₹510 – price tested and faced mild rejection here.
Supports: ₹466 / ₹440
💡 View: The stock showed strong momentum from the support zone and approached its major 1-year resistance area near ₹510–₹515. A sustained close above ₹515 can confirm a breakout and open the next upside targets of ₹535 / ₹600.
📈 For educational purpose only. Not a buy/sell recommendation.

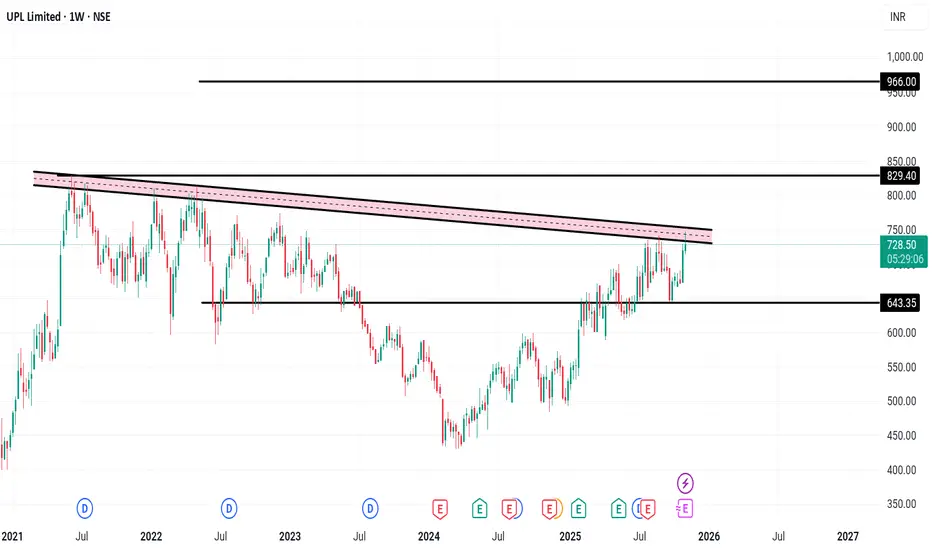
UPL Limited – Weekly Chart Analysis
📊 UPL Limited – Weekly Chart Analysis
Company Overview:
UPL Limited is a global leader in sustainable agricultural solutions, ranked among the top five agricultural solutions companies worldwide. The company operates across multiple countries, offering an integrated portfolio of patented and post-patent agricultural solutions for both arable and specialty crops — including biologicals, crop protection, seed treatment, and post-harvest solutions.
UPL is principally engaged in:
Production and sale of agrochemicals, field crops, and vegetable seeds
Non-agro business of industrial chemicals, chemical intermediates, and speciality chemicals
With market access across the world’s food basket, UPL is focused on driving growth and innovation throughout the entire agricultural value chain — from growers to distributors and partners. 🌱
📈 Technical View (1-Week Chart):
A trendline formation is observed on the weekly timeframe, indicating a potential breakout setup.
Resistance: ₹830 – strong resistance zone. A breakout above this level can trigger the next target near ₹930.
Support: ₹643 – strong support base.
This formation suggests the move could take time to play out, as it’s developing over the weekly chart.
📊 Key Financial Snapshot:
UPL’s current market price is around ₹724.15 with a P/E ratio of 11.65. The company holds a market capitalization of ₹61,068.53 crore and offers a dividend yield of 0.83%.
In the latest quarter, net profit stood at ₹612 crore, reflecting a 125.74% increase compared to the previous quarter. Quarterly sales were ₹12,019 crore, showing an 8.38% rise. The company’s Return on Capital Employed (ROCE) is 7.66%, indicating stable operational efficiency.
Disclaimer: For educational purposes only, not investment advice
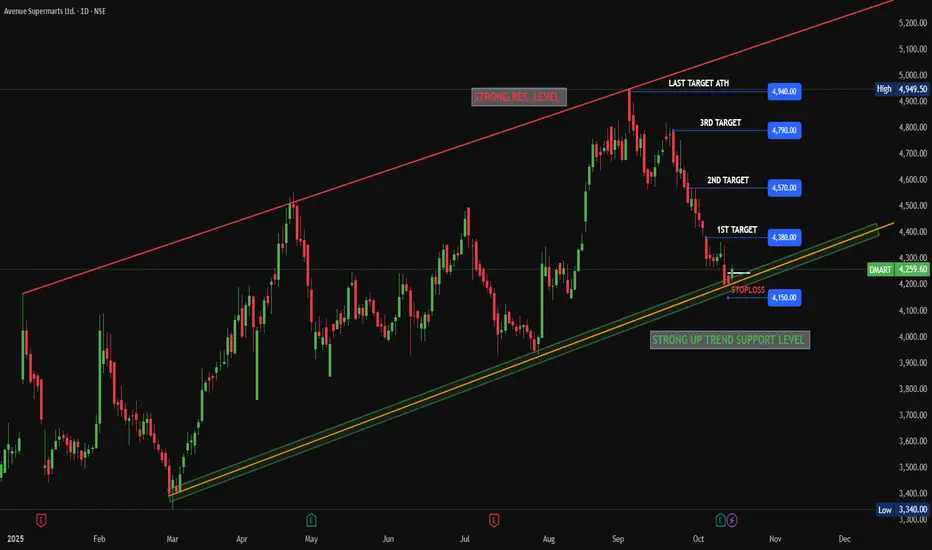
DMART LONGDMART (Avenue Supermarts) has reached a strong trend support level. Additionally, in the daily timeframe, the current candle closed at the previous day's candle level.
Therefore, we can go long in DMART for a swing trade. Fundamentally, the quarterly results are already out, so there is no immediate issue regarding upcoming events.
Go long on DMART, but make sure to manage your trade quantity, risk, and reward based on your risk appetite. This is for educational purposes only and does not guarantee returns.
Real value of Market # Entry #Exit #Trail # StoplossThe phrase "Market # Entry #Exit #Trail # Stoploss" refers to the core parameters of a structured trading plan. The "real value" does not imply a single numerical figure, but rather the monetary gain or loss realized from a trade based on how these elements are defined and executed, combined with the discipline to follow them consistently.
Market: The specific financial instrument or market being traded (e.g., a particular stock, currency pair, or commodity).
Entry: The predefined price level or condition at which a trader opens a position. A good entry can offer a favorable risk-to-reward ratio from the start.
Exit: The predefined strategy or points at which a trader closes a position, either to take a profit or to limit a loss. Exits are crucial as they determine the final profit or loss.
Trail: Refers to a trailing stop-loss order, a dynamic risk management tool that automatically adjusts the stop-loss level as the market price moves in the trader's favor. This locks in profits while allowing the trade to continue if the price keeps moving favorably.
Stoploss (SL): A pre-determined price level or percentage below (for a long position) or above (for a short position) the entry price where the position is automatically closed to prevent further losses if the market moves against the trader.

Price Halts and Power of Confluence The price chart displays a noteworthy transformation as a previous supply zone evolves into an area of strong demand, illustrating a crucial market shift. The highlighted supply region, which had earlier capped price advances and attracted selling interest, has now transitioned into a price zone where buyers are stepping in, creating multiple reactions that signify growing demand as prices revisit this level.
- Supply to Demand Conversion: The red-shaded supply band acted as a ceiling for prices historically, but recent moves show price halting and consolidating above this region, marking a critical change in the market’s balance. This type of consolidation—where price compresses and pauses just after clearing a major supply area—is a visible sign of acceptance by market participants, as both buyers and sellers reassess value at this pivotal zone.
- Consolidation as Price Stability: Observing the price action post-supply area, there is clear evidence of tight, sideways movement—an area of price equilibrium or market indecision. This consolidation signals an important digestion phase, a hallmark of healthy price action
- Trendline Confluence: The thick green upward trendline adds a second layer of technical strength to this setup. Historically, prices have repeatedly taken support on this trendline during corrections, aligning perfectly with the newly converted demand area. This intersection of the time-based trendline with the horizontal supply/demand zone forms a strong confluence. Confluence zones like this are typically high-probability areas of interest, as the overlap of structural (trendline) and behavioral (supply/demand) features amplifies the significance of the region and attracts greater participation from market players.
-

Tamilnad Mercantile Bank – 1D Chart | Strong Resistance Zone🟢 Tamilnad Mercantile Bank (TMB) – 1D Chart | Strong Resistance Zone Ahead
📊 Chart Setup:
TMB is testing its major 1-year resistance zone around ₹510, a key level that has capped price movements for months. A strong daily close above ₹510 could trigger momentum towards higher targets.
🔹 Resistance: ₹510 (Major 1-year resistance)
🔹 Targets on Breakout: ₹535 / ₹600
🔹 Supports: ₹466 / ₹440
🔹 View: Price consolidating near breakout zone. Sustained close above ₹510 can signal trend continuation.
🏦 Fundamental Update – Q2 FY26 Results Highlights:
Tamilnad Mercantile Bank delivered steady performance with profit growth and improved asset quality.
• Net Profit: ₹318 Cr ↑ (▲4.95% YoY)
• Total Business: ↑11.40%
• Deposits: ₹55,421 Cr ↑12.32%
• Advances: ↑10.5%
• Net Interest Income: ₹597 Cr ↑0.17%
• Gross NPA: ↓ to 1.01%
• Net NPA: ↓ to 0.26%
• Capital Adequacy Ratio (CAR): Strong at 30.96%
➡️ Stable performance, improving asset quality, and strong capital base add confidence to the technical setup.
📈 For educational purpose only. Not a buy/sell recommendation.

TechnoFunda Analysis: ASK Automotive Ltd(ASKAUTOLTD)In the ever-evolving automotive landscape, ASK Automotive Ltd stands out as a powerful blend of technical resilience and fundamental strength. With strong operational performance, expanding margins, and rising institutional confidence, the company has emerged as one of India’s leading auto component players specializing in braking systems, aluminum precision parts, and EV-compatible components.
Let’s decode ASK Automotive from both Technical and Fundamental perspectives to assess its investment potential for long-term investors and swing traders alike.
**************Technical Analysis*******************
ASK Automotive is currently in a buy zone, with a favorable risk-reward setup supported by higher timeframe structure. Traders can accumulate near supports with a stop loss below ₹470 for targets up to ₹540–560.
For investors, the current price offers a good entry point for long-term compounding given the synergy between chart strength and business fundamentals.
Trend: Uptrend remains intact across all major timeframes.
Momentum Indicators: RSI is recovering from the 40–45 zone, hinting at renewed bullish momentum.
Volume Action: Rising volume near the 200 EMA suggests smart money accumulation.
Short-Term View: A decisive close above ₹500 could lead to a near-term rally towards ₹540–560.
Medium-Term View: Sustained trading above ₹560 may open the path toward ₹600+ in the coming months.
**************Fundamental Analysis***************
1. Company Overview
Incorporated in 1988, ASK Automotive Ltd is one of India’s largest manufacturers of Advanced Braking Systems, supplying critical friction and safety components to leading two-wheeler and four-wheeler OEMs such as Hero MotoCorp, Honda, Suzuki, TVS, Bajaj, and Royal Enfield.
The company has diversified into lightweight aluminum precision solutions and EV-compatible products, making it a forward-looking player in India’s auto ancillary space.
2. Industry Analysis
India’s auto component industry is projected to grow at a CAGR of 10–12% over the next 5 years, driven by:
Increasing domestic vehicle production
Strong aftermarket demand
Rapid adoption of EVs and hybrid vehicles
Export opportunities due to global supply chain realignments
Within this context, ASK Automotive’s leadership in braking and aluminum lightweighting places it at the core of this structural growth story. With its 50% market share in 2W braking systems, it stands to benefit significantly from the 2W and EV upcycle.
3. Economic Conditions
The broader Indian economy provides a supportive backdrop:
GDP growth above 7% ensuring stable demand
Falling input inflation, aiding margin expansion
Government PLI schemes promoting domestic manufacturing
EV policy tailwinds, increasing OEM collaboration opportunities
Thus, macroeconomic conditions currently favor sustained growth in the auto ancillary sector.
4. Qualitative Analysis
Strengths:
Market leader with 50% share in the 2W braking system segment
Diversified product portfolio: braking, aluminum, safety cables, and EV components
Strong OEM relationships ensuring steady order flow
17 manufacturing facilities across India + 1 JV
Strategic partnerships with AISIN (Japan), LIOHO (Taiwan), and FRAS-LE (Brazil)
Focused R&D investments in EV and lightweight solutions
Weaknesses / Risks:
Heavy dependence on the two-wheeler segment (76% of OEM revenue)
High P/E valuation limits near-term upside
Raw material cost volatility could impact margins
Export contribution (5%) remains relatively small
5. Quantitative Analysis
Compounded Growth Ratios:
Sales CAGR (3Y): 21%
Profit CAGR (3Y): 44%
ROE (Last Year): 27%
Stock Price CAGR (1Y): 17%
ASK Automotive’s growth trajectory reflects consistent expansion in both topline and bottom-line metrics, alongside superior capital efficiency.
6. Past, Present & Future Growth Outlook
Past (FY19–FY21):
The company faced headwinds due to an industry slowdown and pandemic impact. Sales fell marginally but profitability remained intact, proving operational resilience.
Present (FY22–FY25):
Strong recovery phase driven by OEM revival, export traction, and margin expansion. FY25 saw record revenue of ₹3,630 Cr with 12% OPM and 27% ROE — its best performance yet.
Future (FY26–FY28):
ASK Automotive’s focus on EV-compatible lightweighting, thermal management systems, and global JVs positions it for 15–18% CAGR growth.
The upcoming Bengaluru plant (₹200 Cr capex) and 9.9 MW solar facility are expected to boost both capacity and sustainability credentials.
ASK Automotive represents a rare blend of technical strength, financial soundness, and industry leadership. With a clear growth trajectory, expanding institutional interest, and consistent operational excellence, it holds the potential to become one of India’s top-performing auto ancillary stocks in the coming decade.

Price action of Jubilant Agri and Consumer Products LimitedThe price action of Jubilant Agri and Consumer Products Limited ( NSE:JUBLCPL ) on a 4-hour timeframe.
The stock recently showed a significant bullish signal after a period of decline within a well-defined upward channel.
Key Signals
The price has rebounded from the lower end of the channel, forming support close to ₹2,080–₹2,100 levels.
The latest candle has crossed above the 200 EMA, a widely watched moving average for trend confirmation.
A bullish MACD divergence is indicated, suggesting a momentum shift and potential for price reversal.
Also (Bulish Continuation wedge is formed ) - A Bullish Continuation Wedge signals a brief pause within an ongoing uptrend. It forms between two downward-sloping, converging trendlines as sellers temporarily gain control. However, the pattern ultimately favors the bulls—when price breaks above the upper trendline, it confirms the resumption of the preceding upward trend.
Analysis
Trend: Bullish within channel; recent breakout suggests continuation
Key Support: ₹2,080
Immediate Resistance: ₹2,400–₹2,500 (mid-channel)
Indicators: 200 EMA breakout, MACD bullish divergence
Target: ₹3,000 or + (upper channel boundary)
This analysis suggests a potential swing trading opportunity, provided the bullish signals are confirmed in subsequent sessions. Always consider risk management and market conditions before entering trades.
PLEASE NOTE THAT:
This chart analysis is only for reference purpose.
This is not buying or selling recommendations.
I am not SEBI registered.
Please consult your financial advisor before taking any trade

BTCUSD RAINING BLO*D🩸 BTC slapped our sell-limit like it owed it money 💀 The setup looked clean — until the bulls said “Not today.” We’re running in drawdown, but structure still holds hope ⚔️
📉 Current View:
BTCUSD 1H — Price rejected around 115.9K–116.8K liquidity zone after a market structure shift (MSS) at 113.0K. Structure remains bearish unless daily closes above 116.8K.
📊 Key Levels:
🔴 Resistance/Sell Zone: 115.8K–116.8K (OB / liquidity)
⚫ Structure Break: 113.0K → below = continuation
🟢 Buy Re-entry/Demand Zones: 112.4K–111.7K | 109.8K–108.9K (golden pocket)
🧠 Trading Plan:
• Bearish bias holds while below 116.8K → Target 113.0K then 109.8K
• Bullish flip only if daily candle closes above 117K → Next target 119.5K–121.2K
📰 BTC Update:
ETF inflows slow mid-October; CPI data due this week could spark volatility. Derivatives funding rates mildly positive — short-term long bias possible, but liquidity still favors downside traps.
💬 Trader’s Humor: “Sell-limit triggered, stop-loss flirting, and patience getting margin-called — just another day in crypto.” 😂
#BTCUSD #BitcoinAnalysis #CryptoTraders #SmartMoneyConcepts #PriceAction #ForexCommunity #CryptoSetup #TradingLife #TraderHumor #BitcoinForecast #CryptoAnalysis #LiquidityHunt #PriceActionTrading #CryptoCommunity #BTCSetup #ForexAndCrypto #alphatechfinances

XAUUSD – Gold Trading Plan: Fresh Record Highs & Fibo Zone React📊 Market Context
Gold regained strong bullish momentum on Monday, surging to a new record high above 3,720 USD/oz. The Fed’s dovish outlook, signaling the possibility of two additional rate cuts this year, continues to support non-yielding assets like gold. At the same time, geopolitical risks remain a tailwind for safe-haven demand.
🔢 Technical Analysis (H2)
Immediate Resistance / SELL Zones:
3,818.769 – Key reaction zone where sellers may defend aggressively.
3,754.890 – Secondary SELL zone reaction area for short-term pullbacks.
Mid-Level Support / BUY Zone:
3,694.521 – First key area to watch for dips and potential buy reactions.
3,660.130 – Stronger support level if price pulls back deeper.
Major BUY Zone Reaction:
3,583.663 – Critical confluence of structure and Fibonacci support, a potential bounce zone if a major correction unfolds.
📈 Suggested Trading Scenarios
1️⃣ Bullish Continuation Setup
BUY: Look for pullbacks to 3,694–3,660 with bullish candlestick confirmation.
Targets: 3,754 → 3,818, leave partial position open if momentum breaks higher.
Stop Loss: Below 3,645 for safer positioning.
2️⃣ Countertrend SELL Setup
SELL: Enter short at 3,754–3,818 zones only with strong rejection signals.
Targets: 3,694 → 3,660, trail stops aggressively to lock profits.
3️⃣ Deep Correction Opportunity
BUY: If price flushes to 3,583–3,585, consider scaling into longs.
Targets: 3,660 → 3,754, aligning with the broader uptrend.
⚠ Key Trading Notes
Expect increased volatility with Fed guidance and ongoing geopolitical risks.
Use smaller position sizes near resistance zones and employ stop-loss discipline.
Avoid mid-range entries; focus on well-defined zones for optimal risk-to-reward setups.
💬 Community Discussion
📊 Will gold sustain its rally toward 3,818 or see a deep pullback before another leg higher? Share your charts and insights below so we can compare strategies!

DXY/GOLD RATIO ANALYSIS The DXY/Gold ratio has been in a persistent downtrend, now testing deep lows. Momentum shows early signs of stabilizing, with RSI near oversold and MACD flattening.
⚖️ A rebound here could mean relative strength shifting back toward the Dollar over Gold. Keep an eye on follow-through.

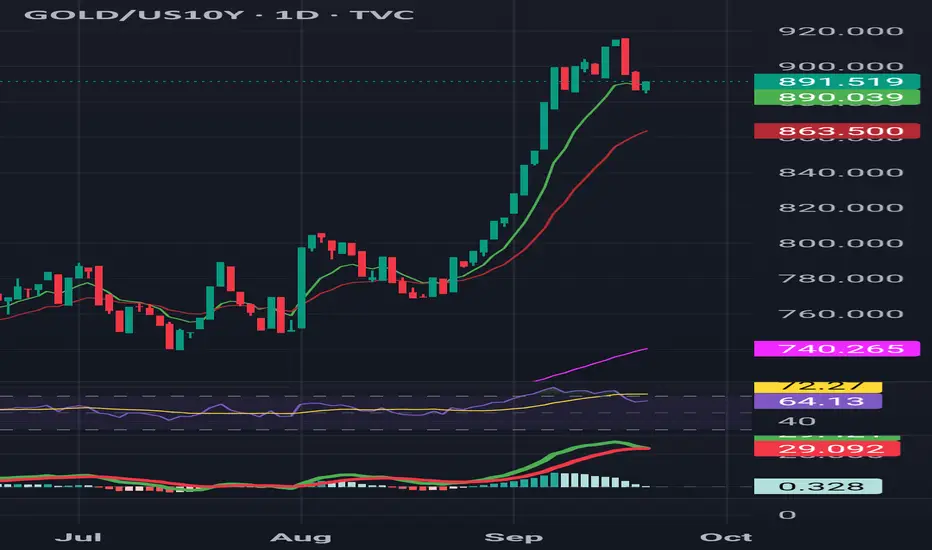
GOLD/US10Y RATIO ANALYSIS Gold vs. US 10Y yield ratio surged to extreme highs but is now showing weakening momentum. RSI has pulled back from overbought and MACD is cooling.
🔎 If this ratio rolls over, it may signal profit-taking in Gold as yields recover.
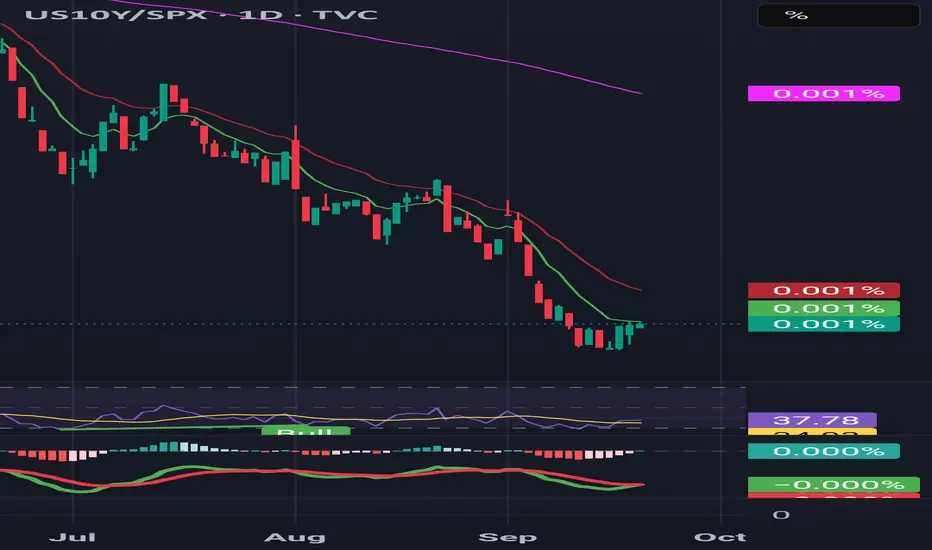
US10Y/SPX RATIO ANALYSIS The US10Y/SPX ratio has been crushed lower but is now trying to form a bottom. RSI is curling up from oversold, and MACD shows a potential bullish turn.
📌 Early signs that bonds may start regaining relative strength versus equities.
Volatility–Momentum–Trend (VMT) Model🔎 Intro / Overview
Three-indicator confirmation using Bollinger Bands (BB) , MACD , and RSI to align trend and price action.
BB often detects the move first (least lag), MACD follows the BB trend (mid reaction), and RSI confirms last (most lag).
This staged confirmation helps reduce false signals and keeps entries disciplined.
___________________________________________________________
📔 Concept
• Bollinger Bands (BB) → Early detector at volatility extremes.
– Buy : Price first moves outside the lower band , then a candle closes back above lower band → early bullish alert.
– Sell : Price first moves outside the upper band , then a candle closes back below upper band → early bearish alert.
• MACD → Momentum confirmer.
– Buy : MACD crossover above its signal line supports the bullish shift.
– Sell : MACD crossunder below its signal line supports the bearish shift.
• RSI → Final confirmation (filters traps).
– Buy : RSI crosses above its moving average, confirming bullish momentum.
– Sell : RSI crosses below its moving average, confirming bearish momentum.
✅ Only when BB + MACD + RSI all align in the same direction is the signal confirmed.
Notes:
- BB often reacts first (fastest, but prone to false starts).
- MACD provides mid-reaction confirmation.
- RSI lags but acts as the strongest filter against false trades.
Notes: Sometimes BB reacts immediately; MACD/RSI can prevent traps. At times BB+MACD demand a trade but RSI rejects (good filter); other times RSI demands but BB+MACD filter it.
___________________________________________________________
📌 How to Use
🔴 Sell Signal
1) BB: Price first extends outside upper band in an up-move, then a candle closes back under the upper band → BB sell signal.
2) MACD: Crossunder of MACD line below signal line.
3) RSI: RSI crosses below its moving average → final confirmation.
✅ All three aligned = Valid Sell.
🟢 Buy Signal
1) BB: Price first extends outside lower band in a down-move, then a candle closes back above the lower band → BB buy signal.
2) MACD: Crossover of MACD line above signal line.
3) RSI: RSI crosses above its moving average → final confirmation.
✅ All three aligned = Valid Buy.
___________________________________________________________
🎯 Trading Plan
• Entry → Only when all three confirm in the same direction.
• Stop Loss → - Stop-Loss → Near the structure swing that formed when BB first detected the signal (e.g., recent swing high for shorts / swing low for longs).
• Target → At least 1R ; scale/exit remainder using ATR, Fibonacci levels, or box trailing to ride trend.
___________________________________________________________
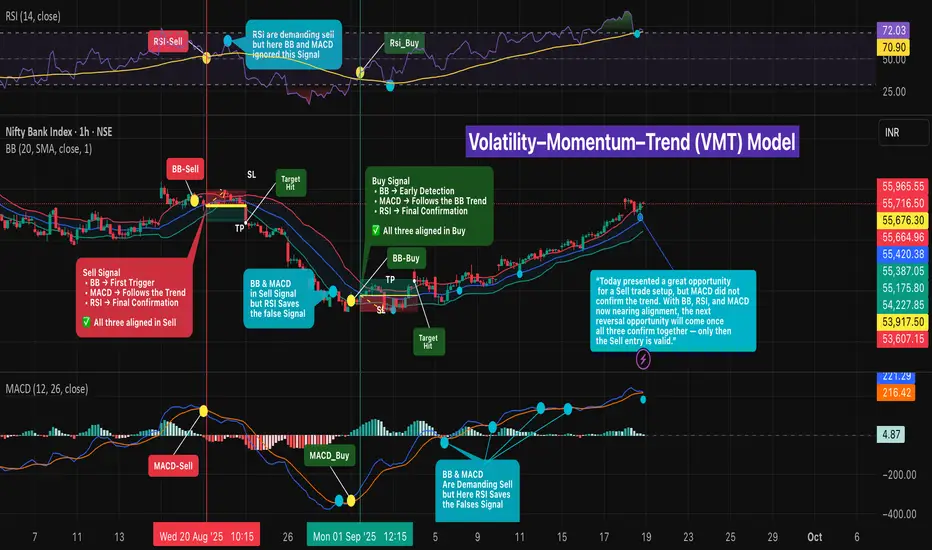
📊 Chart Explanation
Symbol/TF: BANKNIFTY · 1H
1) 20 Aug · 10:15 — SELL
• BB detected first, MACD mid-reaction (after ~2 candles), RSI confirmed last → Entry @ 55,676.30
• Target @ 55,387.05
• Stop-loss @ 55,965.55
• 🎯 Target hit on 22 Aug · 09:15 .
• Remaining lots can be trailed using ATR , Fibonacci levels , or Box Trailing to ride the extended trend
2) 29 Aug · 10:15 — FILTERED SELL
• BB and MACD demanded sell, but RSI did not confirm → No trade; RSI saved a false signal.
• 🦋 “The aqua dots represent false signals. At times, BB detects early entries but RSI and MACD do not confirm. Sometimes BB and MACD align, but RSI rejects the move. Other times BB and RSI confirm, yet MACD signals false. ✅ Only when all three align together is the signal valid.”
3) 01 Sep · 13:12 — BUY
• All three aligned long
• Entry @ 53,917.05
• Target @ 54,121.50
• Stop-loss @ 53,712.60
• 🎯 Target hit.
• Remaining lots can be trailed using ATR , Fibonacci levels , or Box Trailing to ride the extended trend
👉🏼 “A Sell setup looked promising today, but MACD did not confirm the trend ❌. With BB, RSI, and MACD now nearing alignment, the next reversal opportunity will be valid only when all three confirm together ✅.”
___________________________________________________________
👀 Observation
• BB provides the earliest cue; MACD validates momentum shift; RSI filters late-stage traps.
• Most reliable signals occur near key structure (support/resistance) with confluence.
• Not all alignments are equal—strength improves with decisive closes and supportive volume.
___________________________________________________________
❗ Why It Matters?
•A rule-based, three-step confirmation reduces noise and emotions.
•It clarifies when to enter , when to skip , and how to manage risk consistently across changing market conditions.
___________________________________________________________
🎯 Conclusion
BB → detect , MACD → follow , RSI → confirm .
When all three align, entries are clearer and risk is defined.
🔥 Patterns don’t predict. Rules protect. 🚀
___________________________________________________________
⚠️ Disclaimer
📘 For educational purposes only.
🙅 Not SEBI registered.
❌ Not a buy/sell recommendation.
🧠 Purely a learning resource.
📊 Not Financial Advice.
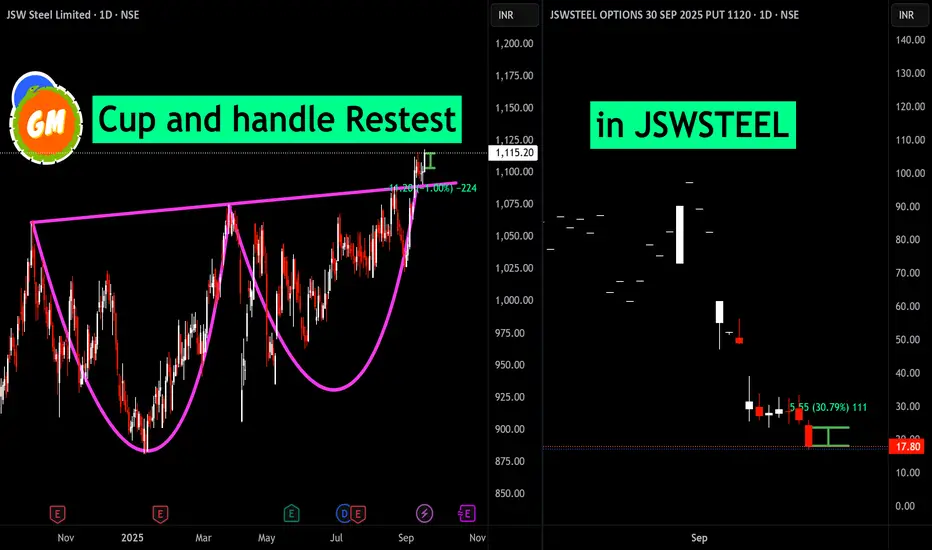
Cup and handle Restest in JSWSTEELJSW Steel shows a classic cup and handle retest breakout. Price retests the neckline near 1,115 INR, confirming bullish momentum. Meanwhile, the falling 1120 put option price suggests waning bearish sentiment. Consider long entries above support; avoid fresh puts unless price closes below breakout zone.
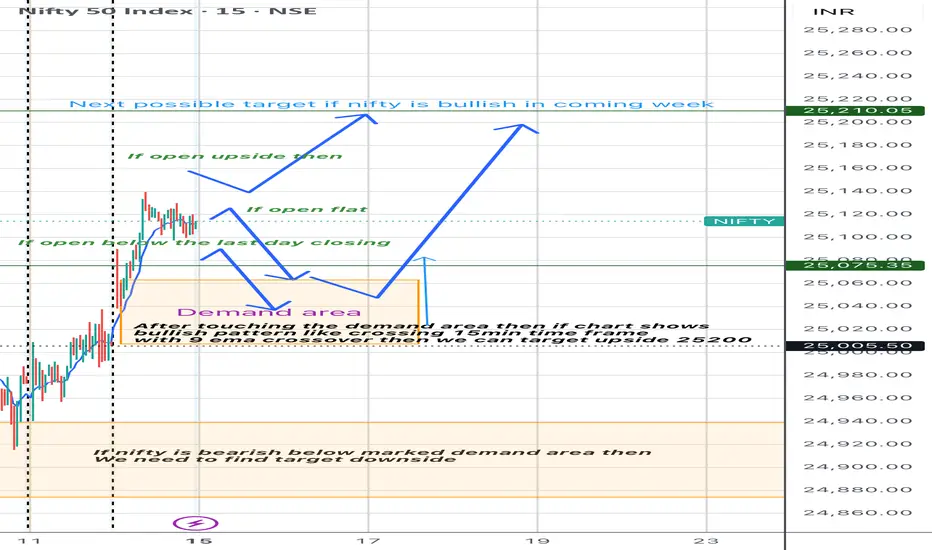
Nifty plan for 15sep2025Nifty next possible target is 25200 if nifty is bullish in the next week. If nifty comes to demand area again then i will look for bullish signs to enter in trade to target 25200.
Looking for 15min time frame 9EMA cross over closing candle.
USD/JPY(20250910)Today's AnalysisMarket News:
U.S. employment data was significantly revised downward, with the number of jobs for the 12 months ending in March revised down by 911,000.
Technical Analysis:
Today's Buy/Sell Levels:
147.08
Support and Resistance Levels:
148.32
147.85
147.55
146.60
146.30
145.84
Trading Strategy:
On a breakout above 147.55, consider a buy entry, with the first target at 147.85.
On a breakout below 147.08, consider a sell entry, with the first target at 146.60

SEBI Expedites IPO Approvals: A Deep Dive into India’s Capital SEBI Expedites IPO Approvals: A Deep Dive into India’s Capital Market Shift
1. Introduction
The Securities and Exchange Board of India (SEBI) has recently undertaken a significant step—fast-tracking Initial Public Offering (IPO) approvals. Traditionally, IPO approval in India has been a lengthy process, often stretching to six months. But SEBI’s new measures aim to cut this time nearly in half, potentially bringing it down to three months or less.
This shift comes at a time when India’s equity markets are booming, with record levels of fundraising expected in 2025. After raising around $20.5 billion through IPOs in 2024, analysts predict that 2025 could surpass this figure. According to reports, $8.2 billion has already been raised so far in 2025, with an additional $13 billion in IPOs already approved and nearly ₹18.7 billion pending approval.
2. Why SEBI is Expediting IPO Approvals
Several factors are driving SEBI to accelerate the IPO pipeline:
Surging Investor Appetite
Indian retail participation in stock markets has seen an explosion in recent years.
Over 11 crore Demat accounts are active as of 2025, compared to just 3.6 crore in 2019.
More retail investors mean more demand for IPOs, making faster approvals essential.
Global Capital Flows
India is seen as one of the fastest-growing large economies.
With global investors diversifying away from China, India is attracting billions in Foreign Portfolio Investments (FPIs).
A streamlined IPO process will help India capture this liquidity flow before it moves elsewhere.
Boosting Startup Ecosystem
Unicorns like PhysicsWallah, Urban Company, and WeWork India are preparing for listings.
Startups require quicker capital-raising routes to compete globally.
Regulatory Efficiency and AI Adoption
SEBI is now deploying AI-powered document screening tools to check IPO filings.
This reduces human delays and allows faster compliance checks.
Collaboration with merchant bankers and exchanges has also been strengthened.
Record Fundraising Target
SEBI expects India to break the $20B mark again in 2025, possibly setting an all-time record.
Expedited approvals are central to making this happen.
3. How the New Approval System Works
Traditionally, IPO approvals involved multiple manual steps:
Filing of Draft Red Herring Prospectus (DRHP).
SEBI reviews disclosures, company financials, risk factors, and governance.
Queries are raised with the company, leading to back-and-forth communication.
Final approval takes 4–6 months.
Now under the fast-track mechanism:
AI Pre-Screening: Automated checks scan filings for missing data, compliance issues, and inconsistencies.
Concurrent Review: Instead of sequential reviews, SEBI, merchant bankers, and exchanges review documents simultaneously.
Time-Bound Queries: Companies are given strict deadlines to respond to SEBI’s queries.
Standardization: Risk disclosure formats and governance checks are now standardized across sectors.
This is expected to cut approval timelines by 40–50%.
4. IPO Pipeline for 2025
Some big-ticket IPOs in the pipeline include:
PhysicsWallah (₹3,820 crore) – Edtech unicorn expanding into AI-driven education.
Urban Company – Already raised ₹854 crore from anchor investors; IPO opening soon.
LG Electronics India – Large consumer electronics brand targeting India’s growing tech-savvy population.
WeWork India – Despite global challenges, the Indian arm remains profitable and expansion-focused.
Credila Financial Services – Education loan subsidiary of HDFC, a high-demand financial segment.
The SME IPO market is equally hot with listings like Goel Construction debuting at a 15% premium and Prozeal Green Energy getting SEBI approval.
5. Benefits of Faster IPO Approvals
For Companies
Quicker access to capital for expansion.
Ability to capitalize on favorable market sentiment without delays.
Reduced costs of prolonged regulatory processes.
For Investors
More frequent and diverse IPO opportunities.
Increased transparency due to standardized disclosures.
Higher liquidity as more firms enter the public market.
For Indian Markets
Strengthened image of India as an investment hub.
Alignment with global best practices (US SEC and Hong Kong’s IPO process are faster).
Improved global competitiveness for Indian startups.
6. Risks and Challenges
Speed vs. Quality
Faster approvals must not compromise on due diligence.
Weak companies slipping through could hurt investor trust.
Market Saturation
Too many IPOs in a short span could lead to oversupply, reducing listing gains.
Retail Investor Overexposure
Retail investors may flock to IPOs without understanding fundamentals, increasing risk of losses.
Global Volatility
Geopolitical tensions, US interest rate decisions, or oil price shocks can derail IPO plans.
7. Global Context
Globally, IPO markets have been mixed:
US Markets: Tech IPOs are recovering but still face valuation pressure.
China: Tighter regulations have slowed down IPO fundraising.
Middle East: Saudi Arabia and UAE continue to see large IPOs in energy and infrastructure.
In this scenario, India is positioning itself as a global IPO leader, especially in the tech and services sector.
8. Investor Strategy for 2025 IPOs
For investors, the IPO rush creates both opportunities and challenges. Some strategies include:
Focus on Fundamentals
Look for companies with strong financials, governance, and growth potential.
Avoid IPOs driven purely by hype.
Anchor Investor Signals
Strong anchor participation (like Urban Company’s ₹854 Cr funding) signals institutional confidence.
Sector Plays
Edtech, Renewable Energy, Fintech, and Consumer Services are hot sectors.
Traditional sectors like construction and manufacturing are also showing resilience.
Listing Gains vs. Long-Term Holding
Some IPOs (like Goel Construction SME) deliver quick listing pops.
Larger IPOs (like PhysicsWallah, Urban Company) may be better for long-term growth.
9. Case Study: Urban Company IPO
Urban Company is a prime example of SEBI’s faster approval ecosystem.
Filed DRHP earlier in 2025.
Received SEBI approval within 12 weeks.
Raised ₹854 crore from anchors before IPO launch.
Price band set at the higher end, reflecting strong demand.
Market analysts project strong long-term growth given India’s rising demand for home services.
This showcases how SEBI’s new process benefits both issuers and investors.
10. Conclusion
SEBI’s decision to expedite IPO approvals is a game-changer for India’s financial markets. By cutting approval times, using AI-driven compliance, and standardizing processes, SEBI is creating a faster, more transparent, and investor-friendly IPO environment.
With major companies like PhysicsWallah, Urban Company, Neilsoft, and Prozeal entering the market, and regulatory support from SEBI, 2025 is poised to be a record-breaking year for IPO fundraising in India.
However, investors must balance enthusiasm with caution—choosing fundamentally strong IPOs, monitoring global market conditions, and avoiding blind bets driven by hype.
In essence, SEBI’s move reflects India’s ambition to emerge as a global capital-raising hub, connecting domestic growth stories with global capital at unprecedented speed and scale.
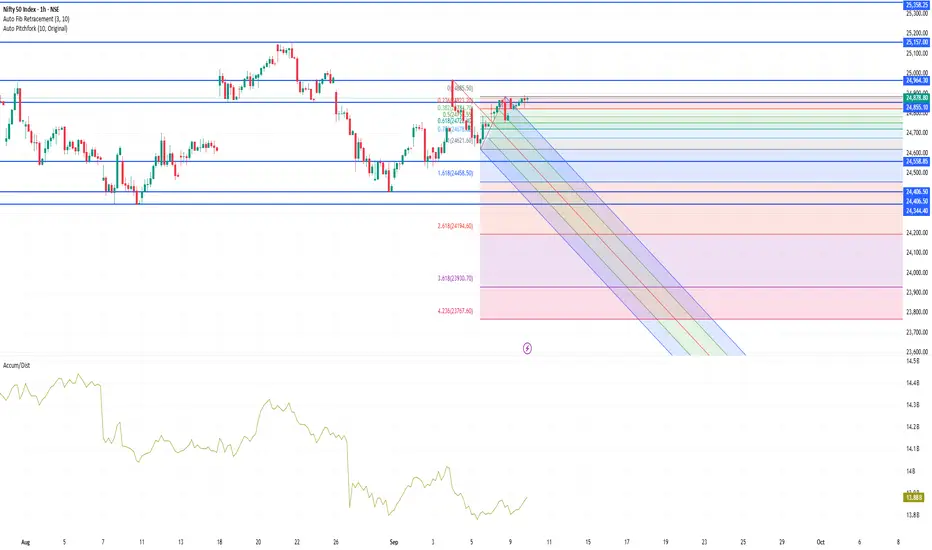
NIFTY50 index levelsKey Levels & Swing Trade Outlook (1-Hour Timeframe)
Resistance & Support (Broader Technical View)
Key Resistance Zones:
24,900–25,000 range (daily level)—a critical breakout area
Slightly higher potential if breakout occurs, toward 25,200+
Immediate Support Zones:
24,750–24,800 level
Broader range support at 24,620–24,700
More defensive base near 24,400 (longer-term)
Intraday Pivot Levels (Based on latest derived pivots)
From Moneycontrol, for the current trading session:
Classic Pivot R1: 24,855 | R2: 24,937 | R3: 24,989
Classic Pivot S1: 24,721 | S2: 24,669 | S3: 24,587
1-Hour Swing Trading Perspective
Although explicit 1-hour pivot data is not readily available, we can infer swing strategies using the broader technical context and typical indicators:
1-Hour Swing Fundamentals:
Use short-term moving averages (e.g., 20/50 EMA) to gauge trend direction. The index is trading above these on shorter timeframes, suggesting intraday bullish bias
Common indicators: RSI, Bollinger Bands, MACD, etc.