USD/JPY(202509008Today's AnalysisMarket News:
Non-farm payroll growth fell significantly short of expectations, with June's data revised downward to negative territory, marking the first contraction since 2020. The unemployment rate hit a nearly four-year high.
Technical Analysis:
Today's buy/sell levels:
147.57
Support and resistance levels:
149.28
148.64
148.23
146.92
146.51
145.87
Trading Strategy:
On a breakout above 148.23, consider a buy entry, with the first target price being 148.64.
On a breakout below 147.57, consider a sell entry, with the first target price being 146.92
Analysis

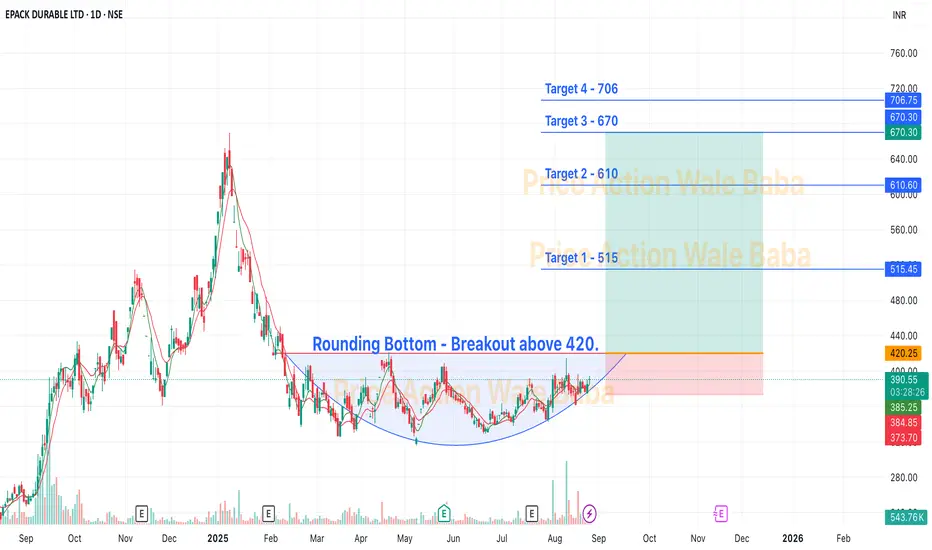
EPACK - Rounding BottomEPACK Durable Limited is an Original Design Manufacturer (ODM) of room air conditioners (RAC).
Fundamentals:
Market Cap: ₹ 3,747 Cr.
Promoter holding: 48.0 %
FII holding: 0.41 %
DII holding: 5.55 %
Public holding: 46.0 %
Debt: ₹ 416 Cr.
Debt 3Years back: ₹ 435 Cr.
Technical
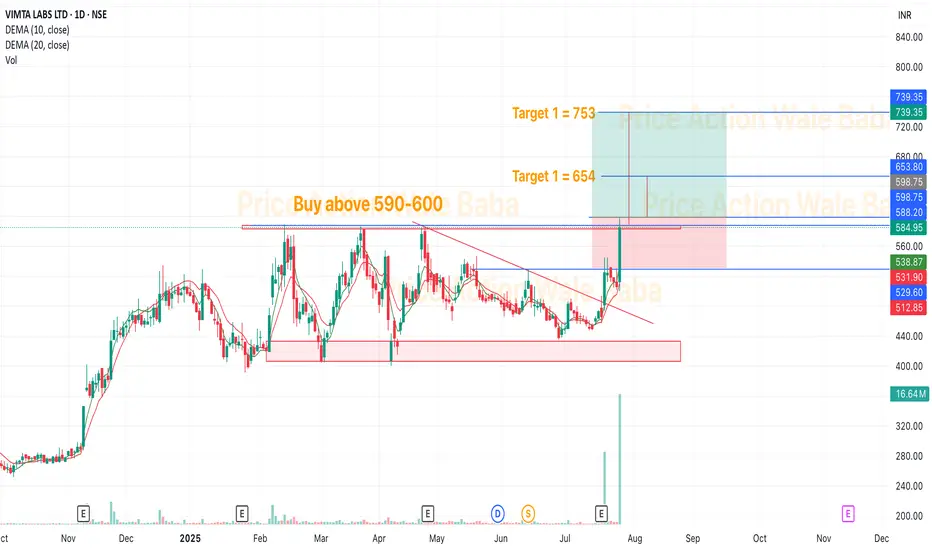
EPACK is making a rounding bottom pattern and very long consolidation. Above 420, we can see all targets marked on the chart. Good to buy and hold for the long time.
AUDJPY SELLSCurrent price action is bearish, with downside momentum confirming bearish order flow. Before considering shorts, I reviewed where price previously pushed higher and identified a key daily demand zone — an unmitigated wick that sparked the last major bullish move. This is important context: even though the 4H structure is bearish, bulls could still step in with enough volume to break supply.
I unfortunately missed the long entry at that demand zone, which would have been an ideal trap for a win–win scenario. For now, I’ve marked the nearest supply zone. Price just missed tapping into it, so I’ll patiently wait for when it taps. And then I’ll look for confirmation to enter shorts if the opportunity sets up.

BTC Update 15th august BTC recovers the inefficiency left on10th July, bouncing on the support level at 111K and returning on the last target, in the red zone.
From a technical point, this is could be forecast following the empty zone, as the wick on July 14th, which underlines a POL (point of liquidity), also supported by the heatmap liquidation.
Fundamentally, this new sphere of positivity and institutional adoption is helping BTC's rally to conclude this cycle with the utter targets.
The grow in the past cycle is been sustained- less hyped than the previous two. Both due to the high currency price of the Big coin, which makes difficult have a high percentage changes in short time, and due the consistent consolidation of the VIX index. At the same time, the entrance of new institutional players, as side general traders, investors and big whales, has stabilized a bit the market in terms of entrance and exit, make it more forecastable and stable.
New targets in the next post.
Thanks for reading,
M

GOLD SURGES AFTER CPI – TARGETING 337x BEFORE SELL-OFF? MMFLOW TECHNICAL OUTLOOK
📌 Market Overview
Following the CPI release, gold reacted with strong buying momentum (FOMO BUY), pushing prices swiftly from the 333x area up to 335x.
The main driver here is the BUY side taking advantage of remaining liquidity gaps above, aiming to break through the critical 3358 resistance – the first major barrier before reaching 337x, a key equilibrium zone that previously acted as a strong price-holding area for SELL orders.
Current structure indicates:
Short-term trend: Bullish, but approaching key distribution levels.
Liquidity Hunt: A decisive break above 3358 with strong volume could trigger a rapid move towards 337x, activating SELL volume from pending limit orders.
Macro context: No major news events today, with expected daily range ~35–40 points, increasing the chance of range-bound traps before a breakout.
🧐 Technical Outlook – MMFLOW View
Market Structure: Gold has formed a Higher Low around 333x and is now testing short-term resistance.
Key Levels & Liquidity Zones:
Liquidity BUY ZONE at 3338–3336 has reacted well, confirming BUYers are still defending this zone.
Supply Zone / CP Zone at 3375–3377 aligns with an H1 Order Block, holding a high concentration of pending SELL orders.
Volume Flow: Increasing volume as price approaches resistance suggests a potential “last push” before a reversal.
🎯 MMFLOW Trading Plan
🔹 BUY SCALP – Following the main trend
Entry: 3338 – 3336
SL: 3332
TP: 3342 – 3346 – 3350 – 3355 – 3360 – 3370 – 3380
🔹 SELL SCALP – At the distribution zone
Entry: 3375 – 3377
SL: 3382
TP: 3370 – 3365 – 3360 – 3355 – 3350 – 3340
📊 Key Technical Levels
Resistance: 3358 – 3365 – 3376
Support: 3342 – 3337 – 3330 – 3310
💡 MMFLOW Insight: With the current setup, the optimal strategy is to wait for a BUY opportunity near early support (334x) to ride the short-term bullish momentum, then watch for price reaction at 337x to catch potential SELL entries once top-side liquidity is swept.

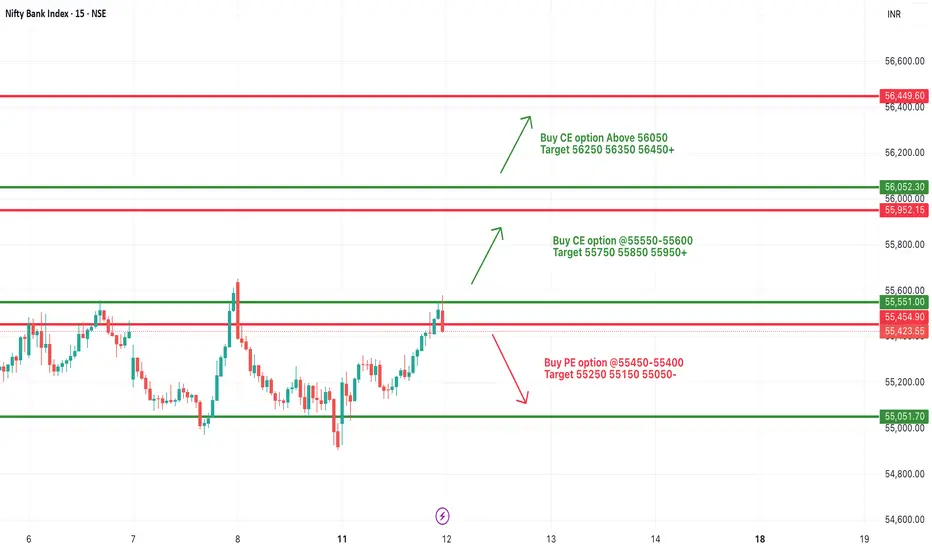
[INTRADAY] #BANKNIFTY PE & CE Levels(12/08/2025)Bank Nifty is likely to open with a gap-up, indicating strong bullish sentiment at the start. If the index sustains above 55,550–55,600, buying momentum may push it toward 55,750, 55,850, and 55,950+. Further strength can be expected if it breaks above 56,050, opening the path for 56,250, 56,350, and 56,450+.
On the downside, weakness could emerge if Bank Nifty falls below 55,450–55,400, which may lead to a decline toward 55,250, 55,150, and 55,050-. Price action around the 55,550 zone will be crucial in deciding intraday direction, so traders should wait for confirmation before entering trades and maintain strict stop-losses.
GBPJPY GJ is continuing its decline and is approaching a key demand zone around 194.800, which previously initiated bullish order flow.
I’ll definitely be monitoring this area closely for potential buy setups, as I’m anticipating a possible retracement. As always, confirmation will come from observing the 15-minute structure—once that aligns, I’ll adapt accordingly.

EURCAD BUYSPrice flipped the 4H structure on EURCAD, making a new higher high and shifting bullish. I’m watching for a retrace back down into the demand zone around 1.58500 that caused the flip.
Looking for buyers to come in here again and push the price higher. Will wait for some confirmation on the 15-minute chart before entering.

Swiggy Ltd. Reserch ReportBuy/Sell/Hold Recommendation:
Given Swiggy’s strong revenue growth but continued losses and negative cash flows, the stock currently represents a high-risk, high-reward opportunity. Unless you have a high risk appetite and a long-term horizon, a "Hold" stance is appropriate—wait for visible margin improvement and positive cash flows before considering aggressive buying. For conservative investors, it’s best to avoid new buys until profitability and sustainable cash generation are in sight. Only enter or add if Swiggy shows concrete signs of turning profitable and scaling successfully.
HOld (Overvalued)
Swiggy Investment Report: Independent Strategic & Financial Outlook
Introduction
Swiggy, a leading player in India’s food delivery and quick commerce industry, continues to pursue aggressive growth and operational dominance, shaping its own strategic path amid sector challenges.
Financial Metrics
In FY25, Swiggy posted revenue of ₹15,227Cr but remained loss-making with a net deficit of ₹3,117Cr and negative EBITDA margins, reflecting heavy investment in technology, logistics, and expansion—especially in its Instamart quick commerce division. Capital expenditures and higher working capital are keeping free cash flows negative (-₹2,693Cr in FY25), underscoring the company’s high-growth, cash-consuming phase.
Strategic Progress & DCF Valuation
Swiggy’s management aims for positive cash flows and margin turnaround, with plans to steadily improve profitability by scaling operations and increasing efficiency. A detailed DCF analysis, based on realistic growth and margin improvement assumptions (cost of equity 11.79%, terminal growth 10%), implies an intrinsic value of around ₹143 per share—indicating the current market cap still prices in optimism about future execution.
Key Takeaways
Swiggy operates in a capital-intensive, competitive market, facing margin pressure but also strong revenue momentum.
Ongoing board and policy reforms reflect the company’s drive for operational maturity.
Long-term success hinges on rapid margin improvement, successful turnaround of Instamart, and conversion of scale into sustainable profits.
Conclusion
Swiggy’s independent outlook shows promise with its robust platform and growth potential, but significant risks remain until losses are narrowed and cash flows turn consistently positive. For investors, Swiggy presents a high-risk, high-reward bet—success will be determined by its pace of execution and ability to transition from investment-driven growth to profitable leadership in India’s booming delivery market.

HCL Technologies Ltd.HCL Tech is a leading global IT services company, which is ranked amongst the top five Indian IT services companies in terms of revenues. Since its inception into the global landscape after its IPO in 1999, HCL Tech has focused on transformational outsourcing, and offers an integrated portfolio of services including software-led IT solutions, remote infrastructure management, engineering and R&D services and BPO. The company leverages its extensive global offshore infrastructure and network of offices in 46 countries to provide multi-service delivery in key industry verticals.
Market Cap: ₹ 4,04,363 Cr.
Promoter holding: 60.8 %
FII holding: 18.6 %
DII holding: 16.2 %
Public holding: 4.24 %
Debt: ₹ 6,276 Cr.
Debt 3Years back: ₹ 6,343 Cr.
Analysis: Current wave showing some selling pressure. This is weekly chart, so if you see there, 1310-1375 is crucial support zone. where 1300 is strong support. Once this is break then it will be give more fall till 930 where again new strong support will be formed.
930 is the possible reversal level. So, If it is reversed from 930, then targets will be 1180-1467-1590-2012-2685.
So, best opportunity will come in the HCL Tech soon.

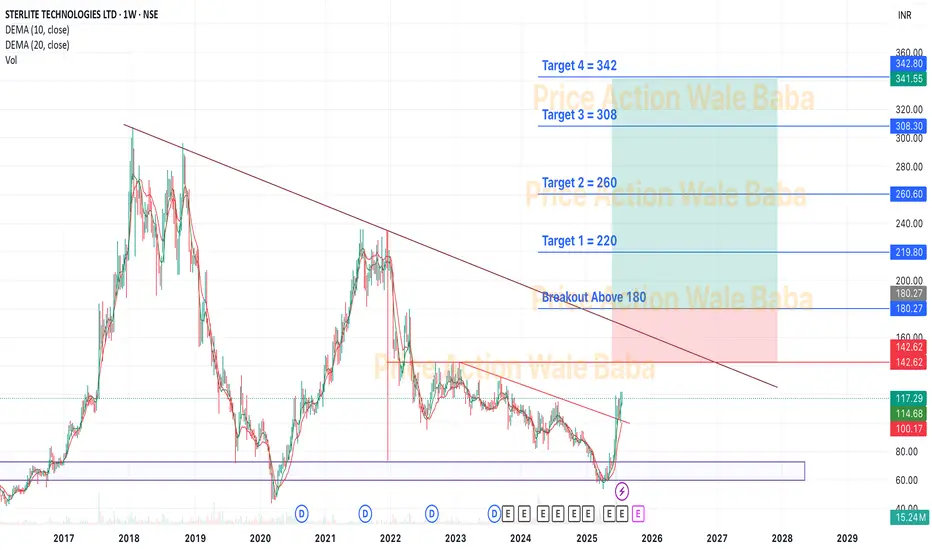
Sterlite Technologies Ltd - Near Breakout.Sterlite Technologies Limited was established in July 2001 after the demerger of the telecom division of Sterlite Industries Ltd (SIL). In July 2006, STL acquired the transmission line business of SIL to foray into the power transmission cables business. STL has grown over the years to become the largest Optical Fiber and Optical Fiber Cables manufacturer in the country. The company also has sizeable presence in the overseas markets with an established presence in the global optical fiber market.
The company’s global ex-China Optical Fiber Cables (OFC) market share was 8% in FY24 vs 12% in FY23. It is among the largest and lowest-cost producers of Optical Fibre and OFC in India because of extensive backward integration.
Order Book
As of Q4 FY24, the company's order book stood at Rs. ~10,200 Cr vs Rs. ~9,800 Cr in Q3 FY24.
Telcos: 59%
Citizen Networks: 22%
Enterprises: 19%.
Optical Connectivity portfolio in US
On 29 July 24, the company announce the expansion of its Optical Networking capability with the addition of its Optical Connectivity portfolio in the US market.
Market Cap: ₹ 5,723 Cr.
Promoter holding: 44.4 %
FII holding: 6.74 %
DII holding: 11.3 %
Public holding: 37.5 %
Debt: ₹ 1,926 Cr.
Debt 3 Years back: ₹ 3,475 Cr.
Note: Debt is decreasing
Vimta LabsVimta Labs
VLL is is in the business of contract research and testing in the fields of biologics, small molecules, agro -chemicals, food & beverages, electronics, clinical diagnostics, medical devices, home and personal care products, and environment testing
On July 12th 2024, company approved the scheme of amalgamation of its Wholly Owned Subsidiary company viz. Emtac Laboratories Pvt. Ltd. with the Holding Company
Market Cap: ₹ 2,603 Cr.
Promoter holding: 36.7 %
FII holding: 3.49 %
DII holding: 1.42 %
Public holding: 58.4 %
Debt: ₹ 8.52 Cr.
Debt 3Years back: ₹ 19.0 Cr.
Looks good to buy and hold for the given Targets.
"BTC’s Liquidity Grab: Is the Bull Ready to Charge?"🧠 Key Observations:
Break of Structure (BOS):
Multiple BOS levels confirm shifts in market structure from bullish to bearish and back.
The latest BOS near the support zone suggests a possible shift from bearish to bullish trend.
Support & Resistance Zones:
Resistance marked near the 120,241 level, which is also the target zone.
Support is clearly respected around the 114,898 level with price reacting strongly near the equal lows.
Liquidity Hunt:
Price swept the sell-side liquidity below the equal lows around 114,000 and bounced.
This indicates smart money might have collected liquidity before pushing the price higher.
Bearish FVG (Fair Value Gap):
A bearish imbalance around the 117,000 zone acted as a resistance during the previous rally.
Price might revisit this area for a mitigation before continuation to the upside.
Volume Profile (left side):
High volume nodes indicate significant trading interest in that region, confirming key price acceptance zones.
🎯 Expected Move:
If price sustains above the support zone and confirms bullish intent with higher highs, we may see a move towards the target at 119,637 – 120,241 zone.
📌 Conclusion:
Market has potentially formed a liquidity grab and BOS, signaling a bullish reversal. If this structure holds, BTCUSD could target the resistance area. However, if the price breaks below 114,000 again, it might invalidate this bullish setup.

Nifty upcoming moveWe have clean equal lows at 24462 and OB below that, weekly. Market should heavily expand towards that and take it first before giving any real upside move that would sustain. until then, any move upside is only correction phase.
your views are welcome.

BLUEJETBLUEJET looks strong.
It gave breakout, a small pullback will be good for the Entry as it is bit far away from 20ema, once it touches the 20ema then we may expect a good upside move.
Keep eyes on it.
✅ If you like my analysis, please follow me as a token of appreciation :)
in.tradingview.com/u/SatpalS/
📌 For learning and educational purposes only, not a recommendation. Please consult your financial advisor before investing.

BUY IDEA EURAUD Looking to buy EURAUD after pull back expecting bulls to continue pushing the market higher.

Sun Pharma: A Bullish OutlookHello Friends,
Welcome to RK_Chaarts,
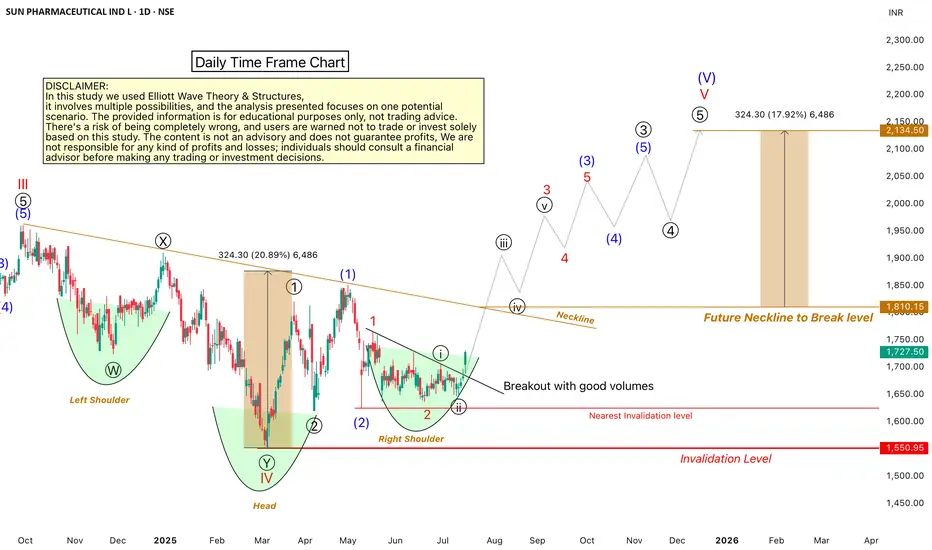
Let's analyze the Sun Pharmaceuticals chart using technical analysis, specifically the Elliott Wave Theory. According to this theory, the September 2024 top marked the end of Wave III cycle degree in red, and the March 2025 bottom marked the end of Wave IV cycle degree in red Now, Wave V of cycle degree in red has begun, which will move upward.
Within Wave V, we should have five sub-divisions of Primary degree in black, with Wave ((1)) & Wave ((2)) already completed. Wave ((3)) has started, with five further sub-divisions of one lower degree intermediate degree, We've marked these in blue, with Wave (1) and Wave (2) completed, and Wave (3) started. Within Wave (3), we have minor degree waves in red, with Wave 1 and Wave 2 completed, and Wave 3 breaking out today with good intensity of volumes.
We can see that the wave counts are super bullish, and so is the RSI, which is above 60. The MACD is also positive, and the price is above the 50-day and 200-day EMAs on the daily and weekly time frames. There's no moving average hurdle, which is another super bullish sign.
We can also see a higher high and higher low formation, which is a bullish sign according to Dow Theory. Additionally, an inverted head and shoulders pattern is forming, with the right shoulder being made. When it breaks out above the neckline, it will give us a target, which aligns with the Elliott Wave Target projection.
All these indicators – technical analysis, price action, and Elliott Wave – point to a bullish trend. However, there's an invalidation level at 1550; if the price falls below this level, our wave counts will be invalidated.
We're projecting targets between 2000-2200 based on Elliott Wave theory projections. Please note that this analysis is for educational purposes only and should not be considered as investment advice.
This post is shared purely for educational purpose & it’s Not a trading advice.
I am not Sebi registered analyst.
My studies are for educational purpose only.
Please Consult your financial advisor before trading or investing.
I am not responsible for any kinds of your profits and your losses.
Most investors treat trading as a hobby because they have a full-time job doing something else.
However, If you treat trading like a business, it will pay you like a business.
If you treat like a hobby, hobbies don't pay, they cost you...!
Hope this post is helpful to community
Thanks
RK💕
Disclaimer and Risk Warning.
The analysis and discussion provided on in.tradingview.com is intended for educational purposes only and should not be relied upon for trading decisions. RK_Chaarts is not an investment adviser and the information provided here should not be taken as professional investment advice. Before buying or selling any investments, securities, or precious metals, it is recommended that you conduct your own due diligence. RK_Chaarts does not share in your profits and will not take responsibility for any losses you may incur. So Please Consult your financial advisor before trading or investing.
Option TradingInvesting Approach by Institutions
✅ Investment Philosophy:
Long-term horizon
Focus on fundamentals (P/E, ROE, growth)
Sector rotation and macro trends
✅ Allocation Strategies:
Strategic Asset Allocation (SAA)
Tactical Asset Allocation (TAA)
Smart Beta and Factor Investing
Trading Strategies by Institutions
🔹 High-Frequency Trading (HFT)
Executes thousands of trades in milliseconds
Relies on arbitrage, price inefficiencies
🔹 Statistical Arbitrage
Mean-reversion strategies using historical patterns
🔹 Swing & Trend Trading
Use technical indicators like MACD, Moving Averages, RSI

Option Trading Part-1 What Is Institutional Option Trading?
Institutional Option Trading involves using derivatives (Options) for:
Hedging big equity portfolios
Speculating on volatility or price movement
Arbitrage opportunities
🔹 Key Techniques:
Volatility Arbitrage
Delta-Neutral Hedging
Covered Calls
Protective Puts
Iron Condors & Spreads
How Institutions Use Options Differently
✅ Retail Focus:
Naked calls/puts
Directional trades
Limited capital
✅ Institutional Focus:
Portfolio insurance
Complex multi-leg strategies
Implied Volatility arbitrage
Event-based hedging (like earnings or Fed news)

Option TradingInstitutional Trading – The Backbone of Markets
✅ Who Are Institutional Traders?
They are big market participants such as:
Pension Funds
Insurance Companies
Hedge Funds
Mutual Funds
Foreign Institutional Investors (FIIs)
✅ Why Are They Important?
Provide liquidity in markets
Trade with large volumes
Influence market trends

Institution Option Trading What Is Trading?
Trading refers to buying and selling financial instruments (stocks, options, futures) in financial markets for profit. It can be:
Retail Trading – Done by individual investors.
Institutional Trading – Conducted by large organizations like banks, mutual funds, hedge funds.
What Is Investing?
Investing involves allocating capital with the expectation of long-term wealth generation. It focuses on:
Value appreciation
Dividends or returns over time
Longer holding periods

TRADER PSYCHOLOGY - Overtrading The Silent Killer of ConsistencyTRADER PSYCHOLOGY | EPISODE 1: Overtrading – The Silent Killer of Consistency
In the dynamic world of forex trading, success doesn't come from doing more — it comes from doing right. Yet many traders, especially full-time traders in India, unknowingly fall into a common psychological trap that slowly erodes both their capital and confidence: Overtrading.
Let’s break it down — what overtrading is, why it happens, and most importantly, how to stop it before it burns through your progress.
🧠 What Is Overtrading in Forex?
Overtrading refers to excessive trading – opening too many positions without clear signals or justification based on your strategy. In most cases, it’s driven by emotion, not logic.
It usually shows up in two forms:
Trading out of boredom or the urge to “do something”
Trying to recover from previous losses (a.k.a. revenge trading)
Over time, this behavior becomes a habit — and like most bad habits in trading, it’s expensive.
⚠️ Signs You Might Be Overtrading
If you answer "yes" to any of these, it’s time to check your discipline:
Do you feel uncomfortable when you’re not in a trade?
Do you enter trades even when your system says “no trade”?
Do you keep switching charts hoping to “find a setup”?
After a losing trade, do you jump right back in to recover?
Have you lost more to fees/spread than actual price movement?
🧩 Why Indian Traders Often Fall Into Overtrading
🔹 The Action Bias
Traders often feel they must "do something" to be productive. In reality, sitting out is a strategy — especially when markets are flat or unclear.
🔹 Pressure to Perform Daily
Many traders in India try to generate consistent income from trading — and assume they must win every day. That pressure leads to forcing trades just to “hit targets.”
🔹 Overconfidence After a Winning Streak
Success leads to confidence — but too much confidence without structure leads to impulsive trading. One good day shouldn’t convince you that you’ve mastered the market.
🔥 Consequences of Overtrading
Overtrading doesn’t just hurt your account — it breaks your mindset.
Capital Depletion: Small losses + transaction costs = big drawdown over time
Mental Burnout: You feel drained, frustrated, and reactive
Lack of System Trust: You abandon good strategies because you never followed them properly
Emotional Instability: You start making decisions based on fear or revenge, not analysis
✅ How to Control Overtrading – Practical Steps
1. Limit the Number of Trades Per Day
Set a clear rule — e.g., “Maximum 3 trades per day.” This forces you to choose the best setups and ignore mediocre ones.
2. Keep a Simple Trading Journal
Write down:
Why you took the trade
Whether it matched your plan
Your emotional state
Reviewing this weekly will reveal patterns you never noticed in real time.
3. Block Out Non-Active Trading Hours
For Indian traders, this might mean avoiding low-volume periods like mid-Asia session. Focus on London or US overlap hours — when liquidity and volatility are high.
4. Understand: Not Trading Is Still Trading
Being flat (no position) is a strategic decision. Markets reward patience, not impatience.
🎯 Final Thoughts
Overtrading is not a technical issue — it’s a mindset issue.
When you feel the urge to “do something,” remind yourself: the best traders don’t trade all the time. They wait, they observe, and they only act when everything aligns.
"The market doesn’t pay you for activity — it pays you for accuracy."
If you want to grow consistently, you must master the art of waiting, filtering, and executing with purpose.
📌 Next in the Series:
TRADER PSYCHOLOGY | EPISODE 2: FOMO – How Fear of Missing Out Destroys Good Decisions
Follow this page to get notified when it drops!

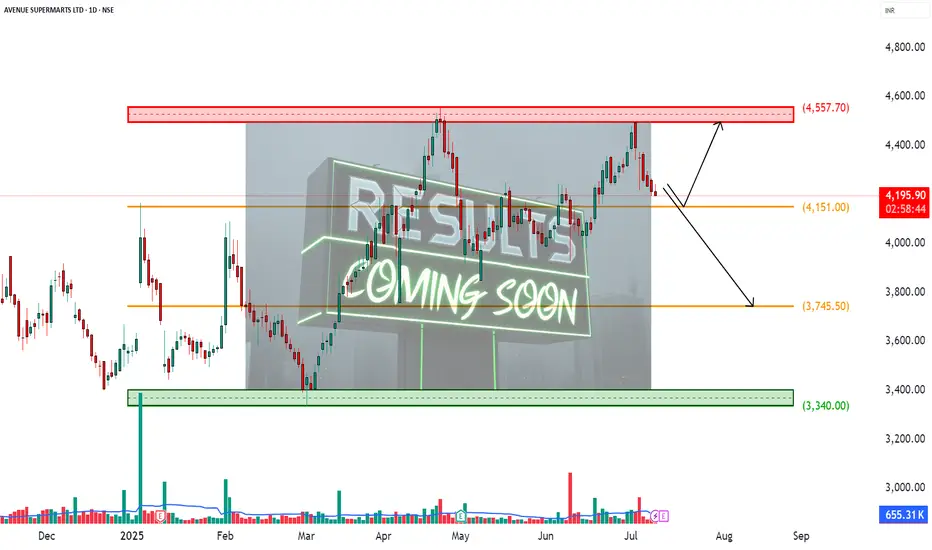
DMART – Earnings Incoming________________________________________________________________________________📈 DMART – Earnings Incoming: What’s the Right Time to Enter an Options Trade?
📆 Result Date: 11th July 2025 (Friday)
🕒 Strategy Style: Beginner + STWP HNI Learning Setup
🔍 For Educational Purposes Only
________________________________________________________________________________
🧠 What's the Setup?
DMART is announcing results on Friday, 11th July. We’re expecting a strong move — either up or down — because of mixed expectations around revenue and margins.
When you trade options around results, timing your entry is just as important as selecting the right strikes.
Let’s simplify it ⬇️ ________________________________________________________________________________✅ Option 1: Enter on 10th July (Thursday, After 2 PM)
💡 This is the ideal time for most traders.
🟢 Better option prices (not too inflated yet)
🟢 Good liquidity for smooth entry
🟢 Gives you overnight time to plan
🟢 You avoid the Friday panic crowd
🎯 STWP Suggested Strategy:
Buy 4300 CE + 4100 PE = ~₹180 total premium
This is called a Long Strangle – You win if the stock moves sharply up or down after results.
________________________________________________________________________________⚠️ Option 2: Enter on 11th July (Friday, Before 2 PM)
🔸 You might think, "Let me wait till Friday to get more clarity" — but there’s a catch:
❌ Option prices become expensive (high IV)
❌ Bid-ask spreads get wide (hard to enter)
❌ No time to react if results come intraday
❌ You’re stuck with weekend gap risk without prep
Unless you're experienced or scalping early, it’s not ideal for beginners.
________________________________________________________________________________🎯 Best Timing Rule – STWP Style:
📌 Enter on 10th July between 2:00 PM – 3:15 PM
Why?
You’ll lock in a clean setup with decent pricing and avoid stress.
📆 Exit Plan:
Hold through the weekend → Exit on Monday (14th July) if stock moves sharply 🔥
________________________________________________________________________________🧠 Alert:
Set alerts at:
₹4450 (Upside)
₹3950 (Downside)
If either hits on Monday, trail the winning side and exit the losing leg.
________________________________________________________________________________
📚 This is a learning example – not a trade recommendation.
Options carry risk. Please manage your capital and don’t trade blindly.
________________________________________________________________________________⚠️ Disclaimer (Please Read):
• This chart is shared for educational purposes only and is not investment advice.
• I am not a SEBI-registered advisor.
• The information provided here is based on personal market observation.
• No buy/sell recommendations are being made.
• Please do your own research or consult a registered financial advisor before making any trading decisions.
• Trading involves risk. Always use proper risk management.
________________________________________________________________________________