Option Trading Order Strategy Design
Execution Planning: Institutions cannot place large orders directly; they split trades into smaller lots to avoid price impact.
Techniques:
Algorithmic Trading (TWAP, VWAP, Iceberg orders)
Dark Pool Execution
Block Trades via Brokers
Trade Execution
Methods: Trades are routed through brokers, electronic communication networks (ECNs), or proprietary trading desks.
Real-Time Monitoring: Institutions monitor slippage, transaction costs, and market reaction continuously.
Analysis

Institutional Trading ProcessInstitutional Trading Process
1. Research and Strategy Development
Extensive quantitative research.
Backtesting models.
Scenario analysis using risk management software.
2. Trade Execution
Executing trades via dark pools to prevent market impact.
Using smart order routers for best price execution.
3. Risk Management
Continuous monitoring of positions.
Real-time adjustments using delta-hedging.
Portfolio diversification to spread risk.
4. Reporting and Compliance
Institutional trades are heavily regulated.
Detailed reporting to regulatory bodies like SEBI, SEC, etc.

Institutional Objectives in Options TradingInstitutional Objectives in Options Trading
1. Hedging
Institutions use options to protect large portfolios from adverse price movements.
Example: A fund holding a large stock position may buy put options as insurance.
2. Speculation
Institutions speculate on short-term market movements with directional bets using options.
Example: Buying call options in anticipation of a stock rally.
3. Arbitrage
Institutions exploit pricing inefficiencies in the options market for risk-free profit.
Example: Engaging in index arbitrage or dividend arbitrage strategies.
4. Income Generation
By selling options, institutions generate consistent premium income.
Example: Writing covered calls on long equity positions.
Tools and Techniques Used by Institutions
1. Advanced Option Strategies
Spreads: Vertical, horizontal, and diagonal spreads to limit risk.
Straddles and Strangles: To profit from high volatility.
Iron Condors and Butterflies: To capture premium in low volatility.
2. Option Greeks Management
Institutional traders rely heavily on managing option Greeks:
Delta: Sensitivity to price changes in the underlying asset.
Gamma: Rate of change of Delta.
Theta: Time decay impact.
Vega: Sensitivity to volatility changes.
Rho: Sensitivity to interest rate changes.
3. Technology and Algorithms
Institutions employ high-frequency trading (HFT) systems and algorithmic strategies to execute options trades efficiently and capitalize on minute price movements.
4. Implied Volatility and Open Interest Analysis
Institutions use implied volatility (IV) and open interest (OI) as key indicators to gauge market sentiment and structure complex multi-leg strategies accordingly.

Institution Option TradingInstitutional options trading refers to the large-scale use of options by financial institutions such as hedge funds, mutual funds, pension funds, banks, insurance companies, and proprietary trading firms. Unlike retail traders, institutional participants possess significant capital, advanced technology, and deep market insight, enabling them to deploy complex options strategies for hedging, speculation, and arbitrage purposes.
Institutional options trading plays a crucial role in shaping market dynamics. These large entities can influence volatility, liquidity, and price movements due to the size and frequency of their trades. Understanding how institutional traders operate provides retail traders with key insights to align their strategies effectively.
The Foundation of Options Trading
1. Understanding Options
Options are derivative contracts that give the buyer the right, but not the obligation, to buy or sell an underlying asset at a predetermined price (strike price) within a specified time frame.
Types of Options:
Call Options: Provide the right to buy.
Put Options: Provide the right to sell.
2. Key Option Terminologies
Premium: Price paid to buy the option.
Strike Price: Predetermined price to buy/sell the underlying asset.
Expiration Date: Last date the option can be exercised.
In-the-Money (ITM): Option with intrinsic value.
Out-of-the-Money (OTM): Option with no intrinsic value.

Technical ClassCandlestick patterns are essential tools in technical analysis that help traders predict potential market movements based on price action. Each candlestick represents four key data points: Open, High, Low, and Close prices within a specific time frame.
Types of Candlestick Patterns:
1. Single Candlestick Patterns
Doji: Market indecision (Open ≈ Close)
Hammer: Bullish reversal, long lower wick
Shooting Star: Bearish reversal, long upper wick
Spinning Top: Market indecision, small body
2. Double Candlestick Patterns
Bullish Engulfing: Strong bullish reversal
Bearish Engulfing: Strong bearish reversal
Tweezer Bottom/Top: Reversal signals
3. Triple Candlestick Patterns
Morning Star: Bullish reversal (3 candles)
Evening Star: Bearish reversal (3 candles)
Three White Soldiers: Strong bullish continuation
Three Black Crows: Strong bearish continuation
✅ Importance in Trading:
Predict Trend Reversals
Identify Continuation Patterns
Spot Market Sentiment Early

Institutional TradingDefinition:
Institutional trading refers to the buying and selling of financial securities by large organizations such as mutual funds, pension funds, insurance companies, hedge funds, and investment banks.
Key Characteristics:
High-volume transactions
Lower transaction costs due to bulk orders
Direct access to market liquidity
Use of advanced trading algorithms and platforms
Example Institutions:
BlackRock
Vanguard
Goldman Sachs
Who are Institutional Traders?
Types of Institutional Traders:
Mutual Funds: Trade for large-scale portfolio diversification.
Pension Funds: Focused on long-term stable returns.
Hedge Funds: Seek high returns with complex strategies.
Insurance Companies: Invest premiums for steady growth.
Investment Banks: Trade for proprietary gains and clients.
How They Operate:
Work with large research teams
Utilize proprietary trading algorithms
Influence market prices significantly

Institutional TradingDivergence Trading
Divergence trading is a technical strategy based on the observation that asset prices and their related indicators (like RSI, MACD, etc.) sometimes move in opposite directions.
Types of Divergence:
Regular Divergence: Predicts potential trend reversals.
Hidden Divergence: Suggests trend continuation.
Tools Used:
Relative Strength Index (RSI)
Moving Average Convergence Divergence (MACD)
Stochastic Oscillator
How Divergence Works:
If prices are making new highs but the indicator isn’t, it signals weakening momentum and a possible reversal.
If prices are making new lows but the indicator isn’t, it could indicate that selling pressure is fading.
Benefits:
Early identification of potential trend changes.
Effective in volatile markets.
Risks:
False signals can occur, leading to premature trade entries.

Master Institutional TradingBenefits of Option Trading:
Leverage with less capital.
Hedging against market risks.
Income generation through premium collection.
Risks of Option Trading:
Complex pricing structures.
Potential for significant losses if not properly managed.
Divergence Trading
Divergence trading is a technical strategy based on the observation that asset prices and their related indicators (like RSI, MACD, etc.) sometimes move in opposite directions.

Institutional Master class
Option Trading Explained
Options are financial derivatives that provide the right, but not the obligation, to buy or sell an underlying asset at a predetermined price within a specific period.
Types of Options:
Call Option: Right to buy the underlying asset.
Put Option: Right to sell the underlying asset.
Components of an Option Contract:
Strike Price: The agreed price to buy/sell.
Premium: Price paid to acquire the option.
Expiration Date: Date when the option contract ends.
Option Trading Strategies:
Buying Calls/Puts: Simple directional bets.
Covered Call: Holding stock while selling a call option to generate income.
Protective Put: Buying a put option to hedge a long stock position.
Spreads: Combining options to limit risk and cost.

Institutional Option TradingStock Market Participants:
Retail Investors: Individual traders and investors.
Institutional Investors: Mutual funds, hedge funds, pension funds, etc.
Market Makers: Provide liquidity by constantly quoting buy and sell prices.
Stock Trading Types:
Delivery Trading: Shares are purchased and held for longer periods.
Intraday Trading: Shares are bought and sold on the same day.
Importance of the Stock Market:
Helps in wealth creation.
Reflects economic health.
Provides investment and diversification opportunities.

Option Trading The stock market is a platform where shares of publicly listed companies are bought and sold. It serves two primary functions: providing companies with capital to grow and giving investors the opportunity to share in the profits of publicly traded companies.
Key Components:
Stocks: Ownership shares in a company.
Stock Exchanges: Platforms like the NYSE, NASDAQ, and BSE where trading occurs.
Indices: Benchmarks like the S&P 500 or Nifty 50 that track the performance of groups of stocks.

Institutional Trading Trading is the act of buying and selling financial instruments like stocks, bonds, currencies, commodities, and derivatives with the goal of making a profit. Traders operate in various markets, including stock markets, forex markets, commodity markets, and cryptocurrency markets. Trading is often contrasted with investing, which is generally focused on long-term wealth accumulation.
There are different types of traders:
Day Traders: Buy and sell securities within the same trading day.
Swing Traders: Hold positions from a few days to several weeks.
Scalp Traders: Execute dozens to hundreds of trades in a day, aiming for small profits.
Position Traders: Hold trades for months or even years, blending trading and investing.
Trading can be driven by technical analysis, fundamental analysis, or a combination of both. Traders use a wide array of tools and strategies to analyze price movements and market trends.

XAUUSD 03/07: GOLD IN THE DRIVER'S SEATXAUUSD 03/07: GOLD IN THE DRIVER'S SEAT – WILL IT BREAKOUT OR PULLBACK BEFORE KEY EVENTS?
Gold is on a solid upward trajectory, as expected from earlier predictions this week. After a negative ADP Non-Farm Payroll report yesterday, the USD weakened, providing the fuel for gold to soar. During the US session, gold surged from the 333x level to 336x.
🔑 Key Catalysts to Watch:
1. Political Factors:
Trump's announcement that the Republicans in the House have united to push through the "Super Bill" is a significant factor that could propel gold even further in the near future. The political climate is setting the stage for gold's potential rally.
2. Macro Overview:
Federal Reserve and Rate Cuts: The market is eyeing the Fed closely, with high expectations for two interest rate cuts this year. This could put continued pressure on the USD and further support gold. With a 90% chance of a rate cut by the end of Q3, the path is clear for gold to target new highs.
US Economic Data: Disappointing ADP data, reporting a loss of -33k jobs, continues to point to a weakening labor market, strengthening the case for gold as a safe-haven asset.
🌍 Market Conditions and Trade Setup:
The market remains on edge with these political and economic factors at play. The market will also be watching the Non-Farm Payrolls (NFP) data closely. With the ADP report showing poor results, the market could experience some turbulence ahead of the NFP release, and with a long weekend ahead due to the bank holiday, traders should approach this market with caution.
📉 Technical Outlook – The Road Ahead for Gold:
Gold has been trending upward and maintaining a bullish outlook. However, a minor pullback is expected.
Resistance: 3358 – 3365 – 3374 – 3380 – 3390
Support: 3343 – 3335 – 3325 – 3316 – 3304
📊 Trading Plan – Key Levels to Watch:
Buy Scalp:
Entry: 3335 – 3333
SL: 3329
TP: 3340 → 3345 → 3350 → 3360 → 3370
Buy Zone:
Entry: 3316 – 3314
SL: 3310
TP: 3320 → 3324 → 3328 → 3332 → 3336 → 3340 → 3350 → 3360
Sell Scalp:
Entry: 3374 – 3376
SL: 3380
TP: 3370 → 3366 → 3360 → 3355 → 3350
Sell Zone:
Entry: 3388 – 3390
SL: 3394
TP: 3384 → 3380 → 3376 → 3370 → 3366 → 3360
⚠️ Key Focus for Traders:
Upcoming Data: The NFP release will be crucial, as disappointing job numbers could drive gold even higher.
Market Volatility: With the long weekend ahead and market reactions to key news, be prepared for possible volatility.
Trade with Caution: Stick to your TP/SL strategy, manage risk, and only enter trades when clear setups appear.
📈 Conclusion:
Gold is showing strong potential for further gains, but traders should be prepared for some pullbacks as the market reacts to upcoming economic and political news. The trend remains bullish, but it’s crucial to remain cautious and follow the technical levels closely to optimize entry points. Stay alert for key developments in the USD, NFP, and Fed rate-cut expectations, and let the market guide you.

Strong Bullish Momentum or a Short-Term Setback?XAUUSD Analysis – 02/07: Strong Bullish Momentum or a Short-Term Setback?
Gold has made a strong recovery after a brief period of consolidation last month, and it continues to show signs of strong bullish momentum. The price has been fluctuating, yet the overall trend remains positive. Let’s dive into the technical setup for today’s trading session.
📊 Market Overview:
Recent Price Action: After confirming a bullish reversal on the H1 timeframe earlier this week, Gold has surged significantly. Yesterday, it reached 3358, completing wave 3 of an Elliott structure on the M30 chart, followed by a slight correction during the US and Asian sessions.
Short-Term Correction: Wave 4 is currently underway, and there are two potential outcomes for this correction:
It could find support at 3328-3330, leading to a continuation of the bullish trend.
Alternatively, it may dip further to the 330x range before resuming the uptrend.
🧭 Key Levels to Watch:
Support: 3328 – 3313 – 3304 – 3294
Resistance: 3344 – 3360 – 3368 – 3388
🧠 Trading Strategy for Today:
Buy Scenario:
Watch for a potential bounce around the 3328-3330 range. If this area holds, we can look for buying opportunities with a target towards 3358 and 3360.
If the price breaks through the 3340 level, consider entering long positions and setting targets around 3350-3360.
Sell Scenario:
Sell Near Resistance: A quick scalping opportunity could arise near the 3388-3390 resistance zone. Tight SL and reasonable TP at 3384-3380 are the targets to aim for.
For a longer-term Sell position, wait for a clearer breakdown below 3370 to target deeper levels like 3360.
🎯 Trading Plan for Today:
BUY ZONE:
Entry: 3306 – 3304
SL: 3300
TP: 3310 → 3315 → 3320 → 3325 → 3330 → 3340
SELL ZONE:
Entry: 3388 – 3390
SL: 3394
TP: 3384 → 3380 → 3376 → 3370 → 3365 → 3360 → 3350
⚡️ Key Considerations:
The US macroeconomic data release and potential volatility from ADP NonFarm Payrolls today could provide significant movement, so stay alert and monitor the data closely.
In Summary:
Bullish bias remains intact with strong buy opportunities around key support levels like 3328-3330.
For short-term traders, focus on quick scalping within the resistance zones, but don’t forget to follow the trend for the longer-term buy strategy.
💡 Stay cautious with your Stop Loss (SL) and Take Profit (TP) to manage risk effectively. Happy trading! 🌟

XAUUSD 01/07: GOLD'S RELIEF RALLY FROM A MONTHLY LOWXAUUSD 01/07: GOLD'S RELIEF RALLY FROM A MONTHLY LOW – USD WEAKENS, BUT CLEAR MOMENTUM IS STILL MISSING
🌍 Market Overview – USD Weakness & Gold's Rebound Potential
After a significant drop to a one-month low, Gold is beginning to recover slightly, partly due to a weaker USD, improving market sentiment. However, the rally remains cautious and still lacks a strong momentum to push gold decisively higher.
💵 USD Weakness: Can Gold Continue to Rebound?
Recent US economic data has shown a slight decline in consumer spending, which has led to speculations that the Federal Reserve may take a more dovish stance on interest rates in the near future. This has weakened the USD, providing room for Gold to rebound slightly.
That said, there hasn't been a significant catalyst to push Gold into a strong breakout yet.
📉 The Fed is Still the Key Player
The market is closely watching the Fed's next moves. However, there’s a divide on whether interest rates will be cut or maintained. The recent US data isn’t weak enough to warrant a policy change from the Fed, but it’s also not strong enough for the Fed to keep its hawkish stance intact.
This leaves Gold in a limbo, with no clear direction in the near term. Gold is caught between weak expectations of further rate cuts and the ongoing strength of the USD.
🧠 Analysis for Traders:
Gold is responding lightly to macroeconomic factors but hasn’t established a strong trend. This is a period prone to market noise—Gold may jump up and down on news, but the momentum required to establish a consistent trend is lacking.
Traders should monitor USD movements and US labor data closely this week, especially the NFP report, as this could provide more clarity for Gold’s future direction.
✍️ Conclusion:
Gold is recovering from its lows, but it remains uncertain.
The Buy side hopes for rate cuts by the Fed.
The Sell side is betting on USD strength.
As for us traders, let’s stay patient, observe closely, and be ready for the next move. The big wave may still be coming, but smaller price actions right now could give us clues for the upcoming trend.
🔶 Key Levels & Strategy:
Current Support Zone: Gold is holding above the critical psychological support levels of 3300-3304. If the upward momentum continues, a move towards 335x-337x is highly possible in the near term.
Liquidity Gap: Currently, there’s a liquidity gap at the higher levels. The goal is for Gold to rise further to fill this gap before any deeper retracement occurs.
📈 Trading Plan:
BUY ZONE: 3303 – 3301
‼️ SL: 3297
✔️ TP: 3306 → 3310 → 3315 → 3320 → 3325 → 3330 → ???
SELL ZONE: 3358 – 3360
‼️ SL: 3364
✔️ TP: 3354 → 3350 → 3345 → 3340 → 3320
⚡ Final Thoughts:
As the market awaits further data, keep an eye on these key support and resistance levels for your trading setups.
The overall trend is still upward, but short-term volatility is expected. Make sure to follow your risk management strategies.

Institutional Option Trading Part -xTrading Techniques
Block Trading: Large, privately negotiated trades.
High-Frequency Trading (HFT): Using algorithms for rapid-fire trades.
Algorithmic Trading: Automated trading based on predefined criteria.
Technology in Institutional Trading
Low Latency Networks: For speed advantage.
Advanced Algorithms: For market making, arbitrage, and execution.
Data Analytics: Real-time analysis to inform trading decisions.
Market Impact and Regulations
Institutional traders can move markets, prompting regulatory oversight.
Regulatory Bodies:
SEC (U.S.): Securities and Exchange Commission.
FINRA (U.S.): Financial Industry Regulatory Authority.
SEBI (India): Securities and Exchange Board of India.
Key Regulations:
Reporting Requirements: Large trades must be reported.
Fair Trading Practices: Prevent market manipulation.
Risk Controls: Institutions must manage trading risks appropriately.

Institutional TradingInstitutional Investment Process
Setting Objectives: Determining risk tolerance, return targets, and time horizons.
Asset Allocation: Dividing the portfolio among different asset classes.
Security Selection: Choosing individual investments.
Portfolio Monitoring: Continuously reviewing performance and risk.
Institutional Trading
Institutional trading refers to the buying and selling of securities in large volumes by institutions.
Types of Institutional Traders
Proprietary Traders: Trade with the institution's own money.
Agency Traders: Execute trades on behalf of clients.
Program Traders: Use algorithms to trade baskets of stocks.
Trading Venues
Exchanges: NYSE, NASDAQ, etc.
Dark Pools: Private exchanges for large orders.
Over-the-Counter (OTC): Direct trading without an exchange.

Institutional Option Trading Institutional Option Trading
Institutional option trading involves using options as part of sophisticated strategies to hedge risk, enhance returns, or speculate.
Objectives of Institutional Option Trading
Hedging: Protecting large portfolios against market downturns.
Income Generation: Selling options to collect premiums.
Speculation: Taking directional bets with options.
Arbitrage: Exploiting price inefficiencies across markets.
Common Institutional Option Strategies
Covered Call Writing: Selling call options against stock holdings to generate income.
Protective Puts: Buying puts to insure portfolios against downside risk.
Spreads (Vertical, Horizontal, Diagonal): Limiting risk while aiming for a defined profit range.
Straddles and Strangles: Betting on volatility, regardless of market direction.
Iron Condors: Selling out-of-the-money calls and puts to profit from low volatility.

Institutional Option Trading, Investing, and TradingInstitutional trading and investing significantly differ from retail activities. Institutions trade in large volumes, use complex strategies, and have access to exclusive information and tools. This guide will provide a comprehensive overview of institutional option trading, investing, and general trading practices, detailing their methodologies, tools, and market impacts.
Understanding Institutional Investors
Institutional investors include mutual funds, hedge funds, pension funds, insurance companies, and large banks. These entities manage vast sums of money, often on behalf of others, and possess substantial market influence.
Key Characteristics:
Large Capital Base: Institutions trade in millions or billions.
Market Influence: Their trades can impact prices significantly.
Professional Resources: Access to cutting-edge research, proprietary algorithms, and high-speed trading platforms.

Gold at Crucial 325x Support – What's Next for the Yellow Metal?XAUUSD D1 Forecast: Gold at Crucial 325x Support – What's Next for the Yellow Metal?
Namaste, fellow traders!
Today, let's zoom out and look at the bigger picture for Gold (XAUUSD) on the Daily (D1) timeframe. Our analysis indicates that Gold has hit a very strong, hard support level around the 325x region. This is a pivotal point that could dictate Gold's medium to long-term direction!
🌍 Macroeconomic Context: The Forces at Play for Gold
While we've seen some USD weakness due to speculations surrounding the Fed (like the rumors about replacing Powell) and expectations of rate cuts, these factors haven't completely prevented Gold's recent decline on the daily chart. Also, the sustained ceasefire between Israel and Iran is reducing Gold's safe-haven appeal.
However, the current price action at the robust 325x support level is a significant technical signal. The influence of upcoming US macroeconomic data (especially the PCE Index on Friday) and speeches from FOMC members will be crucial in confirming or negating Gold's next moves. If positive news for Gold aligns with this support holding, it could act as a strong catalyst.
📊 XAUUSD Technical Analysis (D1): Predicting Gold's Next Move
Based on the fact that Gold has encountered strong support at 325x, we can anticipate the following scenarios:
Bounce from 325x (Potential Upside Phase):
If the 325x area (which reinforces the 3264.400 support from image_e9d325.png) holds firm, we expect a strong reaction and an upward move for Gold.
The initial target for this bounce would be the 332x region, which aligns with resistance levels 3313.737 - 3330.483 from our previous analysis. On a broader timeframe (as shown in image_83845c.png), this corresponds to the resistance zone around 3326.022. This 332x area could represent a continuation pattern, meaning it might be a corrective rise before the resumption of the larger trend.
Resumption of Downtrend (After Reaching 332x):
Once Gold reaches and tests the 332x zone (3313.737 - 3330.483 / 3326.022) and shows bearish confirmation signals (e.g., a strong bearish engulfing candle, a pin bar, or a clear top formation), we anticipate a resumption of the downward movement.
The next major target for this fall would be the 317x area, which correlates well with the strong support at 3173.052 on the larger timeframe (as depicted in image_83845c.png).
🎯 XAUUSD D1 Trading Plan: Your Long-Term Strategy Ahead!
Considering the current D1 analysis, here's our actionable plan:
1. BUY PHASE (Bounce from Support):
Entry: Observe price reaction in the 325x - 326x zone (especially 3264.400). Only buy if there are clear bullish confirmations (e.g., a confirmed bullish pattern on the daily or 4-hour candle, a strong bounce from the zone with volume).
SL: Just below the 325x support zone (e.g., 3245-3240, depending on confirmation).
TP: 3280 - 3290 - 3300 - 3313.737 - 3326.022 (key 332x zone). This will be our primary target for the bounce.
2. SELL PHASE (Downtrend Resumption):
Entry: After the price reaches the 332x zone (3313.737 - 3330.483 / 3326.022) and shows bearish confirmation signals (e.g., strong bearish engulfing, pin bar, or top formation).
SL: Slightly above the 332x zone (e.g., 3335-3340).
TP: 3300 - 3290 - 3280 - 3270 - 3260 - 3250 - 3200 - 3173.052 (final 317x target).

ISLAMIC NEW YEAR OR RATHYATRA PICKTechnical View
Stock is clearly formed Cup&Handle pattern. Privious major SR Line break. Pattern made near major SR line. complete reversal formation.
RESPONIND
CMP 219
TARGET 250/275/300+++
BUY ON DIPS NEAR 200-204
SL 190( DAILY CLOSING BASIS)
Fundamental View
ROE and ROE BOTH ARE GOOD. Quaterly and Yearly boh Revenue and PAT are Highest Ever. positive cashflow..
I Am Not SEBI Registered Research Analyst. It Is Giving Only Educational Purpose. Buying in RESPONIND After Discussing With Your Financial Advisor.

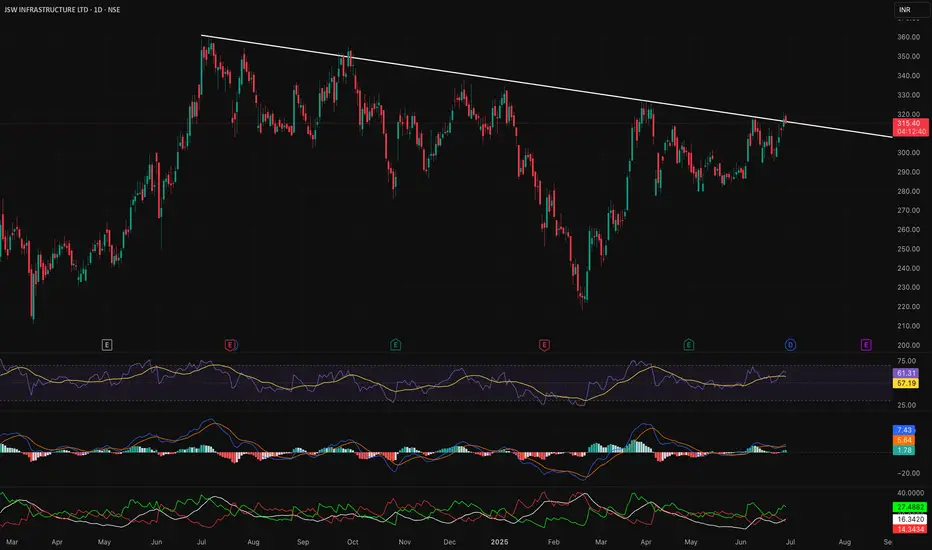
JSW Infra - MULTIPLE PATTERN BREAKOUTJSW Infra Fundamentally is going strong business !!
Y-on-Y strong growth and super Margins.
Fii is slowly increasing Stake as well!!
Indicators are supporting in a strong way as well!
Buy @ 315
SL 286
Target - 360 ++
A good bet for short Term !!
XAUUSD: Gold's Golden Glow Fades Below $3350 XAUUSD: Gold's Golden Glow Fades Below $3350 – Navigating Key Levels Amidst USD Weakness!
Let's dive into the fascinating world of Gold (XAUUSD) today. The yellow metal is showing subtle positive movement, primarily influenced by a weaker US Dollar, but a convincing bullish breakout above the $3350 mark remains elusive.
🌍 Macroeconomic Snapshot: USD's Woes & Gold's Mild Support
Gold has seen a slight positive bias for the second consecutive day, yet it's struggling to find significant follow-through, staying below the $3350 level in early European trading.
USD Under Pressure: Reports indicating that US President Donald Trump is considering replacing Fed Governor Jerome Powell have sparked concerns regarding the future independence of the US central bank.
Cautious Outlook: This mixed bag of news calls for caution before confirming a definitive bottom for Gold or positioning for a substantial recovery from levels below $3300 (or Tuesday's two-week low). Traders are currently focused on upcoming US macroeconomic data and speeches from FOMC members, which could influence XAU/USD ahead of Friday's crucial US Personal Consumption Expenditures (PCE) Price Index release.
📊 XAUUSD Technical Analysis & Intraday Trading Plan:
Current Trend: Gold has recently experienced a sharp decline and is now in a consolidation phase, trading around the $329X mark. Price is currently below shorter-term moving averages, indicating lingering bearish pressure or an accumulation phase.
Key Levels Identified:
Strong Support Zones (Potential BUY Areas): Levels around 3294.414, 3276.122, and particularly 3264.400 are crucial demand areas.
Key Resistance Zones (Potential SELL Areas): Levels at 3313.737, 3321.466, 3330.483, and 3341.947 are identified as significant supply zones.
🎯 XAUUSD Trading Plan (Based on your specified levels):
BUY ZONE (Strong Support - Long-Term Bias):
Entry: 3266 - 3264
SL: 3270
TP: 3280 - 3284 - 3290 - 3295 - 3300 - 3305 - 3310 - 3320
BUY SCALP (Quick Buy at Intermediate Support):
Entry: 3284 - 3282
SL: 3278
TP: 3288 - 3292 - 3296 - 3300 - 3305 - 3310 - 3320 - 3330
SELL ZONE (Key Resistance):
Entry: 3331 - 3333
SL: 3337
TP: 3326 - 3320 - 3316 - 3310 - 3305 - 3300
SELL SCALP (Quick Sell at Near Resistance):
Entry: 3313 - 3315
SL: 3320
TP: 3310 - 3305 - 3300 - 3295 - 3290 - 3280
⚠️ Key Factors to Monitor Closely:
US Macro Data: The upcoming US Personal Consumption Expenditures (PCE) Price Index on Friday is critical.
FOMC Member Speeches: Any comments on monetary policy or inflation outlook will directly impact USD and Gold.
Geopolitical Stability: Developments regarding the Israel-Iran ceasefire can influence safe-haven demand.
