Database Trading Introduction to Database Option Trading
Database Option Trading is an advanced strategy where traders use massive historical and real-time market data stored in structured databases to identify profitable option trades. Unlike conventional trading, this approach focuses on data-driven decision-making—leveraging algorithms, statistics, and pattern recognition rather than pure technical/fundamental analysis.
2. The Role of Data in Option Trading
Types of Data Used:
Option Chain Data: Strike prices, premiums, LTP, OI, IV, volume.
Historical Data: Past price action, volatility, Greeks, PCR.
Sentiment Data: FII/DII positions, news sentiment.
Real-Time Market Feeds: Tick-by-tick updates.
Macroeconomic Data: Interest rates, inflation, events.
Analysis

XAUUSD – Will Gold Break Free from the Downtrend?XAUUSD – Goldman Sachs Issues a Storm Warning: Will Gold Break Free from the Downtrend?
As gold continues to trade in a narrow range for the sixth week, one major catalyst could be on the horizon — Goldman Sachs has issued a bold warning about the US debt crisis. Indian traders, this may be the signal we’ve been waiting for…
🌐 MACRO OUTLOOK – US DEBT SET TO BREAK WWII RECORDS
US public debt is approaching historic highs, with interest payments projected to exceed $1 trillion in 2025 — surpassing even defense and healthcare spending.
Goldman warns that if urgent action isn’t taken, the US may face aggressive fiscal tightening, which could shrink GDP without lowering the debt-to-GDP ratio.
Root causes: overspending, rising interest rates, and deep political division.
📌 For Indian investors, such instability in the US economy tends to weaken the USD and increase demand for gold, which has always been a trusted asset in Indian households and institutional portfolios alike.
📉 TECHNICAL OUTLOOK (Updated – M30/H1)
Gold remains within a strong descending channel, and price action is currently showing signs of a bearish continuation setup.
The zone at 3,338.422 is acting as a mid-pivot. A pullback to the upper trendline (around 3,368.048) is expected before the next leg lower.
EMA ribbons are stacked downward, confirming short-term bearish momentum.
If the bounce toward 3,368 fails to break out, we expect price to revisit the FVG zone near 3,325.783, and possibly extend toward 3,309.256.
✅ TRADING PLAN (Unchanged Zones)
🟢 BUY ZONE: 3310 – 3308
SL: 3303
TP: 3314 → 3318 → 3322 → 3326 → 3330 → 3340 → 3350 → 3360 → ???
🟢 BUY SCALP: 3325 – 3323
SL: 3318
TP: 3330 → 3334 → 3338 → 3342 → 3346 → 3350 → 3360 → 3370 → ???
🔴 SELL ZONE: 3418 – 3420
SL: 3424
TP: 3414 → 3410 → 3405 → 3400 → 3396 → 3390 → 3385 → 3380
🔻 SELL SCALP: 3396 – 3398
SL: 3403
TP: 3392 → 3388 → 3384 → 3380 → 3375 → 3370
💬 FINAL THOUGHTS FOR INDIAN TRADERS
As we close the trading week, market liquidity may spike suddenly after Thursday’s US bank holiday. This could trigger a decisive move — either a breakout or a trap.
✅ Stick to your SL/TP, avoid emotional trading, and let the market confirm the direction.
Gold remains structurally bearish, but any shift in global sentiment — especially driven by US debt concerns — could flip the script fast.
Watch. Plan. Execute. Let the market come to you.

Learn Institution Trading Part -6Introduction to Institutional Option Trading
Institutional option trading refers to the sophisticated strategies used by hedge funds, mutual funds, insurance companies, proprietary trading firms, and foreign institutional investors (FIIs) to manage portfolios, hedge risks, and generate consistent alpha from the derivatives market. Unlike retail traders, institutions operate with large capital, access to advanced technology, and deep market insights, allowing them to structure complex trades.
2. Why Institutions Trade Options
Institutions don’t usually trade options for quick profits. Their trades are designed to meet broader objectives:
Hedging Equity Portfolios
Volatility Trading
Generating Yield on Holdings
Market Making and Arbitrage
Directional or Non-directional Speculation
3. Core Institutional Option Strategies
Let’s explore the most popular strategies that institutions use with real-world logic behind them.
A. Covered Call (Buy-Write)
Use: Income generation from long-term stock holdings
Structure: Buy stock + Sell Call Option (OTM or ATM)
Institutional Use Case:
A mutual fund holding Reliance shares might sell monthly call options against its holdings to generate monthly income (premium), enhancing total returns.

Option Trading How Institutions Operate:
Use Option Greeks (Delta, Gamma, Theta, Vega) for precise positioning
Follow OI (Open Interest) data for liquidity zones
Monitor FIIs/DII data from NSE reports
Combine options with futures arbitrage or cash segment hedging
🔹 Tools Used by Institutions:
Bloomberg Terminal
Custom-built Quant Models
NSE Option Chain + IV Analysis
Algo-driven trading based on volatility signals

Learn Institution Trading What is Institutional Option Trading?
It refers to large-scale option strategies used by hedge funds, banks, and FIIs to manage risk, hedge portfolios, or create directional bets with high precision.
🔹 Key Institutional Strategies:
Buy-Write (Covered Call):
Holding stocks and selling calls to earn premium.
Protective Put:
Buying puts as insurance to hedge stock positions.
Multi-leg Spreads (Iron Condor, Butterfly):
Neutral strategies to profit from range-bound markets.
Put-Call Ratio Analysis (PCR):
Gauging market sentiment from institutional flow.

Advanced Divergence Trading What is Divergence?
Divergence happens when the price moves in the opposite direction of an indicator (like RSI, MACD, or Momentum). It signals a possible trend reversal or trend weakening.
🔹 Types of Divergence:
Regular Divergence (Trend Reversal):
Bullish: Price makes lower lows, but indicator makes higher lows → Reversal up
Bearish: Price makes higher highs, but indicator makes lower highs → Reversal down
Hidden Divergence (Trend Continuation):
Bullish: Price makes higher lows, indicator makes lower lows → Trend continuation up
Bearish: Price makes lower highs, indicator makes higher highs → Trend continuation down
🔹 Advanced Tips:
Use on higher timeframes for accuracy
Confirm with volume, trendlines, or price action
Combine with support/resistance or Fibonacci zones
🔹 Pro Tools to Use:
RSI (Relative Strength Index)
MACD (Moving Average Convergence Divergence)
Stochastic Oscillator
OBV (On Balance Volume)

Support and Resistance ExplainedWhat is Support?
Support is a price level where a stock tends to stop falling due to increased buying interest. Traders view it as a demand zone where bulls often enter the market.
Example: If Reliance repeatedly bounces from ₹2,700, that level is acting as support.
🔹 What is Resistance?
Resistance is a level where a stock tends to stop rising due to selling pressure. It's a supply zone where bears usually take control.
Example: If Nifty keeps failing to cross 23,500, it's a resistance level.
🔹 Why They Matter:
Help in identifying entry and exit points
Show where trend reversals may occur
Aid in setting stop-loss and targets
🔹 How to Spot Them:
Look for price bounces or rejections
Use tools: horizontal lines, moving averages, Fibonacci retracements
Confirm with volume spikes
🔹 Key Strategy:
Buy near support (low risk)
Sell near resistance (high probability)
Trade breakouts or reversals with confirmation

Support and Resistance Support Level:
A price level where demand is strong enough to prevent the price from falling further. It's like a floor—buyers enter here expecting prices to rise.
Example: If Nifty falls to 22,000 repeatedly and bounces back, 22,000 becomes a support level.
🔹 Resistance Level:
A price level where selling pressure overcomes buying, preventing prices from rising. It's like a ceiling—sellers dominate at this level.
Example: If Bank Nifty rises to 50,000 but fails to move above, 50,000 is resistance.
📊 How to Identify Them:
Historical price charts
Trendlines
Moving averages
Fibonacci levels
Volume analysis
📈 Use in Trading:
Buy near support
Sell near resistance
Use breakout strategy when price breaches either level

GOLD GEARS UP FOR THE NEXT MOVE? All Eyes on Middle East & FedXAUUSD – GOLD GEARS UP FOR THE NEXT MOVE? All Eyes on Middle East & Fed
🌐 MACRO VIEW – WHAT'S MOVING GOLD?
🔺 Fed stays on hold, but Powell remains hawkish – His recent speech signals that inflation may persist due to ongoing geopolitical risks and rising commodity costs...
🔥 Middle East tensions could be the game-changer for gold prices:
If the US steps in as a mediator to de-escalate tensions between Israel and Iran, gold could see a deeper correction toward the 3,357–3,345 support zone, possibly lower...
On the other hand, Trump’s reported alignment with Israel and possible airstrikes on Iran would likely send gold soaring back to 3,417–3,440 levels, acting as a safe haven trigger.
📉 TECHNICAL SETUP (M30)
Gold is moving inside a descending channel, compressing within key EMAs (13–34–89–200).
A potential inverse head & shoulders pattern is forming at the bottom, signaling possible bullish breakout if confirmed.
Support remains firm around 3,345–3,357, while price struggles to break above the upper trendline.
✅ TRADING PLAN
🔵 BUY ZONE: 3,345 – 3,357
Entry: Look for bullish rejection and confirmation
SL: Below 3,342
TP: 3,373 → 3,384 → 3,403 → 3,417 → 3,440
🔴 SELL ZONE: 3,417 – 3,440
Entry: Wait for rejection and bearish confirmation near resistance
SL: Above 3,445
TP: 3,403 → 3,384 → 3,373 → 3,357
💬 FINAL THOUGHTS FOR INDIAN TRADERS
Even though the broader trend remains bullish, gold is not yet ready for a breakout – consolidation continues. Smart traders should stay patient, watch for clean setups, and manage risk well. Keep an eye on political developments, especially involving Iran, Israel, and the US, as they could trigger sharp moves in gold.
Trade smart. Let the market come to you.

Advanced Institutions Option Trading - Part 5Institutional Tools & Platforms
Bloomberg Terminal / Reuters Eikon: Institutional-grade data
FIX Protocols: For high-frequency option order routing
Quant Models: Statistical arbitrage using Python/R
Option Analytics Engines: Measure IV Skew, Smile, Surface modeling
Institutions don’t just trade options—they engineer risk-managed portfolios using AI and predictive analytics.
Option Chain Analysis for Traders
Option Chain provides a list of all available option contracts for a stock/index.
Key Elements:
Strike Prices
Call & Put Prices
Open Interest (OI)
Volume
Implied Volatility (IV)
Change in OI
Interpretation:
High OI + Rising Price = Strong Trend
IV Surge = High Volatility Expectation
PCR (Put-Call Ratio) = Market Sentiment Indicator
PCR > 1: Bearish sentiment
PCR < 1: Bullish sentiment

Advanced Institutions Option Trading - Part 3Why Trade Options?
Hedging against portfolio loss
Leverage with limited capital
Income generation through strategies like covered calls
Directional trading using strategies like long calls or puts
Investment Strategy using Options
LEAPS (Long-Term Equity Anticipation Securities): Investing in long-term call options
Covered Calls: Generate income while holding stocks
Cash-Secured Puts: Earn premium while waiting to buy a stock at lower price
These are often used by investors to add flexibility and income to portfolios.

Advanced Institutions Option TradingFinancial Market is a marketplace where assets such as stocks, bonds, commodities, and derivatives (like options) are bought and sold.
Key components:
Equity Markets – Shares of companies
Debt Markets – Government or corporate bonds
Derivatives Market – Futures, Options
Currency and Commodity Markets
Options are financial contracts giving the buyer the right (not obligation) to buy/sell an asset at a set price before a specific date.
✅ Types of Options:
Call Option: Right to Buy
Put Option: Right to Sell
✅ Key Terminologies:
Strike Price: Agreed price to buy/sell
Premium: Cost of the option
Expiration Date: Validity of the contract
ITM/ATM/OTM: In-the-money / At-the-money / Out-of-the-money

GOLD SPOT (XAU/USD) 1H ANALYSIS – BULLISH STRUCTURE HOLDING STRO📈 GOLD SPOT (XAU/USD) 1H ANALYSIS – BULLISH STRUCTURE HOLDING STRONG! 🚀✨
🔍 Overview:
Gold is currently trading within a well-defined ascending channel 📊, showing clear bullish intent. Price action has respected the lower channel support, bouncing strongly from a key demand zone highlighted in blue.
🟦 Support Zone:
The price is consolidating just above the $3,385–$3,390 support zone 🛡️, which has acted as a springboard multiple times in the past. This area aligns perfectly with the lower trendline, increasing its reliability.
📍 Key Price Targets:
🎯 $3,402 – First breakout confirmation and minor resistance.
🎯 $3,422 – Mid-level target, possible resistance.
🎯 $3,452 – High-probability target if bullish momentum continues.
🎯 $3,460+ – Extended target aligning with the channel top.
📈 Technical Structure:
Price is respecting higher lows and higher highs, maintaining bullish momentum.
A breakout above $3,402 could trigger the next leg up.
Market is forming a bullish flag/pennant consolidation—potential breakout pending ⏳.
⚠️ Risk Zone:
A break below the demand zone and the channel could invalidate the bullish setup ❌. Close monitoring of lower structure is essential.
✅ Conclusion:
As long as price holds above the key support zone and within the ascending channel, bullish continuation remains the favored scenario. A breakout above interim resistance levels could send Gold toward $3,450+! 🌟📊
🔔 Watch for bullish confirmation candles or volume spikes before entry!
📅 Chart published: June 18, 2025 | XAU/USD | 1H timeframe
🧠 Strategy: Bullish breakout play 📈
💡 Sentiment: Moderately Bullish ♻️

Gold Consolidates Ahead of Fed: Buy Signal or Bull Trap?🟡 XAUUSD 18/06 – Gold Consolidates Ahead of Fed: Buy Signal or Bull Trap?
🌐 MACRO & SENTIMENT OVERVIEW
The US Dollar Index (DXY) gained 0.7% to start the week, as markets anticipate the Fed may keep rates higher for longer due to rising oil prices and global geopolitical uncertainty.
However, with the upcoming FOMC meeting and US retail sales data, there is a strong potential for a shift in tone if growth shows signs of weakness.
Geopolitical tensions – particularly in the Middle East (Israel–Iran conflict) – continue to support gold’s defensive appeal, even as short-term profit-taking creates volatility.
📊 TECHNICAL OUTLOOK – M30 Chart
Gold is currently trading inside a descending channel, but price structure remains above EMA 13–34–89, keeping the potential for a bullish reversal alive.
Liquidity has been absorbed multiple times near 3,345, aligning with dynamic support from trendline and horizontal structure → a key decision zone for bulls.
On the upside, resistance between 3,440 – 3,445 remains a critical distribution zone, likely to trigger sell reactions if price fails to break convincingly.
🎯 TRADE SETUPS
🔵 BUY ZONE: 3345 – 3343
SL: 3339
TP: 3350 – 3354 – 3358 – 3362 – 3366 – 3370 – 3380 – 3400 – ???
📌 This zone overlaps with trendline and recent demand areas. Watch for bullish price action confirmation (e.g., engulfing, pin bar) before entering. If confirmed, we expect a strong bounce targeting the upper channel and beyond.
🔴 SELL ZONE: 3442 – 3444
SL: 3448
TP: 3438 – 3434 – 3430 – 3425 – 3420 – 3410 – 3400
📌 This is a strong supply area that has rejected price multiple times. Look for reversal signals like bearish divergence or rejection wicks to consider short entries.
✅ SUMMARY
Gold is caught in a critical reaccumulation zone ahead of the FOMC statement. Patience is key: allow the market to react at liquidity zones and follow price behavior instead of chasing moves.
Stick to your zones – protect your capital – and let the setups come to you.

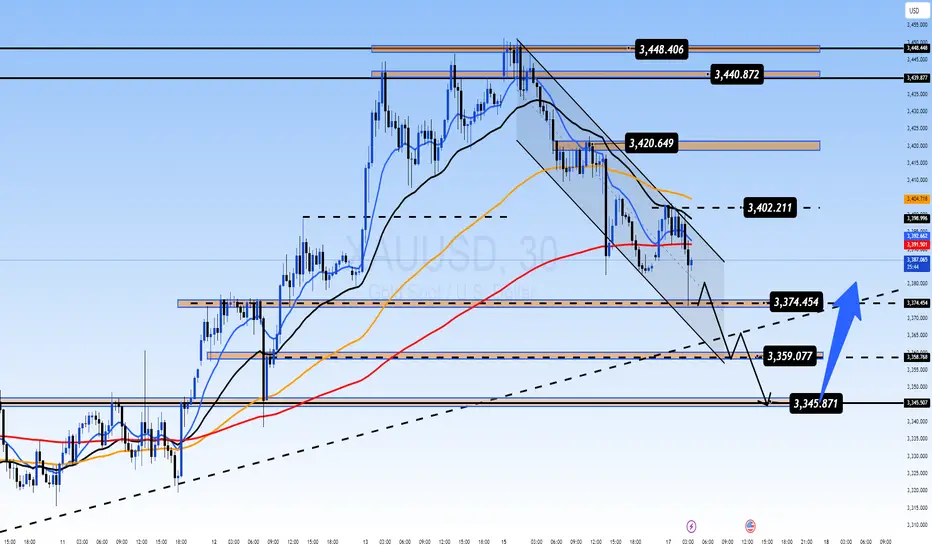
Gold Consolidating at Key Support: Is the Next Move a Reversal?XAUUSD 17 June – Gold Consolidating at Key Support: Is the Next Move a Reversal?
After a strong rally to 3,448 – the highest level in 8 weeks – gold faced profit booking and pulled back sharply towards 3,385. However, price is now sitting at a critical confluence of technical zones, and smart money may be preparing for the next strategic leg. Let’s decode the structure...
🌐 Macro & Market Sentiment
Geopolitical heat remains: Israel–Iran tension is far from cooling. Trump's statements about evacuating Tehran and pushing for a new nuclear deal are fueling safe-haven demand.
Fed policy meeting + US Retail Sales ahead: These upcoming events will shape inflation expectations and rate path clarity. Traders are cautious but alert.
Capital rotation: Large funds may be temporarily exiting gold and shifting into oil and stocks—triggering short-term volatility, not trend reversals.
📊 Technical Breakdown (M30-H1 Confluence)
Trend channel: Gold is currently trading within a descending short-term channel after failing to hold above the 3,440–3,448 supply zone.
EMA alignment (13-34-89-200): Squeezing closer, indicating momentum exhaustion and possible bullish crossover if support holds.
Fair Value Gap (FVG) + historical support + ascending trendline align near 3,345 → strong liquidity pocket forming here.
🎯 Trade Setups for Today
✅ BUY Setup (Liquidity Rebound)
BUY ZONE: 3,344 – 3,342
SL: 3,338
Targets:
→ 3,348 → 3,352 → 3,356 → 3,360
→ 3,364 → 3,368 → 3,372 → 3,380+
🧠 Ideal entry if price forms bullish rejection candle in this zone, especially during London open. Look for long-tail or inside bar confirmation.
⚠️ SELL Setup (Scalp-Only if Rejected)
SELL ZONE: 3,440 – 3,442
SL: 3,446
Targets:
→ 3,436 → 3,432 → 3,428 → 3,424
→ 3,420 → 3,415 → 3,410
📌 Only short if there's strong rejection from this supply zone. No blind entry—wait for clear bearish momentum or reversal wick with high volume.
🧭 Market Psychology
Retail traders were trapped on the breakout—smart money likely unloading at highs.
Price is now retracing to gather liquidity. If the 3,344 zone holds, we could see a powerful impulsive recovery.
Don’t trade the noise — trade the zones. Volume behavior around these levels will reveal market intention.
📌 Final Thoughts
This is a classic case of controlled retracement after a breakout. If gold finds support at the BUY ZONE, the next bullish wave could target 3,400+ again. But if the 3,345 area fails, deeper correction toward 3,320 is possible.
🧘♂️ Stay patient. Let price come to you.
✅ Follow structure, respect SL, and trade with clarity.
Gold Drops After Asian FOMO: Bull Trap or Liquidity Grab?🟡 XAUUSD 16/06 – Gold Drops After Asian FOMO: Bull Trap or Liquidity Grab?
After a strong bullish rally in the Asian session driven by fear-based headlines and war news, gold (XAUUSD) suddenly reversed sharply — confusing many retail traders who jumped in late. But when we look deeper into price behavior and volume, the story becomes clearer...
📌 Key Fundamental Insights
🔸 Geopolitical headlines (war tensions, assassination attempts) triggered a FOMO rally in gold early in Asia.
🔸 However, the lack of follow-through volume suggests this may have been a bull trap—a smart money strategy to unload positions into emotional buying.
🔸 Big funds could be reallocating capital temporarily from gold into:
🔹 Stocks (tech & value sectors are correcting attractively)
🔹 Oil (Middle East tension = higher oil price = strong institutional interest)
🔍 Technical Outlook (M30 Chart)
The technical structure shows a textbook liquidity play:
🔻 Price spiked into resistance at 3456, then reversed
🧊 EMAs (13/34/89/200) are flattening → signs of potential bearish crossover on M15–M30
📉 Volume has been declining → confirms exhaustion of the FOMO move
📦 A large Fair Value Gap (FVG) sits below current price, acting as a magnet for liquidity
🎯 Strategy Setup
Scenario 1: BUY from FVG (Liquidity Reclaim)
Entry: 3383 – 3385
SL: 3377
TPs: 3386 → 3390 → 3394 → 3398 → 3402 → 3406 → 3410+
Structure favors a bounce from this zone if confirmed by price action during London or NY sessions.
Scenario 2: SELL if price re-tests 3456–3458
Entry: Only on clear rejection
SL: 3462
TPs: 3452 → 3448 → 3444 → 3440 → 3435 → 3430
⚠️ Avoid shorting blindly — only trade confirmed rejections with strong candle setups.
Market Psychology Right Now
Big players may be unloading gold to rotate into oil and equities
Asian FOMO = retail got trapped
Volume profile shows imbalance: market likely seeking liquidity lower before moving higher again
📝 Final Thoughts
Gold is in a volatile reaccumulation zone. Rather than chasing price, it’s better to let the market come to your planned zones. The 3383–3385 zone will be critical. If it holds, we may see a solid bounce into next week.
Discipline beats emotion. Respect your SL and stick to the zone logic.
📌 Follow for intraday updates. Will post re-entry plan during London session if price reacts early.

Option Trading Master class Part -7Fundamentals of Stock Investing
Types of Investors:
Value Investors: Focus on undervalued companies
Growth Investors: Target high-growth potential stocks
Dividend Investors: Prefer regular income from dividends
Research Parameters:
Earnings per Share (EPS)
Price-to-Earnings Ratio (P/E)
Return on Equity (ROE)
Debt-to-Equity Ratio
Industry Trends
Tools for Investing:
Demat and Trading Account
Research Platforms (e.g., TradingView, Screener.in)
Portfolio Tracker (e.g., Zerodha Console)

Learn institutional Trading Part -5Option Buying vs Selling
Option Buyers
Pay premium
Unlimited profit, limited risk
Need strong directional movement
Option Sellers (Writers)
Receive premium
Limited profit, unlimited risk
Thrive in sideways or range-bound markets
Need deep knowledge of Greeks and risk management
6. Popular Option Trading Strategies
Beginner Strategies
Long Call/Put – Directional trades
Protective Put – Hedge stock losses
Covered Call – Generate income from holdings
Intermediate Strategies
Bull Call Spread – Buy and sell calls of different strikes
Bear Put Spread – Buy and sell puts
Straddle – Buy both call and put at same strike (high volatility)
Strangle – Buy OTM call and put (cheaper than straddle)
Advanced Strategies
Iron Condor – Neutral strategy with 4 legs
Butterfly Spread – Limited risk range strategy
Calendar Spread – Exploiting time decay differences
Ratio Spread – More contracts sold than bought

Learn institution Trading Part -3How Option Prices Move – The Greeks
Delta: Sensitivity to price change in the underlying
Gamma: Rate of change of Delta
Theta: Time decay – loss in value as expiry nears
Vega: Sensitivity to Implied Volatility (IV)
Rho: Interest rate sensitivity
Understanding Greeks helps manage risk, adjust positions, and time trades better.
4. Why Traders Choose Options
Leverage: Control large positions with limited capital
Risk Control: Limited loss in buying options
Flexibility: Multiple strategies (bullish, bearish, neutral)
Hedging: Protect existing stock portfolios
Income Generation: Through writing options like covered calls

Master class 9. Introduction to Option Trading
Options are powerful derivative instruments that give buyers the right (not obligation) to buy or sell an underlying asset at a predetermined price within a specific time. They are commonly used for hedging, speculation, and income strategies.
There are two basic types:
Call Options: Right to buy
Put Options: Right to sell
Options derive value from stocks, indices (Nifty, Bank Nifty), commodities, or currencies and are traded on platforms like NSE in India.
2. Key Terminology in Option Trading
Strike Price: Price at which the option can be exercised
Premium: Cost of buying the option
Expiry: Last day the option is valid
Lot Size: Fixed number of underlying units (e.g., 50 for Nifty)
Intrinsic Value: Real value of an option if exercised now
Time Value: Portion of premium linked to time left before expiry
ATM/ITM/OTM: At The Money, In The Money, Out of The Money – defines moneyness of options

Advanced Technical Master classMulti-Timeframe Analysis involves analyzing multiple chart timeframes (Monthly, Weekly, Daily, 4H, 1H) to confirm trend direction and improve timing accuracy.
Application:
Identify long-term trend (Monthly/Weekly)
Use Daily/4H for entry signals
Filter noise with lower timeframes
Key Tools: Moving Averages, Trendlines, MACD
Module 2: Advanced Chart Patterns
Key Patterns Covered:
Harmonic Patterns (Gartley, Bat, Crab)
Elliott Waves (Impulse & Corrective Waves)
Wyckoff Method (Accumulation/Distribution Phases)
Practical Use:
Pattern + Volume = Strong Entry
Combine with Fib levels for reversal confirmation
Module 3: Volume Price Analysis (VPA)
Core Principle:
Volume precedes price. Learn to read volume spikes, absorption, and exhaustion.
Indicators to Use:
On Balance Volume (OBV)
Volume Profile
VWAP

Institution Master class Welcome to the Institution Trading Master Class, an advanced educational module crafted for serious traders and investors who want to understand how big institutions trade, move markets, and manage risk at scale. This course blends practical market experience with strategic tools and institutional concepts.
📘 Page 1: Understanding Institutional Trading
🔹 What is Institutional Trading?
Institutional trading refers to market activities performed by large entities like:
Mutual Funds
Pension Funds
Hedge Funds
Insurance Companies
Foreign Institutional Investors (FIIs)

Institution Option Trading Part-7Regulatory & Risk Considerations
SEBI (India) & SEC (US) regulations limit speculative exposure.
Institutions must report Open Interest, Position Limits, Margin Usage.
Must adhere to VaR (Value at Risk) frameworks and internal risk policies.
Institutional Trading during Events
Earnings Seasons: Institutions use straddles/strangles for earnings plays.
Budget or RBI Policy: Protective collars/volatility trades.
Global Crisis (e.g. COVID): Use of massive protective puts (SPX, NIFTY).
VIX & Institutional Behavior
India VIX plays a vital role in determining institutional option strategies.
High VIX = buying protection, long gamma strategies.
Low VIX = selling premium, income strategies.
