Will Gold Break Through 3366 or Pull Back Before NFP Week?XAUUSD PLAN – 26/05 | Will Gold Break Through 3366 or Pull Back Before NFP Week?
Gold is currently trading near a major resistance zone after a sharp rebound last week. With Fed policies still hawkish and trade tensions between the US and EU on hold, the market is entering a wait-and-see phase — ideal for structured trades.
🌍 MACRO CONTEXT:
Trump Delays 50% Tariffs on EU Until July 9: This cooled market tension temporarily but doesn’t eliminate the risk long term.
US 10-Year Yields Surge Back Above 4.55% right after, showing bond markets are still pricing in tighter conditions.
The Fed Faces Strategic Losses: As rate hikes increase reserve interest payments, the Fed is trimming 10% of its workforce — a rare signal of operational pressure.
➡️ Investors should brace for volatility ahead of NFP and watch closely for central bank reactions.
🔍 TECHNICAL OUTLOOK – H1/H4 View:
Gold is respecting a rising channel while consolidating near the 3360–3366 region — a key sell zone with potential for reversal.
The chart also shows clear Fair Value Gaps (FVGs) above and below current price, signaling pending liquidity sweeps.
🔑 KEY TECHNICAL LEVELS
🔺 Resistance Zones:
3364 – 3366 → Local top and key reversal zone
3406 – 3408 → FVG upper bound, potential blow-off target if breakout occurs
🔻 Support Zones:
3324 – 3326 → 20 EMA retest, potential bullish bounce
3310 – 3308 → Trendline + EMA89 confluence
3304 → Break below this area could invalidate short-term bull bias
🎯 TRADE SETUPS
🟢 BUY SCALP:
Entry: 3326 – 3324
Stop-Loss: 3320
Take-Profit: 3330 → 3334 → 3338 → 3342 → 3346 → 3350
🟢 BUY ZONE:
Entry: 3310 – 3308
Stop-Loss: 3304
Take-Profit: 3314 → 3318 → 3322 → 3326 → 3330 → 3340
🔴 SELL SCALP:
Entry: 3364 – 3366
Stop-Loss: 3370
Take-Profit: 3360 → 3356 → 3352 → 3348 → 3344 → 3340
🔴 SELL ZONE:
Entry: 3406 – 3408
Stop-Loss: 3412
Take-Profit: 3400 → 3396 → 3392 → 3388 → 3385 → 3380
⚠️ STRATEGY RECOMMENDATION:
If price breaks above 3366 with momentum, expect a run to 3408 and possibly 3450.
If price rejects 3366 or fails to hold above 3320, scalpers can look for quick shorts with tight stops.
📌 Avoid chasing price in the middle of the range. Wait for strong rejection or breakout confirmation to enter.
Analysis

GOLD PLAN 23/05–YIELD CURVE FLIPS Will Gold Breakout or Sell Off🔥 GOLD PLAN 23/05 – YIELD CURVE FLIPS | Will Gold Breakout or Sell Off at 3360?
Global markets are heating up again as risk sentiment shifts. A major alert comes from the U.S. bond market:
For the first time since October 2021, the yield curve between the 5-year and 30-year treasuries inverted to +1.00%, signaling strong expectations for inflation and future growth concerns.
🌍 MACRO CATALYSTS DRIVING GOLD:
Iran warns the U.S.: “Leash your mad dog!” – escalating rhetoric as Israel is rumored to be preparing a strike on Iran's nuclear sites. Tehran vows to retaliate and holds the U.S. accountable.
Goldman Sachs says: “Only one way – BUY GOLD!”
Following the failed 20-year bond auction, rising deficits, and fiscal stress, GS urges investors to move into gold and crypto.
The return of risk-off sentiment makes Gold the #1 safe haven asset, attracting global institutional flow.
📈 TECHNICAL OUTLOOK (H1 Chart):
Critical resistance at 3358–3360 is a key decision zone.
A breakout here may trigger a strong move toward previous highs (ATH zone: 3390–3400).
Major support lies around 3276–3274.
A breakdown here may expose gold to deeper pullbacks below the 3200 handle, revisiting the FVG zone.
📌 TRADE PLAN FOR TODAY:
🔵 BUY ZONE:
Entry: 3276 – 3274
SL: 3270
TP: 3280 – 3284 – 3288 – 3292 – 3296 – 3300
🔵 BUY SCALP:
Entry: 3304 – 3302
SL: 3298
TP: 3308 – 3312 – 3316 – 3320 – 3325 – 3330 – 3340
🔻 SELL ZONE:
Entry: 3376 – 3378
SL: 3382
TP: 3372 – 3368 – 3364 – 3360 – 3350
🔻 SELL SCALP:
Entry: 3344 – 3346
SL: 3350
TP: 3340 – 3336 – 3332 – 3328 – 3324 – 3320
⚠️ Caution:
With geopolitical risk and bond market stress rising, volatility is expected to spike. Be patient and trade only on confirmation from key zones.
🎯 Stick to the plan. Don't chase the price. Protect your capital.

Is Gold Set to Explode or Fake Out at 3400?GOLD PLAN 22/05 – TERROR ATTACK SHOCKS MARKETS | Is Gold Set to Explode or Fake Out at 3397?
Markets have just been hit by fresh geopolitical tension:
An Israeli diplomat was shot dead in Washington D.C. during a high-profile Jewish community event near the Holocaust Museum. The shooter allegedly shouted political slogans, and the FBI is now treating the case as a potential anti-Semitic terrorist act.
Former President Donald Trump called the event “disgusting” and urged the U.S. to stand strong against extremism.
🟡 This incident triggered a wave of risk aversion, pushing safe-haven assets like GOLD into the spotlight once again.
🌐 FUNDAMENTAL CONTEXT:
The USD remains under pressure due to weak U.S. economic data (housing, manufacturing, retail).
Despite the Fed’s “higher for longer” tone, markets are pricing in potential rate cuts by Q3.
Rising geopolitical tensions in the Middle East & U.S. soil may fuel further gold demand in the short term.
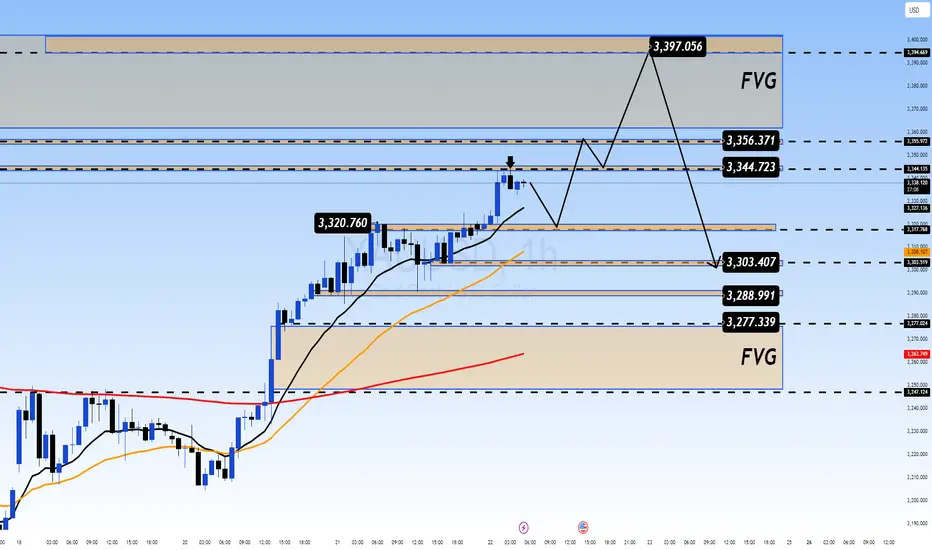
📈 TECHNICAL OUTLOOK (H1 Chart):
Price is nearing FVG resistance at 3395–3397, which could serve as a liquidity trap for breakout traders.
Key mid-zone resistance: 3344–3356, where price might stall or reverse if upward momentum weakens.
Strong support levels: 3303 – 3288 – 3277, aligned with previous structure and demand zones.
📌 TRADE PLAN:
Buy zone: 3296 - 3294
SL: 3290
TP: 3300 - 3304 - 3308 - 3315 - 3320 - 3330 - ???
Buy Scalp: 3316 - 3314
SL: 3310
TP: 3320 - 3324 - 3328 - 3332 - 3340 - 3350
Look for bullish reaction from the support zone and enter with proper risk management.
🔻 Sell zone: 3395 – 3397
SL: 3401
TP: 3390 - 3386 - 3380 - 3376 - 3370
🔻 Sell Scalp: 3358 - 3360
SL: 3364
TP: 3354 - 3350 - 3346 - 3342 - 3338 - 3330
If price spikes into FVG and shows exhaustion or bearish reversal, short setup is valid.
⚠️ Warning: Due to geopolitical headlines and gold trading near psychological resistance, expect high volatility and potential for traps.
🎯 Stick to your zones. Manage TP/SL properly. Do not chase price!
Technical Levels Respected – BTC Reaches $108K Target📍 BTC Target Hit with Precision!
✅ As predicted in the previous analysis, Bitcoin has successfully tapped the $108K resistance zone — clean and technical execution!
📊 My chart spoke in advance... and the market listened.
🎯 Why miss out on these accurate forecasts?
📉 My strategies are not just random lines — they’re built on solid market structure, EMAs, and key price action zones.
📢 Let’s stay connected!
🧠 I’m committed to sharing educational content and professional trading insights to help you grow as a trader.
💡 Whether you're a beginner or seasoned trader, there’s always something new to learn with me.
📚 Join the journey — learn, trade, and win!
📩 DM or follow to get consistent updates and chart breakdowns.
🚀 Let’s trade smart, not hard!

FED HAWKISHNESS VS TECHNICAL FAIR VALUE GAPS – BIG MOVE COMING?GOLD PLAN 21/05 – FOMC HAWKISHNESS VS TECHNICAL FAIR VALUE GAPS – BIG MOVE COMING?
The recent surge in gold has paused just as traders digest the latest Federal Reserve signals. Despite rising geopolitical risks and weakening U.S. economic data, Fed officials continue to project a “higher-for-longer” rate stance, keeping the dollar afloat and adding pressure on gold’s rally.
📉 However, the technical structure tells another side of the story.
⚙️ TECHNICAL OUTLOOK: Bearish Trap or Hidden Bullish Opportunity?
On the 1H timeframe, XAU/USD is showing signs of consolidation after tapping into a major Fair Value Gap (FVG) around the 3328–3356 area. We now observe two key FVG zones above and below current price, highlighting high volatility and potential liquidity grabs.
🔍 A short-term bullish scenario is forming if gold retraces towards 3250–3252 support, where trendline confluence and dynamic support suggest strong demand.
Conversely, any strong rejection from 3354–3356 SELL ZONE could activate a bearish play back towards the lower structure levels.
💹 TRADE SETUPS FOR TODAY:
🔵 BUY ZONE:
Entry: 3252–3250
Stop Loss: 3246
Take Profit Targets:
3256 – 3260 – 3264 – 3268 – 3272 – 3280 – 3300 – ???
🔵 BUY SCALP:
Entry: 3277–3275
Stop Loss: 3272
Take Profit Targets:
3280 – 3284 – 3288 – 3292 – 3296 – 3300
🔻 SELL ZONE:
Entry: 3354–3356
Stop Loss: 3360
Take Profit Targets:
3350 – 3346 – 3342 – 3338 – 3334 – 3330 – 3320
🔻 SELL SCALP:
Entry: 3328–3330
Stop Loss: 3334
Take Profit Targets:
3324 – 3320 – 3316 – 3310 – 3305 – 3300
🌍 MACRO INSIGHT:
Fed’s hawkish tone is weighing on precious metals, but gold remains attractive under geopolitical uncertainty and de-dollarization trends.
China and other central banks continue their accumulation, suggesting long-term bullish pressure is intact.
Watch for U.S. data this week – especially PMI and jobless claims – which could provide short-term catalysts.
📌 Stay cautious and disciplined. Stick to your zones and manage risk tightly – volatility is increasing.
👉 If you found this useful, don’t forget to like, comment and follow for daily gold insights!

Key Rejection Zone Approaching – Bearish Setup in PlayChart Summary:
Asset: Unspecified (USD-based)
Timeframe: Short-term (likely 1H or 4H)
Indicators:
EMA 50 (red): 3,245.772
EMA 200 (blue): 3,223.635
Key Zones:
Resistance Zone (Red box): ~3,310–3,360
Target/Support Zone (Red box): ~3,110–3,160
Mid Support Zone (Blue box): ~3,200–3,230
Trendline: Downward sloping resistance connecting major highs
---
Technical Breakdown:
Trend Analysis:
Primary Trend: Bearish ⬇️
Confirmed by the downtrend line (black) which has been respected multiple times (3 clear touches).
Current Price: 3,290.090
Price is approaching a key confluence zone: resistance area + trendline.
This area has previously acted as strong supply.
Moving Averages:
EMA 50 > EMA 200: Minor bullish signal (Golden Cross), but price action is still below major resistance.
However, this cross may be a false signal if price gets rejected here.
---
Price Action:
Current Move: Strong bullish push toward resistance after rebounding from the target zone ✅
The resistance zone and trendline are likely to act as a rejection point unless broken decisively.
---
Bearish Scenario (High Probability):
If price fails to break above the resistance zone:
Expect a rejection and move back toward:
Blue mid-support: ~3,220
Target zone: ~3,130 (major demand area)
Confirmation: Bearish candlestick pattern or strong wick rejections near resistance.
🔵 Entry Idea: Short near 3,310–3,350
🎯 Target: 3,130 zone
✋ Stop-Loss: Above 3,360 (above trendline + resistance)
---
Bullish Scenario (Less Likely):
If price breaks above the resistance zone with strong volume:
Could signal trend reversal
Next target levels: ~3,400+
---
Conclusion:
Bias: Bearish near resistance zone
Key Level to Watch: 3,310–3,360 (critical for direction)
Trading Approach: Wait for confirmation, don't preemptively short without rejection signals.

GOLD MARKET UPDATE - BE READY FOR BIG MOVES!🔥 GOLD MARKET UPDATE – FED'S HAWKISH STANCE SHAKES INVESTORS | BE READY FOR BIG MOVES!
Gold experienced a sharp drop following the latest hawkish comments from the Federal Reserve, as they reaffirmed that current monetary conditions remain stable and tight. This has caused confusion and panic among many investors, leading to a wave of sell-offs during the U.S. and early Asia sessions.
📉 On the higher timeframes, Gold appears to be forming a bearish flag pattern – a classic consolidation structure before a potential continuation move. Despite the strong bullish momentum seen during the Asian and European sessions yesterday, the key resistance near 325x held firm, preventing any major breakout.
For now, Gold seems to be trapped in a new sideways range, and unless price decisively breaks above 325x, we may continue to see choppy price action within this zone.
⚠️ However, if the current selling momentum persists and the price breaks down below the lower trendline support, the bearish flag setup could play out, with up to 80% probability, signaling a potential strong continuation of the downtrend.
Traders should stay extremely alert – a major price movement could happen at any moment!
🔑 Key Support Levels:
3205
3294
3280
3262
🔑 Key Resistance Levels:
3244
3262
3278
3286
💹 Scalping Setup – BUY:
Entry: 3294–3292
Stop Loss: 3288
Take Profit Targets:
3298 – 3302 – 3306 – 3310 – 3315 – 3320 – 3330
🟢 BUY ZONE:
Entry: 3272–3270
Stop Loss: 3266
Take Profit Targets:
3276 – 3280 – 3284 – 3288 – 3292 – 3296 – 3330
🔻 Scalping Setup – SELL:
Entry: 3242–3244
Stop Loss: 3248
Take Profit Targets:
3238 – 3234 – 3230 – 3226 – 3220 – 3210
🔻 SELL Zone:
Entry: 3276–3278
Stop Loss: 3282
Take Profit Targets:
3272 – 3268 – 3264 – 3260 – 3250 – 3240
📌 Remember to always follow your TP/SL strategy to protect your capital!

GOLD DAILY PLAN MAY 19: IS THIS THE START OF A MASSIVE BULLISH GOLD DAILY PLAN – MAY 20: IS THIS THE START OF A MASSIVE BULLISH RUN?
Gold opened the new trading week with a powerful GAP UP of over 20 USD, followed by an additional 50 USD rally during the Asia session. This explosive move is being fueled by geopolitical tensions and macroeconomic uncertainty, setting the tone for what could be a highly volatile and profitable week for gold traders.
🔥 Key Fundamental Drivers Behind This Gold Rally:
1️⃣ Putin rejects peace talks – Increased war risks reignite gold’s safe-haven appeal.
2️⃣ U.S. credit rating downgraded – Rising debt and bond yields are pushing investors back to gold.
3️⃣ Trump threatens new trade tariffs – Even a softer version of “Trade War 2.0” could shock global markets, making gold a top hedge.
➡️ With no clear resolutions in sight, gold may soon retest the all-time high of $3,500.
🧠 Technical Analysis: Bullish Signals Are Confirming
EMA13 has crossed above EMA34 and EMA200 on the M30 chart — a classic reversal confirmation.
The main trendline was broken, and price is now retesting the breakout zone.
Momentum remains strong, and price structure is shifting bullish. Priority is now to BUY the dips rather than sell counter-trend.
📌 Key Price Levels to Watch:
🔺 Resistance Zones:
3254 – 3277 – 3288
(If price breaks above 3287, we may quickly see a move toward 3350–3500.)
🔻 Support Zones:
3204 – 3193 – 3186 – 3174 – 3163
(Best areas to watch for confirmation to BUY.)
🎯 Suggested Trade Ideas:
BUY Zone: 3186 - 3184
Stop-Loss (SL): 3180
Take-Profit (TP): 3190 → 3195 → 3200 → 3210 → 3220 → 3230
BUY Scalp: 3194 - 3192
Stop-loss: 3189
Take-Profit: 3200 - 3204 - 3210 - 3215 - 3220
SELL Zone: 3287 - 3289 Only scalp or take quick profits near resistance zones
Stop-Loss (SL): 3293
Take-Profit (TP): 3285 → 3280 → 3285 → 3280 → 3270
(Note: Avoid holding SELLs, only scalp on strong bearish signals.)
⚠️ Trading Notes:
Market is highly sensitive to geopolitical headlines. One comment from Trump or Putin could move gold 50–100 USD in minutes.
No need to chase price. Let it come to your zones — and only enter on clear confirmations.
📌 Summary:
✅ Structure has turned bullish across M30 and H4.
✅ Focus on buying dips, not shorting into strength.
✅ Medium-term target zones: 3350 → 3400 → 3500, depending on continued macro pressure.
📣 Follow AD for live trading plans, market sentiment, and smart entry zones every session!
Good luck & stay disciplined.

Critical Reversal or Breakdown? | XAU/USD at Make-or-Break Zone 📉 Chart Overview:
Instrument: XAU/USD (assumed from chart context)
Timeframe: 4H or Daily (based on candlestick size)
Indicators Used:
📏 EMA 50 (Red): 3,247.86
📏 EMA 200 (Blue): 3,221.42
🔍 RSI (14): Currently at 45.90 (below midline, showing weak momentum)
🔎 Key Zones:
🧱 Support Zone: ~3,180 – 3,220
Price is currently sitting on this key demand zone.
Price previously bounced here sharply ➡️ indicating buyer interest.
📦 Resistance Block: ~3,260 – 3,280
Short-term resistance, price has been repeatedly rejected from here.
🎯 Target Zone: ~3,420 – 3,460
If price breaks out from the support-resistance squeeze, this is the potential bullish target 🎯.
🧭 EMA Analysis:
EMA 50 is still above EMA 200 ➡️ Golden Cross formation (medium-term bullish bias) ✅
However, price is currently below both EMAs, signaling short-term weakness ❌
📉 Bearish Scenario (📍Blue Arrow Down):
If price breaks below the support zone at ~3,180, we could see a sharp drop toward the next support at ~3,032 🔻.
RSI is trending down near 40, close to oversold territory ⚠️
🚀 Bullish Scenario (📈 Blue Arrow Up):
A successful retest and bounce from this support area (currently forming a rounded bottom 🥄) could lead to a bullish move toward the target zone.
This is further supported by the potential RSI bounce from the 40 area, signaling renewed momentum 🔋.
✅ Bias & Conclusion:
Neutral-to-Bullish Bias 🤝: As long as the price holds above the major support zone (~3,180), buyers have a chance to reclaim higher levels.
Look for confirmation breakout above the local resistance (~3,260) for a move toward 3,400+ 🚀.
A breakdown below support would invalidate the bullish thesis and target 3,030 instead 📉.
🛠️ Trading Plan (not financial advice!):
Long Entry: On bullish breakout & retest of ~3,260 ✅
Stop-Loss: Below ~3,180 ⚠️
Target: ~3,420 – 3,460 🎯

GOLD Pullback or Bull Trap? This Move for the WEEK⚡️Will the Recovery Hold or Just a Retest Before Another Drop?
🧠 Macro Backdrop:
Geopolitical tension: US-China trade headlines and Russia-Ukraine negotiations continue to stir uncertainty, but risk appetite is still cautious.
US CPI and PPI data this week came in weaker than expected → inflation remains soft, but no signal yet for immediate rate cuts from the Fed.
Gold has been under pressure for 2 weeks but may be stabilizing as DXY loses steam and equity markets show hesitation.
🔍 Technical Outlook (Chart: M30–H1):
Gold is forming a rising wedge within a broader corrective pattern. Yesterday’s rebound from the 3,163 zone has pushed price back above the 20 EMA (black) and is testing the 3,208–3,210 zone.
This area is key for today: breakout or rejection?
🔑 Key Levels to Watch:
🔺 Resistance:
3,221 → Local structure neckline
3,235 → Previous supply + Fibo confluence
3,251 → Strong upper bound resistance
🔻 Support:
3,184 → Minor support (demand block)
3,173 → Swing low (key reaction zone)
3,163 → Final line of defense
📈 Trade Scenarios:
⚠️ Scenario A – Bullish Push Above 3,221:
If price breaks and holds above 3,221, we may see a bullish continuation to 3,235 and even 3,251.
Momentum confirmation: Price must stay above 3,210 on pullbacks.
🔹 Entry: 3,222 – 3,224
🔹 SL: 3,216
🔹 TP: 3,235 → 3,251
⚠️ Scenario B – False Break & Bearish Rejection:
If price fails to hold above 3,221 and reverses below 3,208 → potential short opportunity targeting lower liquidity zones.
🔻 Entry: 3,220 – 3,218 (after rejection)
🔻 SL: 3,228
🔻 TP: 3,184 → 3,173 → 3,163
⚠️ Scenario C – Range Play:
If price remains between 3,208 and 3,184, scalp inside the range and wait for breakout confirmation.
💬 Follow for real-time setups and live strategy updates during major market sessions.

GOLD OUTLOOK – MAY 16: MARKET TRAP OR LEGITIMATE RECOVERY?GOLD OUTLOOK – MAY 17: MARKET TRAP OR LEGITIMATE RECOVERY?
Gold is closing out the week with unpredictable volatility, following two extreme sessions where prices dropped over 100 pips, only to rebound aggressively. Are recent news headlines just justifying the price action, or is this a well-orchestrated market trap?
🔍 Technical Breakdown (D1 & H4)
On the daily and 4-hour charts, we can clearly see a sharp breakdown, followed by an immediate rebound into the 325x area.
🎯 Key Level to Watch: 3254 – 3256
If price remains below 3256, sellers continue to dominate.
If 3256 is broken to the upside, we could see a quick move toward 327x–328x.
This zone acts as a decisive barrier between continuation and reversal.
🌐 Macro Perspective – Market Triggers
US inflation data continues to disappoint, weakening the USD and halting DXY recovery.
US-China tensions flare up again after short-lived optimism, especially around tariff talks and rare earth restrictions.
With mixed geopolitical cues, this market is prone to fakeouts and liquidity sweeps, especially ahead of the weekend.
📌 Key Levels to Monitor
🔺 Resistance Zones: 3237 – 3251 – 3261 – 3276 – 3287
🔻 Support Zones: 3205 – 3188 – 3170 – 3143
🎯 Trading Plan
🔵 BUY SCALP:
Entry: 3172 – 3170
SL: 3166
TP: 3176 → 3180 → 3184 → 3188 → 3192 → 3200
🔵 BUY ZONE:
Entry: 3142 – 3140
SL: 3136
TP: 3146 → 3150 → 3154 → 3158 → 3170 → 3180 → 3190
🔴 SELL SCALP:
Entry: 3160 – 3162
SL: 3166
TP: 3156 → 3152 → 3148 → 3144 → 3140 → 3130
🔴 SELL ZONE:
Entry: 3276 – 3278
SL: 3282
TP: 3272 → 3268 → 3264 → 3260 → 3255 → 3240
⚠️ Key Notes:
Friday sessions often bring major liquidity grabs and false breakouts.
Be disciplined with SL/TP management – especially in such volatile conditions.
Wait for candle confirmation before reacting — don’t trade emotionally.

BTC/USD DAILY PLAN – Will Bitcoin Hit 110K Before Reversing?BTC/USD DAILY PLAN – Will Bitcoin Hit 110K Before Reversing?
After a strong bullish impulse, BTC is now consolidating in a tight range between 103K–106K on the H4 chart. The ascending parallel channel remains intact, but bullish momentum is fading — a sign of potential distribution at the top.
🧠 Macro Context
BTC pumped recently thanks to ETF news and institutional inflows.
However, volume is decreasing, suggesting smart money may be offloading.
DXY and U.S. bond yields are ticking up → this could add pressure on BTC in the short term.
📊 Technical Outlook (H4 Chart)
BTC remains inside an ascending channel. Key levels to watch:
🔺 Resistance:
106,000 – local range high (H4)
110,576 – extended target if price breaks out
🔻 Support:
101,775 – bottom of current range; a breakdown here confirms weakness
94,473 – strong demand zone + EMA200
84,371 – key structural support zone if deeper correction occurs
⚠️ BTC may fake a rally toward 110K and then reverse sharply if broader macro conditions worsen.
🎯 Trading Scenarios
🔹 SCALP BUY:
Entry: 101,800 – 102,000
Stop-Loss: 100,800
Take-Profits: 103,200 → 104,000 → 105,000 → 106,000
Only enter long if price holds above 101.7K and shows strong rejection candles.
🔸 SELL ZONE:
Entry: 110,000 – 110,500
Stop-Loss: 111,200
Take-Profits: 107,000 → 105,000 → 101,775 → 94,473
Watch for exhaustion or false breakout patterns at this psychological zone.
🟢 LONG-TERM BUY ZONE:
Entry: 94,500 – 94,000
Stop-Loss: 92,500
Take-Profits: 96,000 → 98,000 → 100,000 → 103,000
Ideal for swing entries if BTC retraces into the broader demand zone.
⚠️ Key Notes:
BTC is showing signs of “rise slowly – dump fast” behavior.
Keep close watch on 101,775 – a decisive level for intraday direction.
No Fed rate cuts in sight → big money may still stay cautious.
✅ Conclusion:
Stick to trading range setups: BUY at channel base – SELL at distribution zones
Avoid FOMO and only enter trades after clear price action confirmation.
Risk management is essential during this high-trap environment.

DOUBLE TOP IN PLAY? IS $3000 THE NEXT STOP?DOUBLE TOP IN PLAY? IS $3000 THE NEXT STOP?
Gold (XAU/USD) is showing signs of one of the most bearish patterns on the daily chart – the Double Top formation. After reaching an all-time high near $3,500, the metal has entered a sharp correction phase, now hovering dangerously close to the psychological support at $3,200.
🕯️ Technical Breakdown:
A clear Double Top pattern is visible on the Daily (D1) chart, with two peaks forming near the same resistance level – a classical signal of bullish exhaustion.
If today's daily candle closes below the $3,200 zone, we may see a sharp drop toward the $3,000 level in the short to medium term.
The neckline of this pattern aligns with the critical support at 3196–3200 – a must-watch area for potential breakdown confirmation.
💸 What the Smart Money Is Doing:
Investors are pulling out of Gold and rotating into risk-on assets like equities and crypto, chasing higher yields and growth potential.
This shift suggests more than just technical correction – it may reflect a broader macro sentiment change, especially if the Fed continues to maintain its hawkish tone and delays rate cuts.
📊 Suggested Trade Scenarios:
🔻 If Daily Close is Below $3,200:
High probability sell setup based on Double Top
Potential downside targets: 3120 → 3050 → 3000
🔺 If Price Holds Above $3,200 and Bounces:
Watch for retracement to 3250–3278 for potential reversal signals
Short-term BUY scalp towards 3300–3320 with tight SL below 3190
⚠️ What to Watch This Week:
Key US data including CPI, PPI, and a speech from the Fed Chair are expected — which could cause high volatility.
Market is extremely reactive — avoid emotional trades and wait for clear structure confirmations.
Risk management is key, especially in current uncertain market conditions.
📌 Final Thoughts:
The Double Top on Gold is becoming a strong technical signal for potential trend reversal. A confirmed break below $3,200 could open the door to a deeper correction toward $3,000.
📣 Stay connected with AD for more real-time updates, technical levels, and smart trading setups every session.

RSI ( Relative Strength Index)In trading, RSI stands for Relative Strength Index, a momentum indicator used to assess overbought or oversold conditions in a market. It measures the speed and change of price movements, providing traders with insights into potential entry and exit points.

GOLD Will the Correction Continue or Will We See a Reversal?GOLD UPDATE – Will the Correction Continue or Will We See a Reversal?
📊 Market Analysis:
Yesterday’s sharp decline in gold prices indicates a temporary easing in geopolitical tensions, particularly the ongoing conflict and political issues. It seems that the global environment has become slightly less tense recently, which could be a key factor in the correction we are seeing in gold.
From a political and trade perspective, the current price trend appears rational, but it is important to note that nothing is set in stone just yet. Further negotiations are expected, and these could lead to significant agreements. After the sharp drop, gold has managed to find some momentum for recovery, filling liquidity gaps and returning to areas of lower liquidity.
🔍 Current Outlook:
At the moment, I’m still expecting a possible rebound in gold, but the best opportunity might be to focus on sell positions for the time being. Yesterday’s plan, although bearish, enabled us to catch key levels for potential buy entries. Today, sell entries might be more favorable than buying.
The price is likely to continue adjusting as we await more macroeconomic news, especially regarding the US Federal Reserve’s actions. We’ve seen the Fed avoid Trump’s pressure, and there is speculation that interest rate cuts might be postponed until later in the year rather than mid-year as previously expected. If this is the case, gold could potentially revisit the $3000/oz mark in the near future.
🔮 Short-Term Strategy:
For now, we will continue trading according to the market’s correction wave. Sell positions might offer a better risk-to-reward ratio in this environment. We may still see some bounces, but they would likely be short-lived unless we see more positive macroeconomic data.
💡 Key Resistance Levels:
3264
3278
3307
3328
💡 Key Support Levels:
3241
3207
3196
3172
3156
🎯 Trade Setup:
BUY SCALP:
Entry: 3196 – 3164
SL: 3190
TP: 3200 → 3204 → 3208 → 3212 → 3216 → 3220
BUY ZONE:
Entry: 3158 – 3156
SL: 3152
TP: 3162 → 3166 → 3170 → 3174 → 3178 → 3182 → 3190
SELL SCALP:
Entry: 3278 – 3280
SL: 3284
TP: 3274 → 3270 → 3266 → 3260 → 3250 → 3240
SELL ZONE:
Entry: 3328 – 3330
SL: 3334
TP: 3324 → 3320 → 3316 → 3312 → 3308 → 3300 → 3290 → 3280
📅 Key Event: CPI Announcement
Today, we are also expecting the CPI report, a critical piece of data for the month. Be aware that there’s not much to analyze yet regarding this report, but we will update everyone once the data comes out later today.
💼 Risk Management:
Given the volatility we’re seeing, proper risk management is essential. Stick to your TP/SL levels to protect your account and avoid unnecessary risks.
📈 Final Thoughts:
Gold is currently facing corrections, but with geopolitical tensions easing, it could lead to more stability and potential breakout opportunities. Keep your trades aligned with key levels and macro news. Keep an eye on CPI and adjust accordingly.
💬 Good luck to everyone! Keep your positions safe and be patient for the right opportunities.

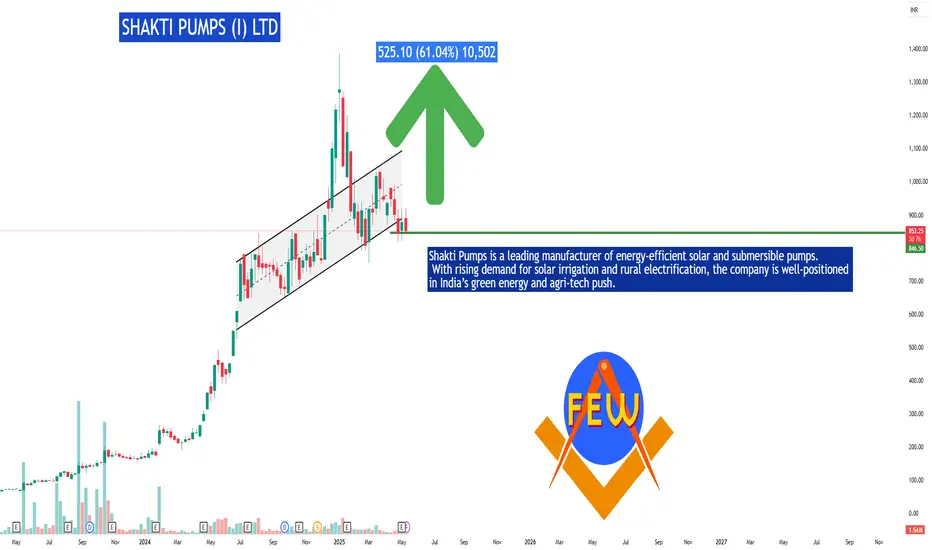
SHAKTI PUMPS (I) LTD #SHAKTIPUMP
Stock: Shakti Pumps (India)
Key Highlights:
CMP: *878.4
Target: 1,400 (61% Upside)
High-Growth Sector (Solar + Agri)
Attractive Valuation (P/E 25.9 vs peers)
Govt Policy Tailwinds (Renewable energy push)
Best for: Mid-term growth investors!
"XAUUSD at Critical Support – Bullish Continuation or Pullback 🔍 Market Overview
The chart shows a technical setup with clear support and resistance zones, alongside key Exponential Moving Averages (EMAs) to guide directional bias.
📊 Key Technical Levels
Resistance Zone: ~$3,445–$3,460
This is a historically reactive area where price has reversed sharply in the past. A breakout above this zone would suggest strong bullish continuation.
Strong Supporting Zone: ~$3,375–$3,390
Currently being tested. If the price holds here, it could act as a launchpad for a bullish move toward resistance.
Support Zone: ~$3,320–$3,340
If the strong support breaks, the next downside target would be this zone, which aligns with the 200 EMA (blue line) — a dynamic support level.
📈 Moving Averages
50 EMA (Red): Currently at $3,345.60, serving as a short-term dynamic support.
200 EMA (Blue): Currently at $3,304.13, marking a critical longer-term support. Price staying above this EMA reflects a bullish bias.
🔀 Probable Scenarios
Bullish Case (Preferred Scenario)
If price holds the strong supporting zone and breaks above current highs (~$3,395), it could rally toward the resistance zone at $3,445–$3,460.
Break and close above resistance may open the door for further upside continuation.
Bearish Case
A rejection from current levels or a break below $3,375 would likely lead to a retracement toward the support zone ($3,320–$3,340).
A break below the support zone and the 200 EMA would shift the structure into bearish territory.
✅ Bias & Recommendation
Current Bias: Cautiously Bullish
As long as the price remains above the strong supporting zone and 50 EMA, bulls have the upper hand.
Look for confirmation with a higher low or bullish engulfing candle before entering long.
Trade Idea:
Long Entry: On bullish confirmation above $3,395
Target: $3,445–$3,460
Stop Loss: Below $3,375 (support break)

GOLD PRICE PLUNGES ON WEEKLY OPEN RETRACEMENT OR NEW BEAR TREND?📉 GOLD PRICE PLUNGES ON WEEKLY OPEN – RETRACEMENT OR NEW BEAR TREND?
Gold started the week with a sharp gap down, breaking below key levels after weekend developments signaled easing geopolitical tensions and positive progress in US-China trade talks. This calm has dampened safe-haven demand, triggering an aggressive selloff in early Asian hours.
🔍 Technical Outlook – M30 Parallel Channel
Gold is currently respecting a descending parallel channel on the M30 chart. Price is pushing lower and has yet to fill the weekend’s gap around the 3326–3328 zone. This remains a critical Key Level for any potential short-term recovery.
🗓️ This Week’s Macro Focus
Traders should brace for high volatility as the US economic calendar is packed with top-tier releases:
Tuesday: CPI (Consumer Price Index)
Thursday: PPI (Producer Price Index)
Thursday Night: Fed Chair Powell speaks
Meanwhile, ongoing tariff policy updates and geopolitical headlines will continue to stir price action unpredictably.
📌 Trading Bias
For now, the dominant trend is bearish. Unless we see a strong bullish reversal pattern or key breakout confirmation, the preference remains selling on rallies. Only if buyers reclaim control around the gap zone (3326–3328) should we look for long setups.
🔺 Key Resistance Levels:
3288 – 3308 – 3328
🔻 Key Support Levels:
3262 – 3246 – 3236 – 3200
🎯 Trade Setups
🔵 BUY ZONE: 3246 – 3244
SL: 3240
TP: 3250 → 3254 → 3258 → 3262 → 3266 → 3270 → 3280
🔴 SELL ZONE: 3326 – 3328
SL: 3332
TP: 3322 → 3318 → 3314 → 3310 → 3305 → 3300
🔴 SELL SCALP: 3306 – 3308
SL: 3312
TP: 3300 → 3296 → 3290 → 3286 → 3282 → 3278 → 3270
⚠️ Final Thoughts
Gold remains highly reactive to macro news and liquidity traps, especially with so many risk events this week. Trade with caution, follow your TP/SL rules, and stay flexible with your strategy. The market may deliver unexpected volatility—manage your risk smartly.
🟡 Let price guide you — not emotions.
🚨 Stay disciplined. Stay profitable.

EURGBP (2H) Technical AnalysisPair: EUR/GBP
Timeframe: 2H (2-hour)
Bias: Bearish
Structure: Bear Flag / Descending Channel
Current Price: ~0.8456
📐 Chart Breakdown
1. Bearish Descending Channel
Price has been respecting a clear descending channel with lower highs and lower lows.
The current move is a bearish breakout below the channel support line.
This shows strong selling pressure.
2. Breakout & Retest Structure
A breakout has already occurred, and price is now attempting to retest the broken support (which is now acting as resistance).
This is a textbook bearish continuation setup.
3. Key Supply Zone: 0.8485–0.8495
There's a strong supply zone above, confirmed by multiple rejections and wicks.
This acts as an ideal stop-loss zone.
4. Clean Target Zone (Demand): 0.8320–0.8375
A wide demand zone is seen around 0.8320–0.8375.
Previous bullish impulsive move originated from this area.
Perfect level to take profit as buyers may return here.
🧾 Trade Plan – Short Setup
Entry Stop Loss Take Profit Risk:Reward
0.8450–0.8465 (retest area) 0.8495 (above supply) 0.8375 (or partial at 0.8400) 1:2.5 to 1:3+
✅ Confluences Supporting the Bearish Setup
Confluence Details
✅ Descending Channel Market consistently making lower highs and lows.
✅ Breakout + Retest Price broke structure and is retesting the neckline.
✅ Supply Zone Above Perfect invalidation level at 0.8495.
✅ Momentum Shift Clean bearish candles and lack of bullish follow-through.
✅ Wide Clean Target Area 0.8320–0.8375 demand area visible and untested.
🚫 Invalidation
If price closes above 0.8495, bearish setup is invalid.
A strong bullish engulfing from here may signal a reversal back into the channel.
📊 Trade Management Tips
Aggressive Entry: Enter at 0.8455–0.8465 (current retest zone).
Conservative Entry: Wait for rejection candle (bearish engulfing or pin bar).
Trail SL after hitting 1:1.
Partial TP at 0.8400, final at 0.8375–0.8320.

ETHUSD 1D (Daily) chart: Long Setup🔍 Chart Overview
Asset: Ethereum / US Dollar (ETHUSD)
Timeframe: 1D
Pattern: Bullish Breakout from a Falling Channel
Bias: Strong bullish reversal in progress
Current Price: ~$2,414.80
Major Resistance Zone: ~$3,800–$4,000
Key Support Zones: ~$2,000 and ~$1,510
📈 Technical Breakdown
1. Falling Channel Breakout (Reversal Signal)
ETH had been trading in a downward-sloping channel since late 2024.
Recently broke above the descending channel with a large bullish candle.
This breakout indicates the end of the bearish trend and start of a potential long-term bullish phase.
✅ Classic bullish reversal signal with volume spike.
2. Strong Bullish Impulse
After the breakout, ETH created a powerful bullish impulse candle with almost no upper wick.
Indicates aggressive buyer momentum.
Price is now above multiple key resistance levels (now turned to support).
3. Key Demand Zones (Support)
Zone Description
~$2,018 Retest zone from structure + previous consolidation
~$1,510 Major historical support, origin of last major rally
If ETH pulls back, $2,018 zone is ideal for re-entry, as it's the most probable demand zone buyers may defend.
Second option for long-term reaccumulation is around $1,510 if a deeper correction occurs.
4. Bullish Rejection + Projection Path
The chart shows two possible bullish paths drawn with arrows:
One is a shallow pullback into the $2,000–$2,200 zone before rallying higher.
The second shows a deeper retest into the lower demand before heading up.
Both reflect valid bullish continuation setups.
🎯 Target Zone
Target Area: ~$3,800 to ~$4,000
This zone aligns with:
Previous high resistance
Liquidity pool / order block from last major drop
Psychological round number
📌 Ideal area to take profit or start reducing exposure on swing positions.
🧠 Confluences for Bullish Bias
Confluence Description
Break of falling channel ✅ Strong trend reversal signal
Clean bullish engulfing candle ✅ High momentum confirmation
Price broke structure highs ✅ Market structure shifted bullish
Retest zones clearly defined ✅ Logical risk-managed entries
Major resistance ahead ⚠️ Profit-taking zone (plan ahead)
🛠️ Possible Trading Plan
Option 1 – Aggressive Entry (Now)
Enter after breakout confirmation
SL below $2,000 (structure)
TP at $3,800–$4,000
RRR: ~1:3+
Option 2 – Conservative Entry (Retest)
Wait for pullback to $2,000–$2,100
SL below $1,900
TP at $3,800–$4,000
RRR: ~1:4 or higher
🚩 Caution Points
If ETH drops below $2,000 and closes below the demand zone, bullish setup weakens.
If Bitcoin drops sharply, it can drag ETH down too — watch BTC for confirmation.
Always manage risk — avoid FOMO entries after a strong impulse move.
✅ Conclusion
This is a textbook bullish reversal with a clear falling channel breakout, strong momentum, and well-defined support zones. Two bullish projections show smart trading ideas, and the ultimate target around $3,800–$4,000 is logical.

BTC/USD – Daily Trade Plan | 10 May 2025🟢 BTC/USD – Daily Trade Plan | 10 May 2025
"Breakout Incoming? Price Coiling Tighter Near Key Resistance!"
🔍 Market Overview:
Bitcoin has shown strong upward momentum after breaking past the $99,000 mark, reaching a short-term high at $104,269.47. Since then, price has consolidated within a narrowing range. The daily structure remains bullish, but short-term selling pressure is visible — especially ahead of the weekend and macro uncertainty.
🧭 Technical Landscape:
🔺 Resistance Zones:
$104,269.47 – Local top, price has failed to break this level several times.
$105,765 – $106,917 – Previous rejection zone + Fibonacci confluence.
$108,045 – Possible extension target if breakout confirms.
🔻 Support Zones:
$102,301 – Immediate intraday support; likely first retest.
$99,379 – Strong mid-range support, aligned with Moving Average & FVG.
$97,093 – Long-term trendline & high-demand zone.
📊 Scenario 1: Bullish Breakout Continuation
If BTC holds above $102,300 and breaks H4 resistance:
🔵 Buy Entry: $102,500 – $102,300
🎯 Targets: $104,000 → $105,700 → $106,900 → $108,000
🛑 Stop Loss: $101,800
📉 Scenario 2: Liquidity Grab & Deep Pullback
If BTC loses $102,300 support, expect a move to collect liquidity around $99K:
🔵 Buy Entry: $97,200 – $97,000
🎯 Targets: $99,000 → $101,000 → $102,500
🛑 Stop Loss: $96,400
⚠️ Key Market Considerations:
🧊 DXY Recovery: Short-term USD strength may cap BTC upside.
🏦 Fed Policy Tone: Remains hawkish. Any USD volatility can shift crypto sentiment.
🔼 Long-Term Trend: Still bullish. Focus on buy-the-dip setups rather than chasing highs.
📝 Final Thoughts:
Bitcoin is entering a coiled zone, awaiting high-volume confirmation. Breakouts or sharp rejections from the current range will decide the next leg.
🚀 Stay patient — Wait for clean candle closes (H4 preferred)
🔒 Stick to your SL/TP — Discipline defines success
💡 Avoid mid-range FOMO. Let price tell the story.

AUDNZD 2H Chart Analysis – Trendline Break + Supply Zone Rejecti🧾 Market Context:
Pair: AUDNZD
Timeframe: 2H (2-Hour)
Overall Bias: Bearish
Setup Type: Trendline Break → Lower High Formation → Supply Zone Retest → Bearish Continuation
📊 Technical Breakdown:
🔸 1. Trendline Break:
A steep ascending trendline has been broken decisively, marking a clear end of bullish structure.
This shift indicates that buyers have lost control and bears are stepping in.
🔸 2. Retest of Supply Zone (Breaker Block):
After breaking the trendline, price retraced into a supply zone (highlighted in grey).
This zone also acts as a breaker block – price broke support, and now it’s acting as resistance.
Rejection from this area confirms institutional selling pressure.
🔸 3. Lower High Formation:
The price failed to break back above the supply zone, forming a lower high, which is a classic bearish market structure signal.
Trendline retest + supply zone rejection together give confluence.
🔸 4. Bearish Projection Path:
Your chart outlines a clear path of expected price movement:
Minor bounce from intermediate demand (1.0780–1.0790)
Continuation downward toward final target zone at 1.0650–1.0660
🔽 Entry & Trade Plan:
Parameter Details
Entry Area 1.0820 – 1.0840 (confirmed rejection)
Stop Loss Above 1.0855 (above the supply zone high)
Target 1 1.0770 – 1.0780 (intermediate demand zone)
Target 2 1.0650 – 1.0660 (major demand zone)
RR Ratio Around 1:3 to 1:4 depending on entry
✅ Bearish Confluences:
✅ Trendline break + retest
✅ Supply zone rejection
✅ Lower high formation
✅ Bearish engulfing candle post-retest
✅ Clear break of structure (BOS)
✅ Liquidity sweep above previous high before dumping
⚠️ Invalidation Criteria:
If price closes above 1.0855 on a 2H/4H candle, it invalidates the bearish setup.
In that case, reanalyze for potential continuation or false breakout.
📈 Visualization Path:
🔹 Current price is consolidating slightly below the retest zone.
🔹 You anticipate a drop to intermediate support, possible small bounce, then continuation to major target.
🧠 Professional Summary:
This is a textbook bearish trend reversal setup:
Break of bullish trendline
Supply zone retest and rejection
Structure shift to lower lows/lower highs
Bearish order flow developing
If momentum follows through, your TP at 1.0650 is very realistic.

Gold Plunges from 3435 After China Rate Cut FOMC Storm Incoming?Gold Plunges from 3435 After China Rate Cut – FOMC Storm Incoming?
📅 May 7, 2025 | XAU/USD Intraday Outlook
Gold faced a sharp decline in early sessions today, dropping nearly 800 PIPS from 3,435 down to the 3,36x range. While the fall appeared aggressive, the macro backdrop may provide clues — especially ahead of tonight's high-stakes FOMC meeting.
🔍 What Triggered the Sell-off?
1️⃣ China Cuts Rates by 10bps Unexpectedly:
Just ahead of U.S.–China trade talks, China slashed its benchmark interest rate by 10bps. While the move supports Chinese markets, it also boosts the U.S. Dollar (DXY), creating headwinds for gold.
2️⃣ Investors Awaiting FOMC Clarity:
Traders are hesitant to buy gold near recent highs, especially with the Fed expected to signal rate direction tonight. There’s growing speculation that today's events are part of a broader setup for potential Fed easing.
3️⃣ Geopolitical Tensions Not Helping Gold – Yet:
Despite renewed tensions between India and Pakistan, and a volatile global climate, gold hasn't responded bullishly — a sign that technicals and macro shifts are temporarily outweighing news-based fear.
📈 Technical Analysis – Dual Scenarios in Play
Gold is now moving in a wide, volatile range. Liquidity grabs at both ends are likely, and traders should adopt a flexible, confirmation-based approach rather than sticking to one directional bias.
🔺 Key Resistance Zones:
3,390
3,402
3,416
3,432
3,444
3,468
🔻 Key Support Zones:
3,365
3,356
3,332
3,314
🎯 Trade Plan – May 7, 2025 (Pre-FOMC Strategy)
🔵 BUY SCALP
• Entry: 3,355
• SL: 3,350
• TP: 3,360 → 3,364 → 3,368 → 3,372 → 3,376 → 3,380
🔵 BUY ZONE
• Entry: 3,332 – 3,330
• SL: 3,326
• TP: 3,336 → 3,340 → 3,344 → 3,348 → 3,352 → 3,358 → 3,365
📌 KEY BUY LEVEL to Watch:
→ 3,314 – 3,312
⚠️ This is a critical Fibonacci zone. If broken, trend structure may be compromised. Use wide SL (~6 PIPS) with open TP structure.
🔴 SELL SCALP
• Entry: 3,430 – 3,432
• SL: 3,436
• TP: 3,425 → 3,420 → 3,415 → 3,410 → 3,400
🔴 SELL ZONE
• Entry: 3,468 – 3,470
• SL: 3,474
• TP: 3,464 → 3,460 → 3,455 → 3,450 → 3,445 → 3,440 → 3,430
⚠️ Final Thoughts:
Today’s FOMC statement will likely dominate market direction for the rest of the week. Volatility is expected to increase sharply. With both macro and geopolitical catalysts in play, risk management is non-negotiable.
🔐 Stick to key zones. Avoid trading the news blindly. Wait for price action confirmation — and remember: capital protection beats every setup.
📌 Follow this post to get real-time updates after FOMC and new breakout zones for Thursday.
