How will the golden new week be from 10-14/11?📉 H4 Analysis (Trendline, Support & Resistance)
Structure:
The price is currently moving within an upward channel.
Trendline:
Upper red trendline: Acting as dynamic resistance.
Lower red trendline: Current support, from where the price has bounced several times.
🧭 Fibonacci Levels:
0.5 = 4,130
0.618 = 4,188
→ This zone (4,180 – 4,200) is the key resistance zone.
💎 Key Levels:
Resistance: 4,180 – 4,200
(Fibo 0.618 + Previous Swing High)
Support: 3,890 – 3,920
(Previous Base + Bottom of Channel)
⚔️ Possible Scenarios:
If the price stays above 4,000 → Bullish move may continue, target 4,180–4,200.
If the price falls below 3,970 → Bearish breakdown, target 3,890 support zone.
📊 In Summary:
🔺 Resistance: 4,180 – 4,200
🔻 Support: 3,920 – 3,890
⚡ Trend: Mildly bullish, but strong resistance exists at 4,200.
SELL GOLD: 4195 – 4200
Stoploss: 4210
Take profit: 100-300-500pips
BUY GOLD: 3885 – 3890
Stoploss: 3970
Take profit: 100-300-500pips
Analysischart

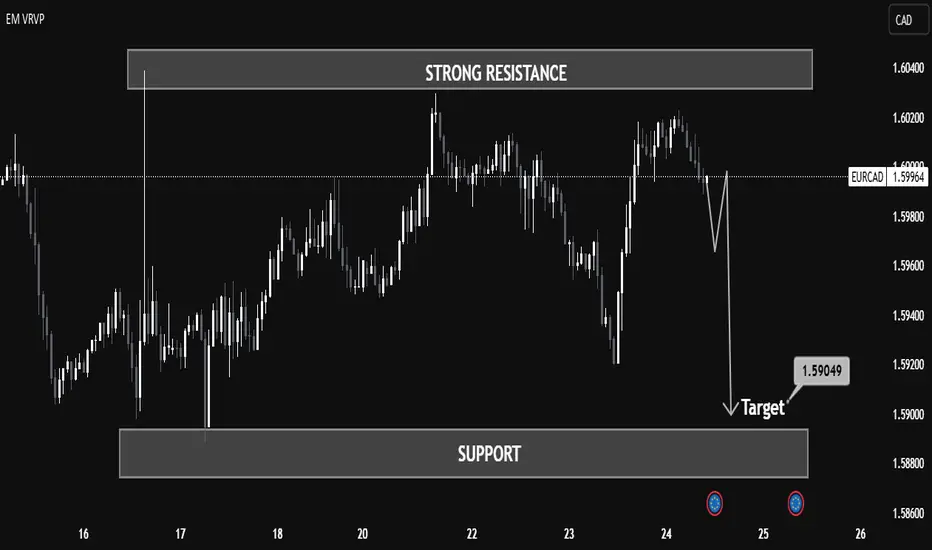
EURCAD Technical Analysis – Bearish Reversal from Resistance 📉 EURCAD Technical Analysis – Bearish Reversal from Resistance Zone
(Timeframe: Intraday – as of July 24, 2025)
🔍 Market Context
The EURCAD pair has recently tested a strong resistance zone around the 1.60200 – 1.60400 level, where it faced clear rejection, forming a sharp bearish move.
🔸 Key Technical Zones
Resistance Area: 1.60200 – 1.60400
A well-established zone that has previously rejected price. Price was unable to sustain above this level, confirming supply pressure.
Support Area: 1.58600 – 1.58800
This is a previously tested demand zone, which now acts as a key target and potential bounce area if the bearish move continues.
Target Level Marked: 1.59049
A mid-point level just above the support zone, possibly an early TP (Take Profit) area for short sellers.
🔄 Price Action
Price formed a lower high just below the resistance, indicating weakening bullish momentum.
The recent strong bearish candle confirms momentum shift to the downside.
A bearish continuation pattern appears likely, especially with the forecast path suggesting a pullback followed by a drop toward 1.59049.
📊 Volume Profile (VRVP)
Low volume acceptance between 1.59400 – 1.59000 supports the idea of fast price movement through this region — called a volume gap.
Strong volume concentration near support, indicating that buyers may become active near 1.58800 again.
🔧 Conclusion
The EURCAD pair has shown clear rejection from a major resistance zone, and the chart suggests a bearish continuation targeting the 1.59049 level and possibly lower into the support zone.
Traders may look for confirmation such as:
Pullback retest of 1.59800–1.59900
Bearish engulfing or continuation candle
Failure to break above recent highs
Risk management is crucial — invalidation would occur on a strong close above 1.60400.
📚 Educational Title Suggestion
"Resistance Rejection & Momentum Shift: EURCAD Bearish Setup Breakdown"
NZD/USD Technical Analysis 🧠 NZD/USD Technical Analysis | Smart Money Perspective
Currently, the NZD/USD pair is trading around 0.5960, positioned between a well-defined resistance zone (0.6130–0.6150) and a support zone (0.5890–0.5900).
Here are the key technical aspects to note:
🔹 1. Liquidity Sweep
The price recently dipped below the previous swing low near 0.5900, tapping into a pool of sell-side liquidity. This move is typically seen as a liquidity grab, where institutional players push the price to trigger retail stop losses before reversing direction.
🔹 2. Double Bottom Formation
The chart suggests a potential double bottom forming at the support level — a classic sign of accumulation. This pattern indicates buyers may be coming in after liquidity has been cleared, expecting a reversal.
🔹 3. Fair Value Gap (FVG)
A Fair Value Gap, or imbalance, is visible between 0.5985 and 0.6015. This gap was created due to a sharp bearish move, leaving price action unbalanced. The price is now likely to retrace into this area to rebalance orders, which is typical smart money behaviour.
🔹 4. Market Structure Outlook
If the double bottom confirms with a bullish break of structure above 0.5980, we could see a continuation towards:
- First Target: FVG zone around 0.6015
- Second Target: Major resistance near 0.6150, where past distribution occurred
✅ Conclusion
This setup integrates key smart money concepts:
- Liquidity grab below support
- Accumulation phase at demand
- FVG as a target
- Potential bullish shift in market structure
Traders should keep a close watch on price action around the support zone for confirmation, such as a bullish engulfing candle or a break of recent short-term highs, before taking long positions. Targets remain at the FVG and resistance zones; however, sound risk management is crucial in case of a deeper sweep or any macroeconomic developments.

HERITAGE FOODS (LONG TERMVIEW)Trendline Breakout With Retest
Big Bar Breakout
Proper Retest
20-30% Upside Potential
Till Then Stay Focused

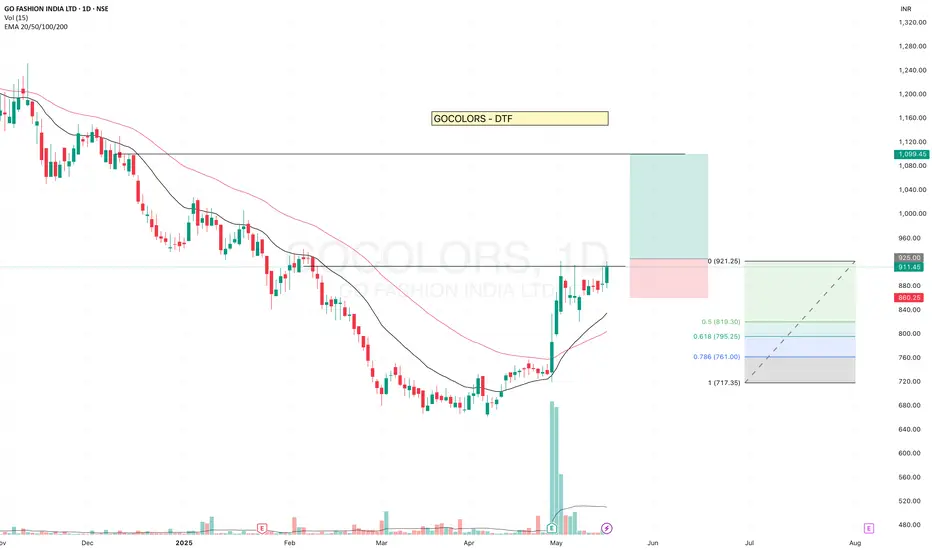
GOCOLORS - Getting ReadyGOCOLORS is getting ready and has been testing the resistance level.
- It is consistently trading above the 20 EMA. Recent high-volume candles suggest clear institutional participation. Although volume is currently drying up, the price is sustaining — a positive sign.
- The stock reversed after touching the 0.5 Fibonacci retracement level, indicating strength.
✅ If you like my analysis, please follow me as a token of appreciation :)
in.tradingview.com/u/SatpalS/
📌 For learning and educational purposes only, not a recommendation. Please consult your financial advisor before investing.
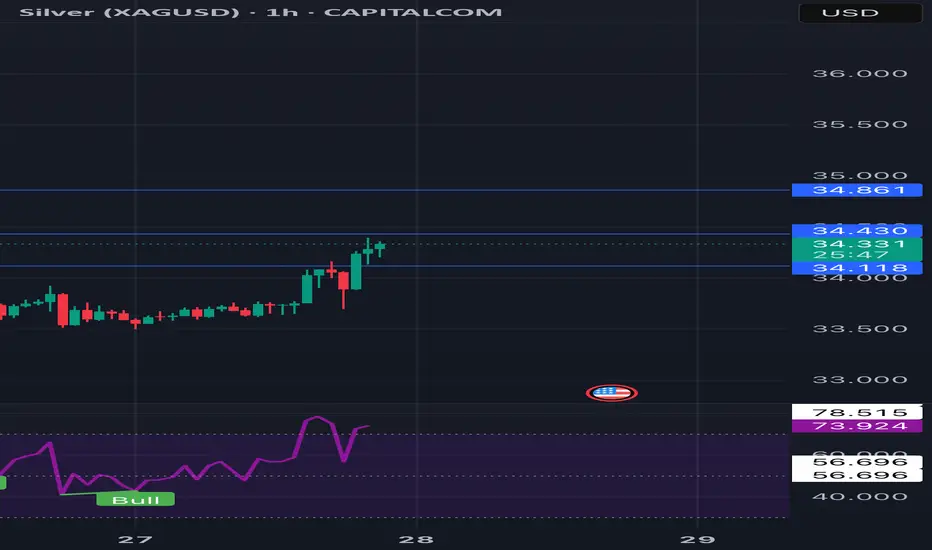
Silver Price Alert: Is XAG/USD Headed for $34.108? Learn Why!"Join us for an educational session on XAG/USD as we analyze key market trends and technical signals pointing to a potential drop toward $34.108. Understand the factors driving gold prices and gain insights to improve your trading strategy!
#chartanalysis
#xagusd
#trendanalysis
XAUUSD Full Analysis 3010 – Recent low; if broken, gold may revisit lower levels.
3000 – Psychological support a critical level for buyers to defend.
However, the strong sell-off broke key support levels, indicating short-term weakness
The market is at a critical zone. Watch for a breakout or rejection at 3028 to determine the next move
The market was in an uptrend before forming lower highs and lower lows, indicating a shift in structure to bearish
Supply Zone Bearish Order Block 3028-3032 If price revisits this zone, it could reject downward
Demand Zone; $3008 - $3012 If price tests this zone, a potential bullish reaction may occur
Watch for liquidity grabs and rejection candles in supply/demand zones for trade confirmation

Axis Bank Simple Trend Analysis!!AB can bounce from 1169 to 1189 in coming days and Ab has broken daily & weekily resistance trendline and also retested at the end on the day.
May a bounce can come if open above weekly trendline (1170) or gap up. if not another buying oppurtunity is will be at 1144 where both daily n weekly are intersecting.

Morgan Stanley: Triangle Pattern Target is 132 USD, Gain +23%At Morgan Stanley, a triangle pattern has formed, and there was a breakout above the pattern. There’s still a chance to gain a +23% profit, with a target of 132 USD.

Real Reason of gold spike by 18 $ pre USA news release.As the news broke out by American new agencies, that Iran might be planning to strike down ISRAEL with ballistic missile, this led to investor hussle and seek either hedge their investments or seek alternative investments rather than being invested in dollars.
Also NFP strikes up coming friday... so we need to keep our buy positions in line with current development. currently Gold is very high, so we need to wait for gold for seek a v shape depth fall and we should seek buying at lower lows.
Gold clinched its third consecutive week of gains, reaching a fresh all-time high on Thursday.
If bullish momentum persists, immediately to the upside emerges the $2,700 mark.
Fed rate cut bets, geopolitical tensions continue to support the yellow metal.
Gold (XAU/USD) extended its positive performance this week, hitting all-time tops in levels just shy of the $2,700 mark per ounce troy on Thursday.
The rally in the precious metal remained propped up by, firstly, steady expectations of extra interest rate reductions by the Federal Reserve (Fed) in the upcoming couple of meetings and well into 2025, and secondly, incessant geopolitical concerns stemming mainly from the Middle East, while the Russia-Ukraine conflict also adds to the matter.
Last but not least, contributing to the uptrend in bullion, also emerged the equally persevering offered stance of the US Dollar (USD).
Next on tap… $3,000?
As the US Dollar approaches its third consecutive week of losses, Gold prices are set to mark their third straight week of gains.
Since late June, traders have continued to shift towards the non-yielding metal pari passu growing expectations of Fed interest rate cuts, which culminated in a significant 50-basis-point (bps) reduction at the Fed’s meeting on September 18.
However, market participants did not seem quite satisfied with the Fed's outsized move. That said, investors still expect around 75 bps of easing by the central bank for the remainder of the year, according to the CME FedWatch tool.
Looking at the longer run, investors expect between 100 and 125 bps of interest rate reductions by the end of 2025.
Against this backdrop, it is not surprising that the yellow metal could have already embarked on a probable visit to the key $3,000 level, which will apparently hit sooner rather than later. However, the current overbought market conditions might call for some common sense, allowing some short-term corrective decline.
At this point, and in light of the strong rally observed in Gold prices, a “purge” would be more than welcomed by those afraid of entering the market at current levels, at the same time giving another chance to those part of the fear of missing out (FOMO) space.
Geopolitical effervescence continues to support the uptrend
Another driver of the important move higher in the precious metal is the unabated geopolitical jitters surrounding the Israel-Hamas crisis, as well as the Russia-Ukraine conflict, which will likely enter its third year in February.
The flight-to-safety adage comes to the fore every time news hits the wires about the deterioration of any of these scenarios, which unfortunately do not appear to be over any time soon.
And the US Dollar?
The Greenback has been on a firm bearish leg since July, accompanied by increasing speculation of extra monetary policy easing by the Fed. Now that the central bank has started its rate cut cycle, and with inflation kind of firmly navigating towards the 2% target, hopes for a sustained recovery of the US Dollar seem to dim on a daily basis, at least in the near future.
Gold technical outlook
As we mentioned above, Gold’s current overbought conditions, as per the daily RSI around 75, leave the door open for a near-term correction.
However, the constructive outlook appears to be everything but abated. That said, there is an immediate up-barrier at the record peak of $2,685 (Thursday’s high) and the round-level of $2,700. Once this level is surpassed, the Fibonacci extensions of the 2024 uptrend emerge at $2,876, seconded by $2,975 and then $3,119.
Let’s say sellers regain some initiative. In this scenario, there is an initial contention at the weekly low of $2,546 (September 18), which comes ahead of the September low of $2,471 (September 4) and precedes the transitory 100-day SMA at $2,428.
From a technical perspective, the metal’s positive outlook should remain unchanged as long as it trades above the key 200-day SMA at $2,288.
Economic Indicator
Nonfarm Payrolls
The Nonfarm Payrolls release presents the number of new jobs created in the US during the previous month in all non-agricultural businesses; it is released by the US Bureau of Labor Statistics (BLS). The monthly changes in payrolls can be extremely volatile. The number is also subject to strong reviews, which can also trigger volatility in the Forex board. Generally speaking, a high reading is seen as bullish for the US Dollar (USD), while a low reading is seen as bearish, although previous months' reviews and the Unemployment Rate are as relevant as the headline figure. The market's reaction, therefore, depends on how the market assesses all the data contained in the BLS report as a whole.
Next release: Fri Oct 04, 2024 12:30
Frequency: Monthly
Consensus: 145K
Previous: 142K
Source: US Bureau of Labor Statistics

Silver Futures: Navigating the Bullish Breakout
The Silver Futures chart presents a compelling picture, but as we know, navigating the market demands more than just technical analysis. Let's break down what we see:
Bullish Signals: The decisive breakout above the VWAP, coupled with the series of green Heikin Ashi candles, paints a bullish picture. The recent breach of the Base Camp level further strengthens this positive outlook.
VWAP as a Guide: The VWAP is now acting as dynamic support, offering potential buying opportunities on dips. However, remember that even in a bullish scenario, the market can be unpredictable.
Beyond the Chart: While technicals are promising, external factors can sway silver prices. Keep an eye on global economic indicators, geopolitical tensions, and any news that might impact precious metals.
Applying the Wisdom:
Don't Get Complacent: Even with a bullish setup, risk management is paramount. Set stop-losses to protect your capital in case of unexpected reversals.
Stay Informed: Technical analysis is valuable, but it's only one piece of the puzzle. Stay updated on fundamental factors that can influence silver's price trajectory.
Avoid Blind Faith in Tips: This bullish setup might attract stock tips, but remember, no one can predict the market with certainty. Do your own research and make informed decisions.
In Conclusion:
The Silver Futures chart is signaling a potential bullish trend. However, successful trading involves more than just following signals. Combine technical analysis with a keen understanding of market dynamics, risk management, and a healthy dose of skepticism towards "hot tips." This approach will increase your chances of navigating the market successfully, even when faced with its inherent unpredictability.
Disclaimer: This is an analysis, not financial advice. Trading involves risk; conduct your own research and consider your risk tolerance before making any investment decisions

Sector-Based Analysis: Navigating Today's Market DynamicsTo complement my earlier NIFTY analysis, let's dive into the key sectors and their potential impact on today's market movement. Here’s a quick breakdown of the major indices to watch and how they could influence NIFTY's direction:
1. Banking Sector (BANKNIFTY):
Current Level: 51,383.95 (+32.95, +0.06%)
Analysis: The banking sector remains mildly positive today, reflecting stability in major financial stocks. Any sustained upward move in BANKNIFTY above 51,400 could provide additional momentum to NIFTY. However, if BANKNIFTY fails to hold above the 51,300 support level, it may trigger some selling pressure on NIFTY as well.
2. Financial Services (CNXFIN):
Current Level: 26,706.65 (+68.75, +0.29%)
Analysis: The financial services index is showing resilience with a modest uptick. A positive performance in this sector often signals broader market strength. The continuation of buying interest in this index above 26,700 would support a bullish view for NIFTY.
3. Information Technology (CNXIT):
Current Level: 42,940.00 (+152.40, +0.36%)
Analysis: CNXIT is gaining momentum and is a key driver today. Tech stocks are often considered safer bets, and a rally in this sector could act as a strong tailwind for NIFTY. Watch for a breakout above 43,000 for further bullish confirmation.
4. Auto Sector (CNXAUTO):
Current Level: 32,073.60 (-98.90, -0.31%)
Analysis: The auto sector is underperforming, with notable weakness visible in several major auto stocks. If CNXAUTO continues to decline, it could create a drag on NIFTY, particularly if other sectors also show signs of fatigue.
5. FMCG (CNXFMCG):
Current Level: 66,739.70 (+609.95, +0.95%)
Analysis: The FMCG sector is exhibiting strong buying interest and is currently one of the best-performing sectors. Positive movement here might help sustain NIFTY's overall sentiment, especially if consumer demand trends remain favorable.
6. Metals (CNXMET):
Current Level: 23,947.05 (-35.90, -0.15%)
Analysis: The metal sector is seeing some selling pressure today, possibly due to profit booking after recent gains. Any further downside in CNXMET could weigh on market sentiment, but if it stabilizes above 23,900, it might not have a significant negative impact on NIFTY.
7. Pharma (CNXPHARMA):
Current Level: 23,181.70 (-35.90, -0.15%)
Analysis: Pharma is relatively flat today. The sector's lack of direction indicates uncertainty among investors. However, if it stays above the 23,150 level, it may provide some support to the overall market.
Sector-Wise Conclusion:
The Banking, Financial Services, and FMCG sectors are showing positive momentum and are crucial to driving NIFTY higher today.
Auto and Metal sectors are underperforming; however, their impact might be mitigated if strength in other sectors persists.
Keep a close watch on CNXIT and BANKNIFTY for further clues on market direction. A strong performance in these sectors could be the catalyst needed for NIFTY to break its current resistance.
What to Watch Today:
A sustained uptrend in BANKNIFTY and CNXIT will be critical for a bullish continuation.
Any significant weakness in Auto or Metals could be a red flag for potential profit booking in NIFTY.
Monitor the FMCG sector closely; its outperformance could provide stability to the broader market.

ATGL underrated stock to BUYbuy this stock if it break the resistance or come to support level (1067) again.
With Modi3.0 it is unlikely to come back. Its better to invest now for long term at least 4 years to triple the investment.

CrudeOil Analysis for very short term Hello Friends,
this is quick analysis for #crudeoil.
as we can see crudeoil is trending in range so it seems to fall in one or two days so based on this channel we can plan short option PE position.
I am not giving direct idea to buy this option but do your own analysis based on other data as well then take your risk.
Its my view for this #crudeoil swing option trading for commodities.
Best of luck
Regards,

Opinion: NTPC - 400 MarkNSE:NTPC gains traction over a past few months. Company tends to improve the energy generation process and also exploring clean energy generation. For long term, NTPC holds value and growth potential - Energy demand for future will rise by considering consequent heat wave across India due to global warming effect. Also expansion of Industries, extra luxury celebrations, parties will add benefits to Energy production companies.
* NTPC is a Top Indian Independent energy producer, with 25% of total market share of entire energy sectors.
Trading Setup:
* NTPC - May trade with the range of Rs.300 - Rs 400.
My Reasons- After it crosses Rs.220 Mark, Volume starts to build up. So, current negative sentiment as of 28/Apr/2024 - put fear in overall market but NTPC holds with the range of 300-400. Breaking 300 is also a buying opportunity for every drops. Holding negative position can compensated through its high dividends. But I'm Long on NTPC which would break the upside 400.

RELIANCE INDS - INDIADaily chart.
Detection of a double TOP, with height reporting.
The target would be the 50% Fibonacci.
Make up your mind before placing an order.
► Please boost, comment, subscribe!

WIPRO AnalysisThe recent change in the management of WIPRO Ltd has brought a nice 56 Inch wide smile on Veterans who've been tracking the stock.
The CEO under whom, the profitability had reduced, has resigns and in exchange for him, we're finally getting someone who understands the Business and the Company.
I'm anticipating good moves in the stock from CMP.
Here are the details-
CMP- 486
Targets- 500, 520
Stoplsos- 476
Duration- 1-2 weeks
Let me know what you think about it.

FASP levels for Nifty 01/03/2024The FASP for Nifty is listed for 01-03-2024. You can add this levels to your trade setup for better results. This should not be the only indicator but an additional tool to increase your winning possibilities.
What is Fibolysis Anchor SupRes Points(FASP)?
It is a unique level arrived by using Fibonacci Retracement , Fibonacci Extension , Standard Pivot levels under various Timeframes. It is an extensively analyzed level to draw the support and resistance levels for the next day. You can use these levels along with your trade setup to increase your winning odds.
Validity of the levels: 1 Day
How to use these levels?
The three levels on both sides are usually easily achievable. The Targets above are bit difficult to achieve in a single trading session. I use this fact to write intraday positions and to buy options.
Color Coding: Green is regular support and buying area, Red is strong exit area
Disclaimer: This is shared in the interest of educational purpose and for knowledge enhancement. Kindly refer it in the same light. I am not responsible for any profits or loss incurred based on this information.

FASP levels for Bank Nifty 01/03/2024The FASP for BankNifty is listed for 01-03-2024. You can add this levels to your trade setup for better results. This should not be the only indicator but an additional tool to increase your winning possibilities.
What is Fibolysis Anchor SupRes Points(FASP)?
It is a unique level arrived by using Fibonacci Retracement , Fibonacci Extension , Standard Pivot levels under various Timeframes. It is an extensively analyzed level to draw the support and resistance levels for the next day. You can use these levels along with your trade setup to increase your winning odds.
Validity of the levels: 1 Day
How to use these levels?
The three levels on both sides are usually easily achievable. The Targets above are bit difficult to achieve in a single trading session. I use this fact to write intraday positions and to buy options.
Color Coding: Green is regular support and buying area, Red is strong exit area
Disclaimer: This is shared in the interest of educational purpose and for knowledge enhancement. Kindly refer it in the same light. I am not responsible for any profits or loss incurred based on this information.

Banknifty March Outlook: Major Support, Resistance & TargetsGreat to see the volatility in the market once again! The major support, resistance and targets are posted here using Fibonacci Tools and other technical analysis.
Watch out for these levels and do post your comments

CANFINHOME (Ready For 1000)CANFINHOME has given a trendline breakout on the daily chart. The level of 900, 950, 1000, and 1100 could be achieved in the coming few days. The stop loss can be placed at the low of the current candle (2nd Feb), which is at 799 level.
Disclaimer: I am not a SEBI registered analyst. All the stocks are for educational purposes. Investors must consult a financial advisor before making any investment. It is not a buy or sell recommendation.

How to make position on BankNifty on 5th Dec - Trade AnalysisMarket open at 53 point high after create a red candle in 15 min. First 45 min price consolidate near resistance. after that a big red candle and a good down move we can see till 14:15.
Why breakdown why not breakout ?
If we can see from 4th January's 12 pm see green candle's volume is decreasing but price is increasing.
Here Red candle's volume is increasing.
MACD indicate bearish divergency in 15 min.
If we can see OI data Here we can see CE writing is increasing and PE writer exiting there position.
If we can see future chart here clearly indicate squire off future position also after 10.42. (Getting More Confirmation) .
All This combination indicate a short covering is coming in market. That's all.
After Taking trade when you have to book profit?
You can see a trend line . when ever price touch or near about trendline you can book your position.
How can I take position when up move come ?
See after a downfall when price increase and cross the trendline (Orange color).After that you can a long position till resistance (48178) . That's all.
Remember one things we have to follow our risk management and believe in price nothing else.

Simple Bank Nifty Analysis!Buyers Showing strength but still facing Resistance at 43700 to 43800. If sustain above 43850 then good move is expected or a gap up opening.
Trendline Support at 43650 to 43680
Key level 43580 keep eyes on it if trade below then may sellers gets active more.
BN made a V shaped recovery from last fall but very slowpace then selling.
Note : Do your own analysis before making any trade or investment.
