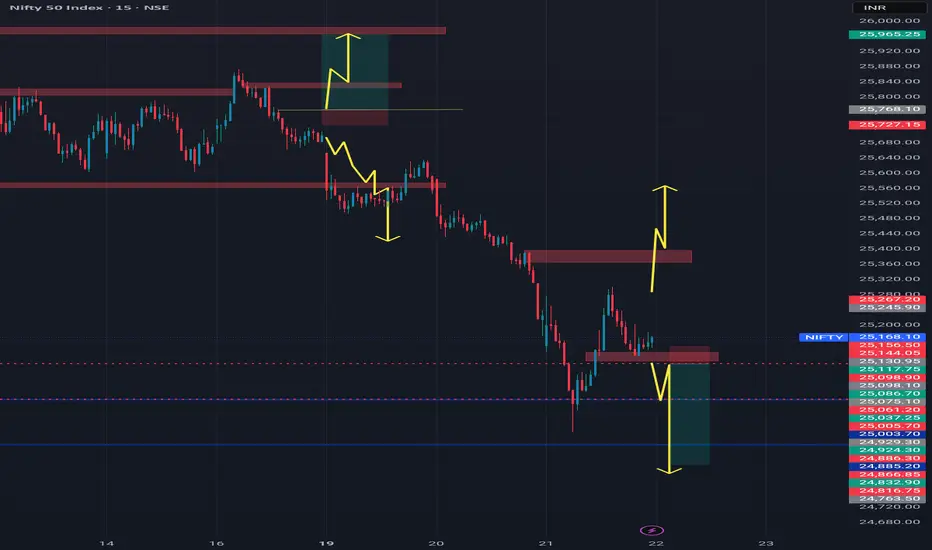
NiftyNifty has attempted multiple recoveries after the fall, consistently taking support near the 25100 level. If the index opens with a gap down below 25100 and forms a strong bearish candle, a further downside move towards 24750 can be expected. A bullish move is likely only after a decisive break above 25400. Until then price action remain sideways within the 25300-25100 range.
AND
Part 2 How to Draw Accurate Support and Resistance LevelsParticipants in Option Trading
There are four primary participants in the options market:
Buyer of Call Option (Long Call) – Expects the price to rise.
Seller of Call Option (Short Call) – Expects the price to fall or remain flat.
Buyer of Put Option (Long Put) – Expects the price to fall.
Seller of Put Option (Short Put) – Expects the price to rise or remain flat.
Each participant has a specific risk-reward profile. Option buyers have limited risk (the premium paid) and unlimited profit potential. Option sellers, on the other hand, have limited profit (premium received) but potentially unlimited risk.

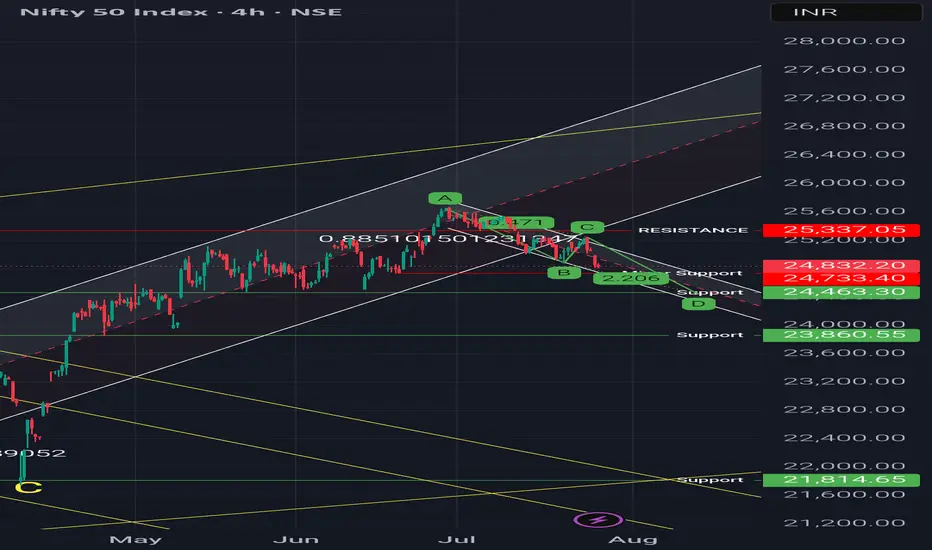
Regression channel & Harmonic pattern - Short term bearish trendObservations:
1. It is short term bearish trend as long as price holds above 24400
2. Price is below 50 DEMA
Possible Scenarios:
1. Price may attempt a mean reversion toward the median line of the channel
2. A break above could retest the 25,240–25,337 resistance zone, up move can only be considered when weekly candle will closed above that level because on weekly time frame there is 4 crows formation.
3. Harmonic patterns (1:1) suggests, the level of 24470 Support level in coming 10-15 trading days.
EURAD POTENTIAL LONGLooking at EURAD on the 1h timeframe,currently looking to take a long position upon the retest of the recently formed 4h and 1h demand zone.A break below the recently formed swing low will invalidate the long.

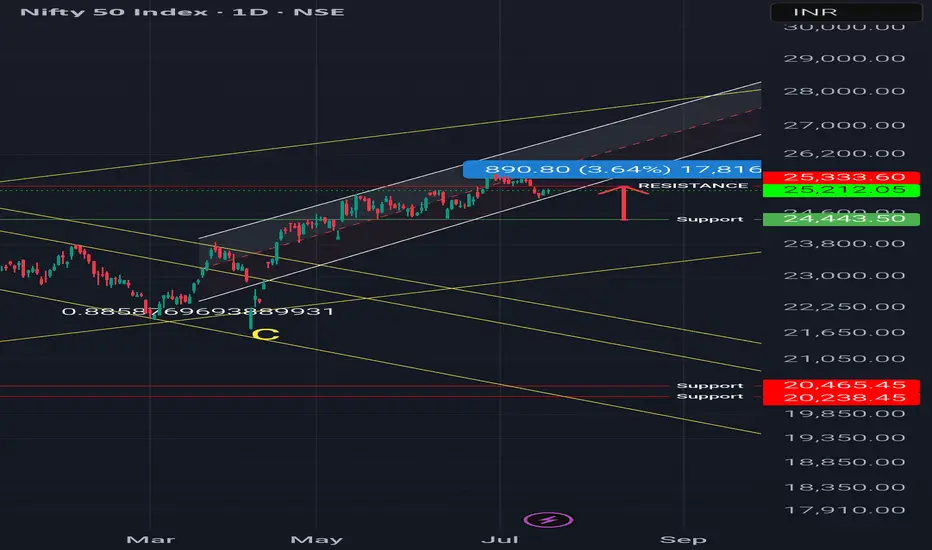
Nifty Outlook - Regression Channel 1. Confluence of regression channel + support/resistance = Trading Move expected in this week or next
2. Support at 24,443
3. Resistance is at 25300-350
If it crosses the resistance we will get to see the New High in Nifty.
AUDCAD POTENTIAL SHORTLooking at AUDCAD on the 4h timeframe,currently looking to take shorting positions upon the retest of the recently formed daily supply zone which also confluences withe retest of the level in which the market broke out of and the inner 4h and 1h supply zones.

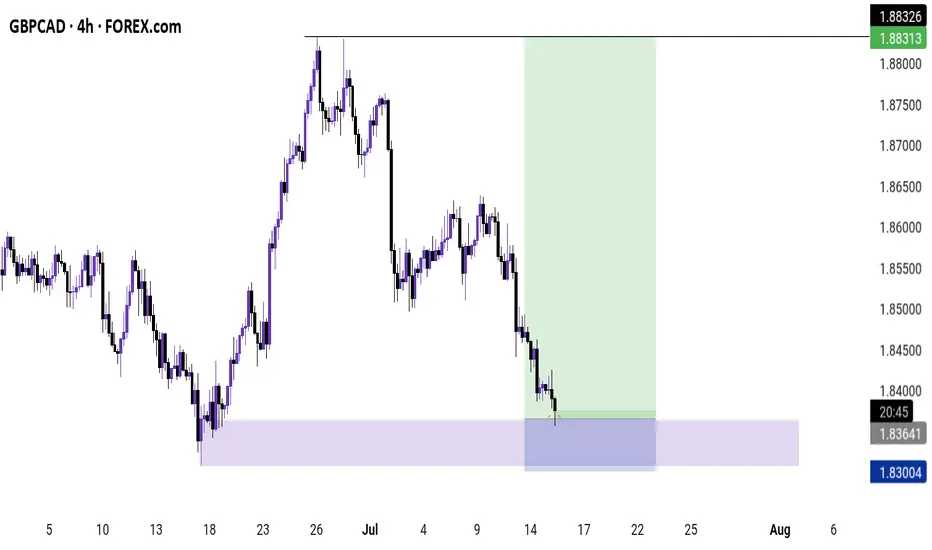
GBPCAD POTENTIAL FOR THE UPSIDELooking at GBPCAD, currently looking to take long positions on the current retest of the daily demand zone which also confluences with the retest of the recently formed 4h and 1h demand zones.Use the lower timeframes to confirm the move and use proper risk management should you decide to join me
US30 potential for the upsideLooking for US30 to push to the upside upon the retest of the recently created 4h/1h demand zone.Use proper risk management should you join me.

Head and Shoulder pattern - GoldGold is forming head and shoilder pattern and might give us a good pullback to form the roght shoulder before dropping down to complete the pattern.

#nifty50 ANALYSIS FOR TOMORROWNSE:NIFTY
#nifty50 ANALYSIS FOR TOMORROW 🔺
❇️ IMPORTANT LEVELS 🚀
❇️ Support: 24268-24196-24101
❇️ Resistance: 24432-24528-24601-24675
👉🏻 PURPLE LINE: 24364-24310 is a key level for selling.
👉🏻 thetradeforecast 🇮🇳

Confluence level - Nifty it can act as support or reversal 1. Downward regression channel bottom
2. Ascending Channel Bottom
3. Abc correct pattern 1:1
4. Previous Support level
What is confluence?
It's meeting point or multiple technical parameters coincides, like I mentioned above
What to expect?
1. Reversal if prices goes above 23400
2. If any short comming occurs next level could be 20200

Be cautiousLooking at a monthly timeframe we can see a major trendline starting from year 2020 has been broken. Further on daily timeframe, clear head and shoulder pattern has formed. Looking at this I suggest if someone is holding shares in Bank nifty stocks Should consider, either Booking Profit, loss or exit when they can.
Please suggest if I’m wrong….

technical analysis in tradingTechnical analysis seeks to predict price movements by examining historical data, mainly price and volume. It helps traders and investors navigate the gap between intrinsic value and market price by leveraging techniques like statistical analysis and behavioral economics.
What are the best technical analysis indicators for day traders? The best technical indicators for day trading are the RSI, Williams Percent Range, and MACD. These measurements show overbought and oversold levels on a chart and can help predict where a price is likely to go next, based on past performance.

TCS Good chart structure.
#TCS
Good chart structure. Stock is heading to cross 4592, which is its all time high.
Target 4575/4900
Stop loss 4280
I am just representing my views
For educational purposes only.

Axis Bank Simple Trend Analysis!!AB can bounce from 1169 to 1189 in coming days and Ab has broken daily & weekily resistance trendline and also retested at the end on the day.
May a bounce can come if open above weekly trendline (1170) or gap up. if not another buying oppurtunity is will be at 1144 where both daily n weekly are intersecting.


SENSEX // Levels // 15 min"Welcome to SkyTradingZone "
Hello Everyone 👋
Current Price: 81,183.93
Day’s Range: 80,981.93 - 82,254.791.
Key Support and Resistance Levels:
Support Levels: 81,000, 80,900, 80,700
Resistance Levels: 81,200, 81,450, 81,700
As of September 11, 2024, the BSE Sensex levels are:
5 DMA: Bullish at 81,843.71
10 DMA: Bearish at 82,061.98
20 DMA: Bullish at 81,340.03
50 DMA: Bullish at 80,693.01
100 DMA: Bullish at 77,852.18
200 DMA: Bullish at 74,791.88

BANKNIFTY // Levels // 1h "Welcome to SkyTradingZone "
Hello Everyone 👋
BANKNIFTY:
Current Price: 51,103.85
Day’s Range: 50,447.30 - 51,380.05
52-Week Range: 42,105.40 - 53,357.701.
Key Support and Resistance Levels:
Support Levels: 50,900, 50,600, 50,300
Resistance Levels: 51,200, 51,500, 51,800

Kitex support and resistance 4 hour Kitex Garments are: First support: ₹469.63, Second support: ₹450.87, and Third support: ₹441.48.
Support Levels:
S1: ₹428.90
S2: ₹392.65
S3: ₹373.30
Resistance Levels:
R1: ₹484.50
R2: ₹503.85
R3: ₹540.10

NIFTY50 1month #Nifty50 ....
Nifty behaviour Is Similar Like Bank ...
And Nifty Cross 24800 Level Too plus First Candle Too ...
Nobody Going To Buy ....
I Know We Can't target Seller Sitting With Big Profits ..
But This Is Intraday ....
We Have to Target Intraday Seller ...

HINDALCO Support and Resistance HINDALCO is currently in negative trend. If you are holding short positions then continue to hold with daily closing stoploss of 685. Fresh long position can be initiated if HINDALCO closes above 685 levels.
HINDALCO Support 663 - 658 - 651
HINDALCO Resistance 674 - 681 - 686

#ASHOKA , READY TO BLAST * * * !!#ASHOKA , READY TO BLAST * * * !!
- BREAKOUT of Rounding Bottom !! ( 4 Hourly )
- BREAKOUT RE-TEST DONE !! ( Hourly )
LOOKING FANTASTIC @
For SHORT-TERM !!
ENTRY : 278 ( 15 min closing )
STOP-LOSS : 266 ( 15 min closing )
TARGET : 320
ENJOY YOUR PROFITS :))) @ @

# AXISBANK Here are the graph of AXISBANK # AXISBANK
Here are the graph of AXISBANK
there I have mentioned support and resistance
