APOLLOHOSP - Range-to-Reversal Attempt from Demand Zone💹 Apollo Hospitals Enterprise Ltd (NSE: APOLLOHOSP)
Sector: Healthcare | CMP: 7348
View: Range-to-Reversal Attempt from Demand Zone | Early Momentum Rebuild
Chart Pattern: Accumulation
Candlestick Pattern: Strong Bullish Marubozu | Bullish Engulfing
Price Action:
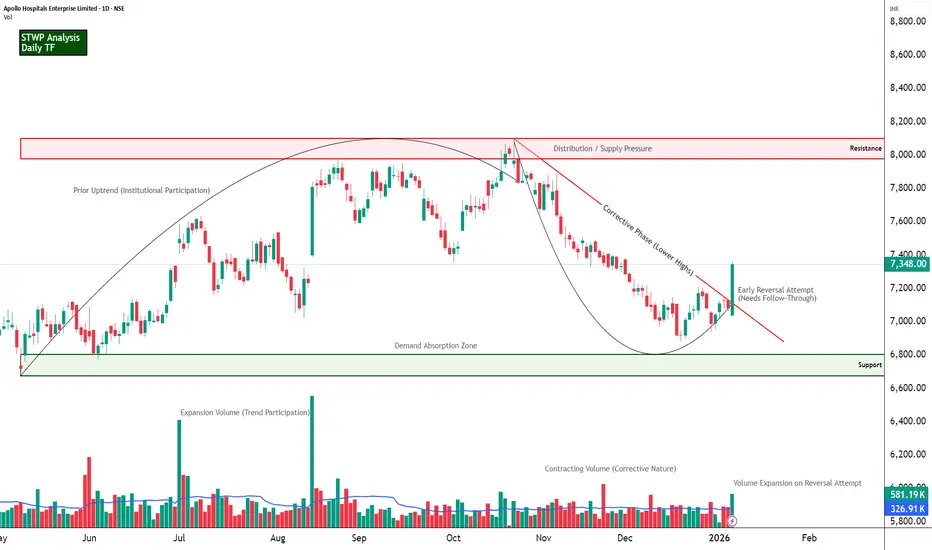
APOLLOHOSP has been in a corrective phase after a prior uptrend, trading within a descending structure marked by a clear trendline connecting lower highs. Price recently reacted strongly from a long-term support zone near the lower boundary of the range, forming a decisive bullish candle that signals demand absorption at lower levels. While the broader structure still carries corrective characteristics, the recent move reflects an early attempt at reversal and mean reversion, with price pushing back toward the mid-range as it approaches the declining supply line and overhead resistance zone.
Technical Analysis (Chart Readings):
The chart reflects a high-confluence bullish technical state where multiple indicators are aligning simultaneously. Price has printed a strong bullish Marubozu / engulfing candle, indicating clear buyer dominance with minimal intraday supply, and this move is accompanied by Bollinger Band expansion following a squeeze, pointing to a volatility release after a consolidation phase. Trend alignment is visible through the upward crossover of EMA 9–20 and price holding above the EMA 200, further supported by bullish SuperTrend and VWAP structure, suggesting acceptance of higher price levels. Momentum indicators reinforce this shift, with RSI at 60.52 signalling a breakout into strength territory, MACD remaining positive with an expanding histogram, ADX near 29.87 reflecting a strengthening trend environment, and ROC at 4.17 percent confirming positive rate-of-change momentum. Volume readings show active participation, with current volumes meaningfully above average, highlighting conviction behind the move rather than a low-liquidity spike. Relative strength versus NIFTY at 4.14 percent indicates short-term outperformance, while the mid-range 52-week positioning suggests the move is occurring within structure rather than at an extreme, together portraying a synchronized alignment of price, trend, momentum, volatility, and volume consistent with a developing directional expansion phase.
Key Levels (Chart Readings):
The chart highlights a well-defined demand–supply structure shaping price behaviour. On the downside, a strong demand zone is visible in the 6900–6800 region, from where price has repeatedly found support, indicating sustained buying interest and accumulation at lower levels. This zone is further reinforced by clearly marked support levels around 7138.67, 6929.33, and 6818.67, establishing a layered support base rather than a single-point level. On the upside, price has previously reacted sharply from the overhead resistance band near the 7800–8000 zone, marked as a possible supply area, suggesting distribution and selling pressure at higher levels. Intermediate resistance levels around 7458.67, 7569.33, and 7778.67 indicate zones where price has struggled to sustain upward momentum in the past. The recent bounce from the demand zone back toward the mid-range reflects a range-to-reversion move within structure, while the overhead resistance is still relatively weak but present, implying that acceptance above these zones would be required for sustained upside. Overall, the chart reads as a market transitioning from demand-led support toward a test of overhead supply, with price currently navigating between clearly defined structural boundaries rather than moving in an uncharted zone.
Demand & Supply Zones (Chart Readings)
The chart outlines a clearly defined demand–supply structure guiding near-term price behaviour. A possible swing demand zone is observed between 7091.50–7072.50, where price has previously attracted sustained buying interest, establishing a structural base within the broader range. Nested within this area, a possible intraday demand zone around 7091.50–7077.50 highlights immediate short-term demand, indicating active participation at these levels. On the upside, possible intraday supply zones are identified near 7282.00–7294.50 and 7321.00–7331.50, where prior price reactions suggest the presence of supply and potential short-term resistance. Collectively, these zones frame the current price environment, with price positioned between nearby demand and overhead supply, making them important reference areas for observing future price reactions.
STWP Trade Analysis:
APOLLOHOSP has triggered a decisive bullish expansion, marked by a wide-range green candle supported by high volume, indicating strong demand emergence after a prolonged corrective phase. From an intraday perspective, the stock holds a bullish bias above the 7360 zone, with the structure allowing for momentum continuation toward 7986.88 and 8404.8, while risk remains defined below 6837.6, making this setup suitable only for traders comfortable with volatility. From a swing (hybrid) standpoint, the same entry zone supports a broader mean-expansion framework over the next few sessions, where sustained participation can open upside potential toward 8927.2 and 10102.6, with structural invalidation placed near 6576.4. The STWP view remains constructively bullish, with the trend aligned upward, RSI at 60.52 reflecting healthy strength without exhaustion, and volume expansion (Vol X 2.01) confirming conviction behind the move. The learning takeaway from this setup is to prioritise structure, controlled risk per trade, and post-trade review over prediction, especially during high-momentum phases.
Final outlook remains positive with strong momentum and an upward trend, while risk is elevated due to volatility, making disciplined execution and risk management critical as long as volume support sustains.
⚠️ STWP Educational & Legal Disclaimer
This content is shared strictly for educational and informational purposes only. All discussions, illustrations, charts, price zones, and options structures are meant to explain market behaviour and do not constitute any buy, sell, or hold recommendation. STWP does not provide investment advice, trading calls, tips, or personalized financial guidance, and is not a SEBI-registered intermediary or research analyst.
The analysis is based on publicly available market data and observed price–derivatives behaviour, which is dynamic in nature and may change without notice. Financial markets involve inherent risk, and derivatives carry elevated risk, including the potential for significant capital loss. Factors such as option premiums, implied volatility, open interest, delta, and other Greeks can shift rapidly and unpredictably.
All trading and investment decisions, including position sizing and risk management, are solely the responsibility of the reader. Always consult a SEBI-registered investment advisor before taking any financial action. STWP, its associates, or affiliates shall not be liable for any direct or indirect loss arising from the use of this material. Past patterns, structures, or historical behaviour must never be treated as guarantees of future outcomes.
Position Status: No active position in this instrument at the time of analysis
Data Source: TradingView & NSE India
💬 Did this add value?
🔼 Boost to support structured learning
✍️ Share your views or questions in the comments
🔁 Forward to traders who value disciplined analysis
👉 Follow for clean, probability-driven STWP insights
🚀 Stay Calm. Stay Clean. Trade With Patience.
Trade Smart | Learn Zones | Be Self-Reliant 📊
Apollohospitalanalysis
APOLLOTYRE : adjusting its base.📘 APOLLOTYRE – Technical Analysis & Trading Plan
(Chart timeframe: Daily | Structure & Wave-based analysis)
🔍 Market Structure Overview
APOLLOTYRE has already signaled a Change of Character (CHoCH) after breaking its prior bearish structure, confirming a trend transition from distribution to accumulation. Since then, price has respected higher lows and moved within a rising structure.
Currently, price is correcting within a healthy pullback phase, aligning with a Wave 4 retracement, while the broader trend remains bullish.
📐 Key Technical Zones (From Chart)
• Wave 4 Completion / Demand Zone: 492 – 510
• Invalidation Level / SL: 488.55 (Day close below)
• First Target Zone: 546 – 553
• Second Target: 570
📊 Technical Interpretation
The ongoing decline appears corrective rather than impulsive, suggesting trend continuation bias.
Price is consolidating above the rising trendline, indicating structural strength.
The 492–510 zone overlaps with prior demand and trendline support, making it a high-probability accumulation area.
Holding above 488.55 keeps the bullish structure intact.
A sustained move above recent swing highs confirms Wave 5 activation.
🎯 Prediction / Probable Scenario
If price holds above 492–510, APOLLOTYRE is likely to resume its upward trajectory.
Initial expansion expected toward 546–553, where partial profit booking is advisable.
Acceptance above the first target zone may extend the rally toward 570.
Failure to hold 488.55 would invalidate the bullish count and open room for deeper correction.
🟢 Buying Strategy (Swing / Positional)
Buying Zone: 492 – 510 (on confirmation / bullish price action)
Stop Loss: Day close below 488.55
Target 1: 546 – 553
Target 2: 570
Maintain partial profit booking at Target 1 and trail SL for positional continuation.
This setup offers a favourable risk–reward structure, suitable for capturing a potential impulsive Wave 5 move.
🎓 Educational Notes for Traders
CHoCH (Change of Character) signals early trend reversal before traditional indicators.
Wave 4 corrections are typically sideways or overlapping and should not break key demand zones.
Strong trends correct in price and time, not always deeply in price.
The best trades emerge when structure, trendline, and demand zones align.
Always wait for price confirmation, not prediction.
🧠 Risk Management Reminder
• Avoid over-leveraging during corrective phases
• Respect day-close based stop losses
• Risk only 1–2% capital per trade
• Partial booking improves psychological discipline
⚠️ Disclaimer
I am not a SEBI-registered analyst. This analysis is for educational purposes only and should not be considered financial advice. Please consult your financial advisor before taking any trade.

APOLLOHOSP – Ranging Channel Breakout Case Study (Educational)________________________________________
📊 APOLLOHOSP – Technical & Fundamental Educational Snapshot
Ticker: NSE: APOLLOHOSP | Sector: 🏥 Hospitals & Healthcare Services
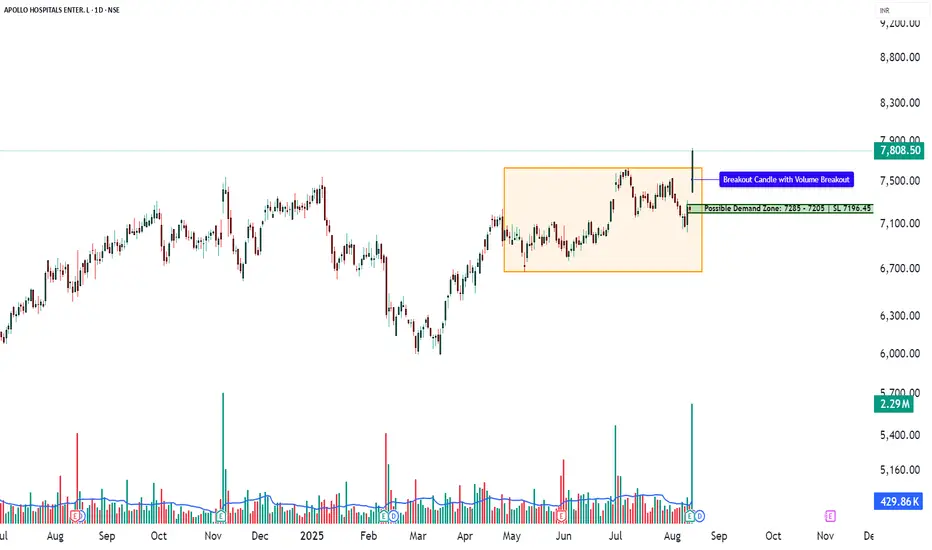
CMP: ₹7,808.50 ▲ (as of 13 Aug 2025)
Rating: ⭐⭐⭐⭐☆ (Moderately Bullish Setup – Educational Purposes Only)
Pattern Observed: 📈 Ranging Channel Breakout
________________________________________
“Apollo Hospitals is on fire! After reporting a stunning 42% rise in Q1 net profit, the stock zoomed nearly 8%, now hovering near its 52-week high. Technical charts are flashing a powerful ‘Strong Buy’ signal across multiple indicators—momentum is undeniable. With balanced options interest and analyst targets pegged around ₹8,100, the stock may still have room to run. A breakout past ₹7,800 could set the stage for the next leg higher!”
________________________________________
Chart Pattern & Technical Analysis:
Close: ₹7,808.5 — strong bullish momentum after Ranging Channel breakout.
Candle: Big bullish bar with multiple confirmations — 52-week breakout, RSI breakout, MACD crossover, Bollinger Band breakout, bullish SuperTrend.
Momentum: WVAP bullish; RSI 68, MACD Buy, CCI 235, Stochastic 96.
________________________________________
Volume Analysis:
Volume: 2.29M shares traded — 5× the 20-day average (429.86K).
Signal: Exceptional participation confirming a decisive 20-day volume breakout.
________________________________________
Support & Resistance:
Resistance: ₹7,969, ₹8,130, ₹8,420.
Support: ₹7,518, ₹7,228, ₹7,060.7.
Outlook: Possible breakout opportunity with swing trade potential.
________________________________________
Learnings:
Q1 FY26 Results: PAT ↑ ~42% YoY to ₹433 cr; revenue ↑ ~15% YoY to ₹5,842 cr; stock rallied 5–6% post-results.
AI Focus: Plans to double AI investments in 2–3 years to boost efficiency & patient outcomes.
Value Unlocking: Spin-off & listing of digital health & pharmacy unit in 18–21 months.
Share Swap: 195.2 shares in new entity for every 100 Apollo shares; Apollo to retain ~15% stake.
________________________________________
Investment Outlook & Conclusion:
📈 Bullish Case:
5th straight quarter of profit growth; Q1 beat estimates.
Expanding margins via premium care, diagnostics, and digital.
Demerger of digital health & pharmacy arm could unlock value.
AI investments to enhance efficiency & returns.
Rising insurance penetration & healthcare spending favor leaders.
________________________________________
📉 Bearish Case:
Premium valuation risks de-rating if growth slows.
Demerger success hinges on smooth execution.
Regulatory changes could impact margins.
Heavy capex & competition may delay returns.
________________________________________
📅 Short vs Long Term:
Short-term (1–3M): Possible follow-through gains from Q1 beat; track Q2 updates & demerger progress.
Long-term (12–24M): Growth from core hospitals + value creation via digital arm listing & AI-driven efficiency.
________________________________________
📊 STWP Trade Analysis:
Trend: Bullish continuation — price broke key range and sustained momentum.
Sample Trade Setup:
Entry: ₹7,840 | Stop: ₹7,011.95
Reference Levels: ₹8,668 (~1:1 RR), ₹9,496 (~1:2 RR)
💡 These prices are only for demonstrating risk–reward calculations and position planning — not for live execution.
________________________________________
Conservative Setup:
Entry Zone: ₹7,808.50–₹7,840 | Stop: ₹7,723.24
Reference Levels: ₹8,064, ₹8,235
(For learning position sizing and risk control)
________________________________________
Pullback Watch:
Zone: ₹7,717.56 | Stop: ₹7,594 | Potential retest area
Potential Use: Studying pullback retests in breakout structures.
________________________________________
Possible Demand Zone(on Daily Time Frame): 7285 - 7205 | SL 7196.45
This is for observing historical demand behaviour — not a call to buy.
________________________________________
Market View (Based on Current Data):
Overall Bias: Bullish positioning.
Trend: Uptrend likely if ₹7,800–₹7,850 holds as support.
Volatility: Moderate (IV ~22–26).
OI Insight: Strong call writing above spot & put writing below — bullish stance with support defense.
________________________________________
🔍 Option Structures – For Learning Purpose
(Prices, Greeks & OI data are from market snapshot on 13 Aug 2025)
________________________________________
7800 CE – LTP ₹155.60
📊 Delta: 0.54 | Theta: -6.27 | IV: 22.39%
💡 Breakeven: ₹7,955.60
Why it’s worth studying:
ATM strike with quick reaction to spot moves (Delta ~0.50)
Strong OI build-up (+1.52L) & high liquidity (37k contracts)
Positioned just above spot; could capture momentum on a 7,850+ breakout
________________________________________
7600 PE – LTP ₹66.60 | Contra View
📊 Delta: -0.27 | Theta: -4.19 | IV: 25.18%
💡 Breakeven: ₹7,533.40
Why study it:
Strong short build-up in Puts (+3.32L OI) shows confidence price stays above this level
~200 pts below spot, acting as a buffer support zone
Higher IV means time decay favours sellers if support holds
________________________________________
Bull Call Spread
🟢 Buy: 7800 CE @ ₹155.60
🔴 Sell: 8000 CE @ ₹72.20
💰 Net Debit: ₹83.40 | Breakeven: ₹7,883.40
Why study it:
Lowers cost vs. naked CE buy by pairing ATM buy with OTM sell
Positive delta for upside, with loss capped to net debit
8000 strike OI acts as a profit cap zone, helping define risk-reward
Reduces theta decay compared to a single long option
________________________________________
📘 My Trading Setup Rules
Avoid Gap Plays
→ Check pre-open price action to avoid trades influenced by gap-ups/gap-downs.
Breakout Entry Only
→ Enter trades only if price breaks previous day’s High (for bullish trades) or Low (for bearish trades).
Watch Volume for Confirmation
→ Monitor volume closely. No volume = No trade.
Enter on Strong Candle + Volume
→ Execute the trade only if a strong candle appears with increasing volume in the direction of the trade.
Defined Risk:Reward Only
→ Take trades only if R:R is favorable (ideally ≥ 1:2).
Premium Disclaimer
→ Option premiums shown are based on EOD prices — real-time premiums may vary during execution.
Time Frame Preference
→ Trade with your preferred time frame — this strategy works across intraday or positional setups.
________________________________________
⚠️ Disclaimer – Please Read Carefully
The information shared here is meant purely for learning and awareness. It is not a buy or sell recommendation and should not be taken as investment advice. I am not a SEBI-registered investment advisor, and all views expressed are based on personal study, chart patterns, and publicly available market data.
Trading — whether in stocks or options — carries risk. Markets can move unexpectedly, and losses can sometimes be larger than the money you have invested. Past performance or past setups do not guarantee future results.
If you are a beginner, treat this as a guide to understand how the market works — practice on paper trades before risking real money. If you are an experienced trader, remember to assess your own risk, position sizing, and strategy suitability before entering any trade.
Data, prices, and analysis are based on information available as of 12 August 2025, and market conditions can change at any time. Always verify with reliable sources and consult a SEBI-registered financial advisor before making any real trading decision.
By reading, watching, or engaging with this content, you acknowledge that you take full responsibility for your own trades and investments.
________________________________________
💬 Found this useful?
Drop your thoughts, questions, or setups in the comments — let’s grow together!
🔁 Share this post with fellow traders and beginners to spread clean, structure-based learning.
✅ Follow simpletradewithpatience for beginner-friendly setups, price action insights, and disciplined trading content.
🚀 Stay Calm. Stay Clean. Trade With Patience.
Trade Smart | Learn Zones | Be Self-Reliant 📊
________________________________________
APOLLO HOSPITAL - Inverted Head and ShoulderApollo Hospitals Enterprise Ltd, First Quarter Result FY25
➡️Recorded highest-ever revenue, up 15% YoY.
➡️PAT jumped 83% YoY led by the growth in topline.
Revenue 🔼 15% at ₹5,086 crore
EBITDA 🔼 33% at ₹675 crore
Net Profit 🔼 83% at ₹305 crore

Apollo hospitals positional trading ideasIt is forming a falling wedge pattern. inside the falling wedge, there is a double bottom pattern you can see.
Stock is in a up trend.
it also retesting the weekly breakout level.
If it breaks the wedge pattern upside. it may go higher.
Disclaimer: All information provided here is for educational purposes and not a recommendation, advice, research report, or stock tip of any nature. Analysis Posted here is just our view/personal study method on the stocks, commodities or other instruments and assets. Do your own analysis or consult your financial advisor before making any investment decision.

Apollo hospital future tradeApollo hospitals for positional trade.
It has touched it's demand zone.
We can see some buying from this area.

APOLLOHOSP Signaling Bearish Point Of ViewAfter years of rallying up, then it turns to a fall forming a double top pattern. When we draw from the high point to the low point using Fibonacci retracement, I believe it reaches the 0.5 Fibonacci retracement level and continues the fall. After reaching this level, confirm and make an entry
"One reason for the fall is because there are ongoing court issues regarding hospitals."
"Note: I will maintain charts in a simple way. Only those with basic knowledge of technical analysis will be able to understand what I am posting."

Apollo Hospital BULLISHHaving a bullish view in APOLLO HOSPITALS as per weekly charts.
Refer the video for details.

Technical Symphony of Bullish Signals in Apollo Hospitals Hello Friends,
Technical Analysis Summary of Apollo Hospitals
In this technical analysis, we have examined the price action of Stock APOLLO HOSPITALS across multiple timeframes, focusing on the weekly, daily, and hourly charts. The analysis aimed to identify potential bullish signals and assess the ongoing trend to aid in decision-making for traders and investors.
Weekly Chart
On the weekly chart, we observed the completion of waves (1), (2), (3) & (4) and now possibly
we are unfolding wave (5) on weekly. Additionally, the Moving Average Convergence Divergence (MACD) remained positive and above the zero line, supporting the bullish sentiment. The Relative Strength Index (RSI) also indicated strength in the upward move.
Daily Chart
Switching to the daily timeframe, we had completed wave 1 and 2 inside the weekly wave (5) and now possibly we are unfolding wave 3 of (5), also we witnessed two range breakouts, both accompanied by good volumes, signaling a strong uptrend. The MACD displayed an uptick above zero line after a minor pullback, further validating the positive outlook. Additionally, the RSI reflected strong positive momentum, aligning with the bullish bias on higher timeframes.
Hourly Chart
On the hourly chart, the stock exhibited an ascending triangle pattern, and its breakout with significant volume further supported the bullish continuation. The RSI on the hourly chart remained in a robust positive territory, emphasizing the strength of the upward move, rsi level is too high and down tick, so it might give any dips that can used as an opportunities to go long.
Moving Averages
On all three timeframes like hourly, daily, and weekly charts, this stock traded above the 50-period Exponential Moving Average (EMA), 100-period EMA, and 200-period EMA. This alignment with the EMAs indicated a consistent and strong bullish trend across different time horizons.
Conclusion
Based on the analysis of multiple time frames and multiple technical indicators, including the Elliott waves, MACD, RSI, and Moving Averages, Stock APOLLO HOSPITALS demonstrated a compelling bullish outlook. One can go long now with small quantity and add some in dips (if any) with invalidation levels mentioned on chart as a red lines.
Technical Symphony of Bullish Signals in Apollo Hospitals looking potential upward continuation.
I am not Sebi registered analyst. My studies are for educational purpose only.
Please Consult your financial advisor before trading or investing.
I am not responsible for any kinds of your profits and your losses.
Most investors treat trading as a hobby because they have a full-time job doing something else.
However, If you treat trading like a business, it will pay you like a business.
If you treat like a hobby, hobbies don't pay, they cost you...!
Hope this post is helpful to community
Thanks
RK💕
Disclaimer and Risk Warning.
The analysis and discussion provided on in.tradingview.com is intended for educational purposes only and should not be relied upon for trading decisions. RK_Charts is not an investment adviser and the information provided here should not be taken as professional investment advice. Before buying or selling any investments, securities, or precious metals, it is recommended that you conduct your own due diligence. RK_Charts does not share in your profits and will not take responsibility for any losses you may incur. So Please Consult your financial advisor before trading or investing.
some significant snapshots are shared below
Possible Weekly Elliott wave structure
Possible Elliott wave structure on daily chart
Range breakouts on daily time frame with good intensity of volumes
Price given ascending triangle's range breakout with good intensity of volumes on hourly chart
MACD positive on hourly chart
MACD uptick after down fall above zero line on Daily chart
MACD positive and above zero line on Weekly chart
RSI breakout and uptick above 60+ on weekly
RSI breakout and uptick above 60+ on daily
RSI strong positive on hourly
One possibility

Apollo Hospitals possible Elliot wave countsHello Friends,
Here we had shared possible Elliott wave counts of Apollo Hospitals, in which price has given breakout along with good intensity of volumes in daily time frame, as per Elliott wave structure, chart says that either we are in impulse or in correction, in both scenarios we have to go towards north direction first then whatever may be, as per Elliott wave structure, if we are in impulse then we should have to unfold it as wave (1)-(2)-(3)-(4)-(5) in which we already had completed wave (1) and (2) and currently we are unfolding wave (3), and in other scenario, means if we are in correction phase, then we should have to unfold it as wave (A)-(B)-(C) in which we had completed wave (A) and (B), and currently we are unfolding wave (C), So whatever scenario it may be, at least we are first going towards (3) or (C).
In this study whatever major trend may be ahead, at least we can enjoy this little upward bull run as a wave (C) or wave (3)
Now in wave (C) or (3) we have completed wave 1 and 2 and currently we are unfolding wave 3, also in wave 3 we have completed wave (i) and (ii) and currently we are unfolding wave (iii).
Overall, we are in (iii) of 3 of (C) or (3).
I am not sebi registered analyst. My studies are for educational purpose only. Please Consult your financial advisor before trading or investing. I am not responsible for any kinds of your profits and your losses.
Some significant snapshots are shared below, please go throughout.
Thanks
RK💕
Price has given Breakout along with good intensity of volume and RK's Magical cloud suggests same bullish bias in daily
Price above daily upper band
Price above weekly upper band
MACD in daily positive
MACD in weekly positive along with breakout in histogram
RSI positive above 60+ in daily
DMI ADX positive in daily
DMI ADX positive in weekly
Most investors treat trading as a hobby because they have a full-time job doing something else.
However, If you treat trading like a business, it will pay you like a business.
If you treat like a hobby, hobbies don't pay, they cost you...!
Disclaimer and Risk Warning.
The analysis and discussion provided on in.tradingview.com is intended for educational purposes only and should not be relied upon for trading decisions. RK_Charts is not an investment adviser and the information provided here should not be taken as professional investment advice. Before buying or selling any investments, securities, or precious metals, it is recommended that you conduct your own due diligence. RK_Charts does not share in your profits and will not take responsibility for any losses you may incur. So Please Consult your financial advisor before trading or investing.

APOLLO HOSPITALS Accumulation happening in apollo hospitals that can serve you with great volatility, not clear about the direction though

Apollo Hospitals possible elliot wave countsHello Friends,
Here we had analyzed the chart of the stock Apollo Hospitals which is convincing bearish bias aligned with price action breaking down trendline along with good intensity of volumes on daily time frame, supporting same view by trend indicators like macd, rsi, bollinger bands, dmi adx and Elliot waves. As per Elliot wave structure it is clearly in correction phase in which most probably seen that we are unfolding corrective waves in zigzag pattern, in which we can assume that we had finished wave A and B and now possibly we are unfolding wave C which should unfold in 5 subdivisions, in wave C we had completed one lower degree wave 1 and wave 2, Once low of wave 1 is taken by bears then it would confirm that wave 3 of C has started to unfold. Overall we can say we are assuming Bearish bias in this stock aligned with each and every parameters. I am not sebi registered analyst. My studies are for educational purpose only. Please Consult your financial advisor before trading or investing. I am not responsible for any kinds of your profits and your losses.
All highlights shared below.
Thanks.
Corrective Wave structure
Break-down with Good intensity of Volumes on Daily time frame
Price getting rejection from RK's stopline and closed below RK's mass psychological cloud.
MACD in daily Negative cross over
MACD in weekly already running negative
MACD in monthly already running negative
Price challenging lower band on daily time frame
RSI down tick and below 40 on daily time frame
DMI ADX also supporting same bearish bias in daily time frame
Most investors treat trading as a hobby because they have a full-time job doing something else.
However, If you treat trading like a business, it will pay you like a business.
If you treat like a hobby, hobbies don't pay, they cost you...!
Disclaimer.
I am not sebi registered analyst.
My studies are for educational purpose only.
Please Consult your financial advisor before trading or investing.
I am not responsible for any kinds of your profits and your losses.

Apollo HospitalNSE:APOLLOHOSP Technical Analysis - Price action + Elliot Wave
1.Apollo Hospital is forming Ascending pattern in daily time frame
2.This stock is also following Elliot 5 wave theory.
I have mentioned the levels and stops as per my knowledge. Trade according to your risk and caution. This is not a call, this is only for educational purposes.

APOLLO HOSPITAL SWING TRADEHello, apollo hospital mid term swing trade consider buy above: 3940, target: 4,730, stoploss: 3,640.
LOGIC BEHIND TRADE: Stock has formed w pattern 1d chart & given breakout of swing high resistance, breakout buying strategy (target identified from harmonic xabcd pattern level 0.886) stoploss is taken previous swing low. Risky wisky trade. NSE:APOLLOHOSP

Apollo Hospitals Enterprise Ltd - 24.06.2022Apollo Hospitals Enterprise Ltd - 24.06.2022
The stock is trading @ 3838 levels
There is a HEAD & SHOULDERS Candle Formation in Daily Chart
The prices are at EMA
Neckline @ 3838, Head @ 3362
There is a HAMMER in Daily Chart
One can initiate a BUY Position @ current levels, with Support @ 3751
Watch out for the price action

Apollo Hospitals Enterprise Ltd - 17.06.2022Apollo Hospitals Enterprise Ltd - 17.06.2022
The stock is trading @ 3701 levels
There is a STRONG SUPPORT ZONE @ 3555 levels
There is a HAMMER in Daily Chart
The prices are below EMA
The Fib Levels are 3626, 3697, 3768
One can initiate a BUY @ current levels with SUPPORT @ 3626
Watch out for the price action

#ApolloHospital Trade SetupNSE:APOLLOHOSP
Below 4292 one can short till 4000 +/-
if find support near 4000 +/- one can go long for swing trade.
******whatever charts or levels sharing here or on any other platforms are just for educational purpose only, Not A Recommendation To Buy Or Sell. Please do your own analysis before taking any trade on them. We are not SEBI registered.

APOLLO HOSPITAL PREPARING FOR A TRENDING MOVEThe stock is trading in a pattern and getting ready for a trending move after a long consolidation. Trade after a Breakout or Breakdown. Will try to update this idea.
To motivate me, Please like the idea If you agree with the analysis.
Happy Trading!
InvestPro India Team

NSE:APOLLOHOSP LongNSE:APOLLOHOSP
#NSE:APOLLOHOSP trading bullish and Potential levels marked on chart for reference.

Apollohosp - Potential swing tradeHello guys, trade with caution in these volatile market.
Apollo hospital seems to have corrected for now and has taken support on the trendline, going long from here looks like a good trade but with considerable stoploss.
We are also anticipating the breakout of the triangle formation.
Best buy - 4220
Buy above - 4550
Targets mentioned in the chart above.
Please LIKE, COMMENT and SHARE to motivate and support me. I'll keep on posting new ideas on Indices & Stocks. Be sure to follow so that you don't miss any good trades that might have been rewarding.
Any comments and critiques will be appreciated even if it's of opposite view as a trader can also be right so many times.

APOLLO HOSPITAL LOOKS WEAKApollo Hospital is breaking down the bearish flag and may test lower marked targets on the chart in coming sesisons.
To motivate us, Please like the idea If you agree with the analysis.
Happy Trading!
InvestPro India Team

SELL APOLLO HOSPITALSApollo Hospital is looking weak for marked targets on the chart.
To motivate me, Please like the idea If you agree with the analysis.
Happy Trading!
InvestPro India Team

apollohospital analysis5200 is a good support zone on the basis of demand & supply and option chain data . on 5200 strike price a significant put writing & put call ratio is very high so its high probability that apollohospital make bottom in this zone.
